. 2021 Aug 4;29(8):2424-2440.
doi: 10.1016/j.ymthe.2021.05.005. Epub 2021 May 11.

Plant-derived exosomal microRNAs inhibit lung inflammation induced by exosomes SARS-CoV-2 Nsp12

Affiliations

Plant-derived exosomal microRNAs inhibit lung inflammation induced by exosomes SARS-CoV-2 Nsp12

Yun Teng et al. Mol Ther. .

Abstract

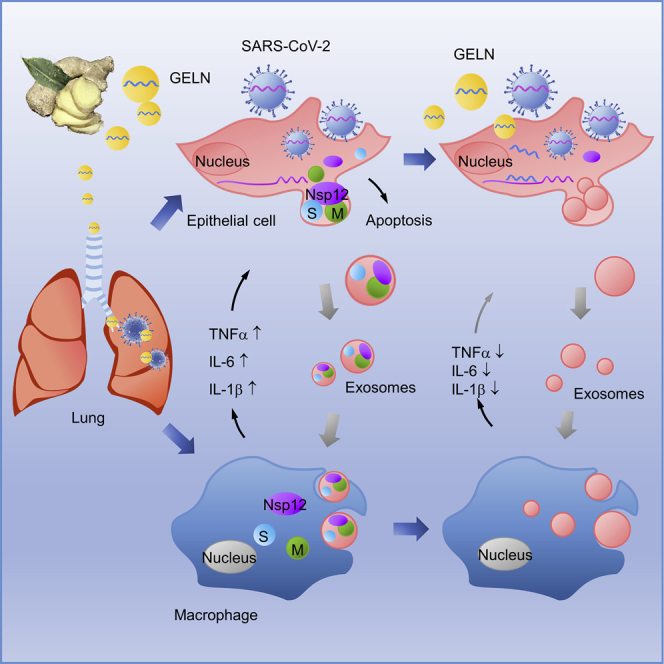
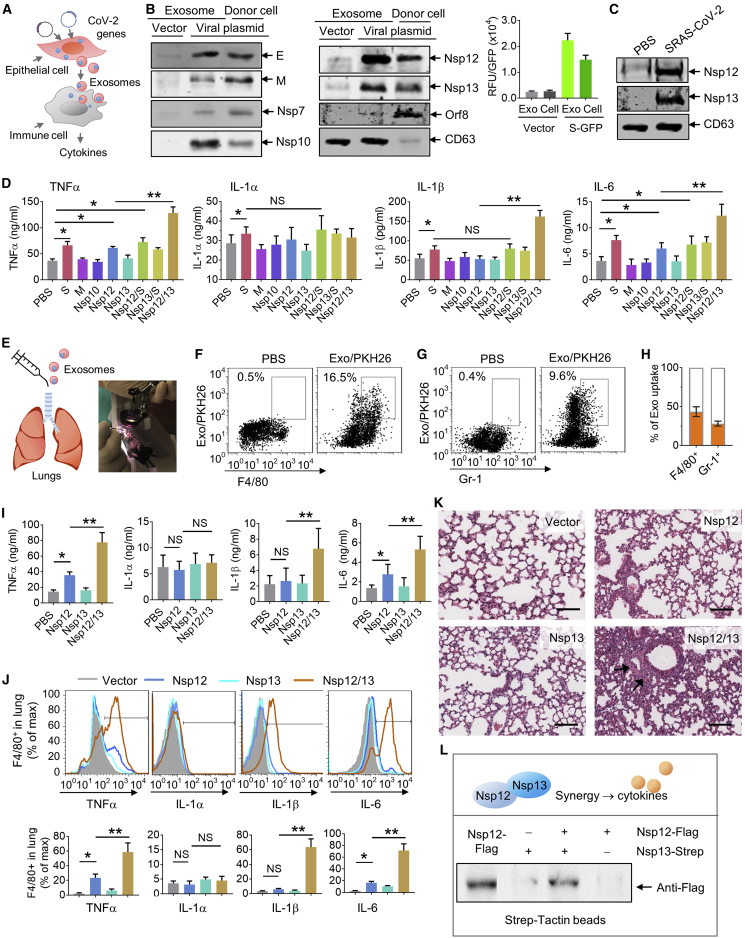
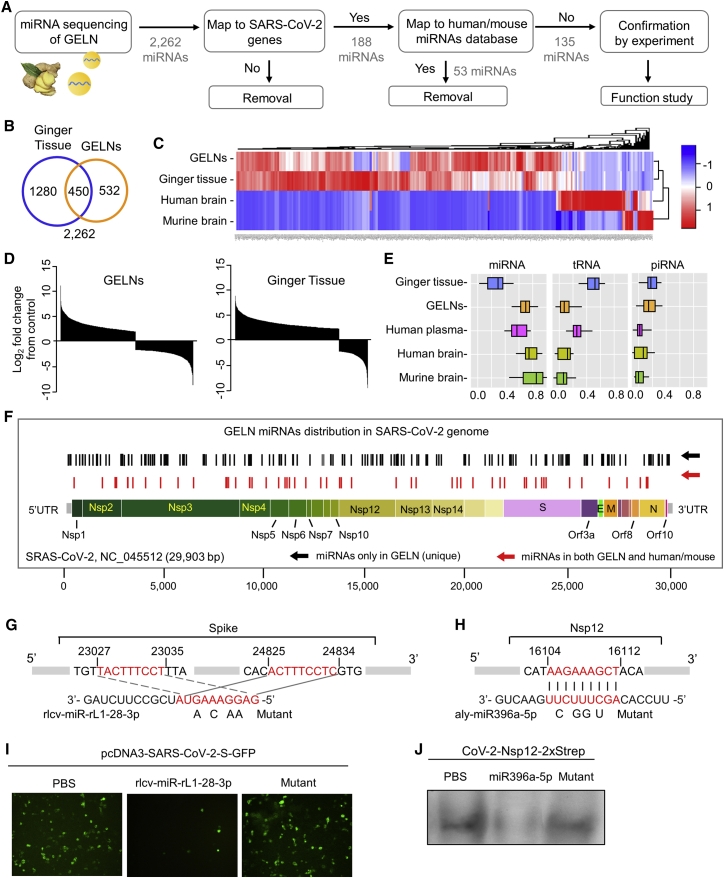
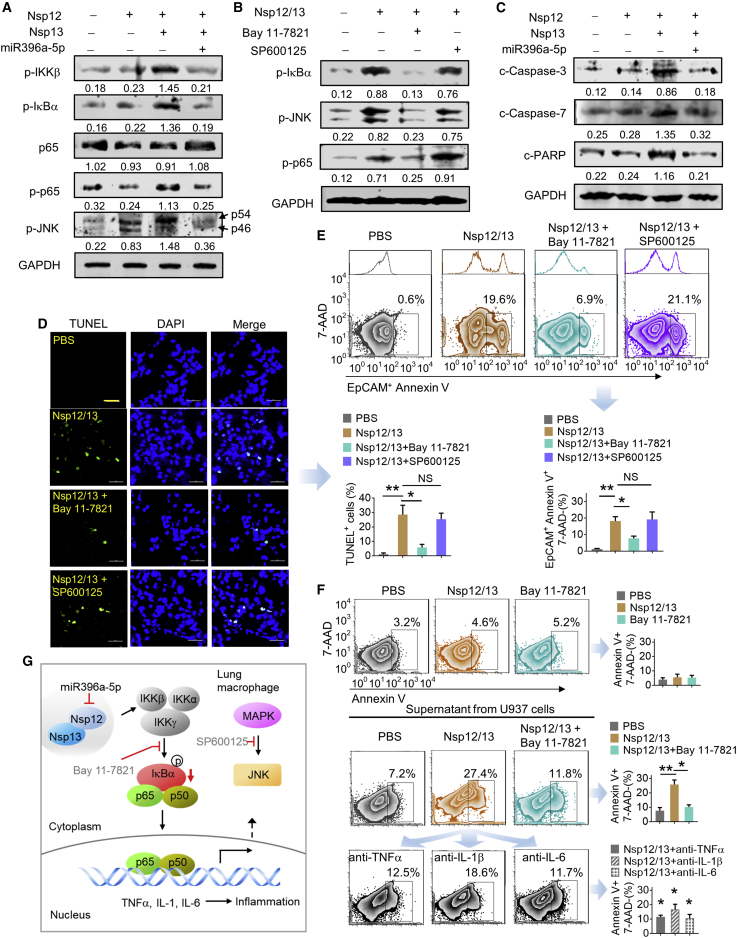
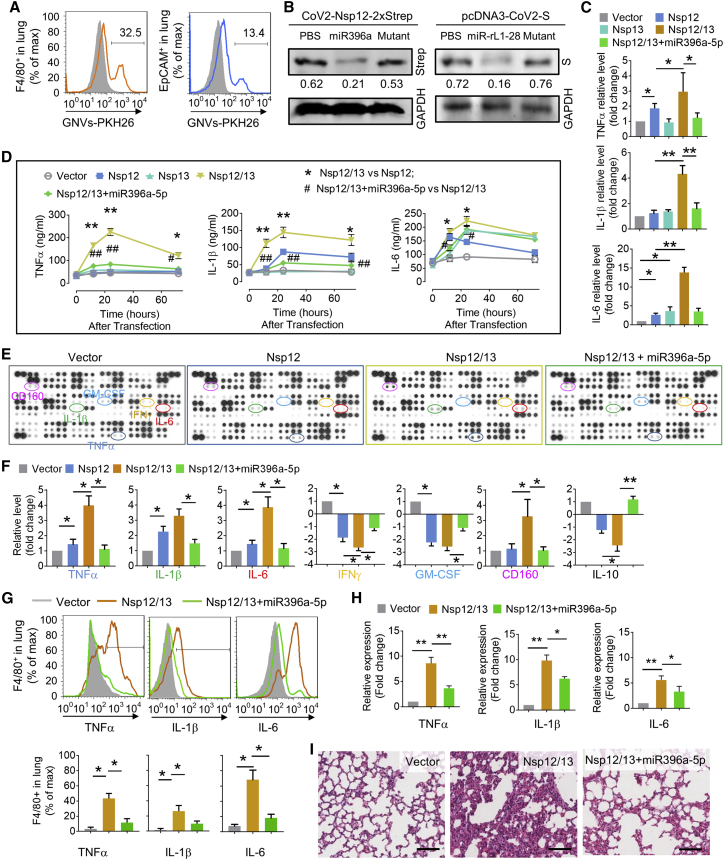
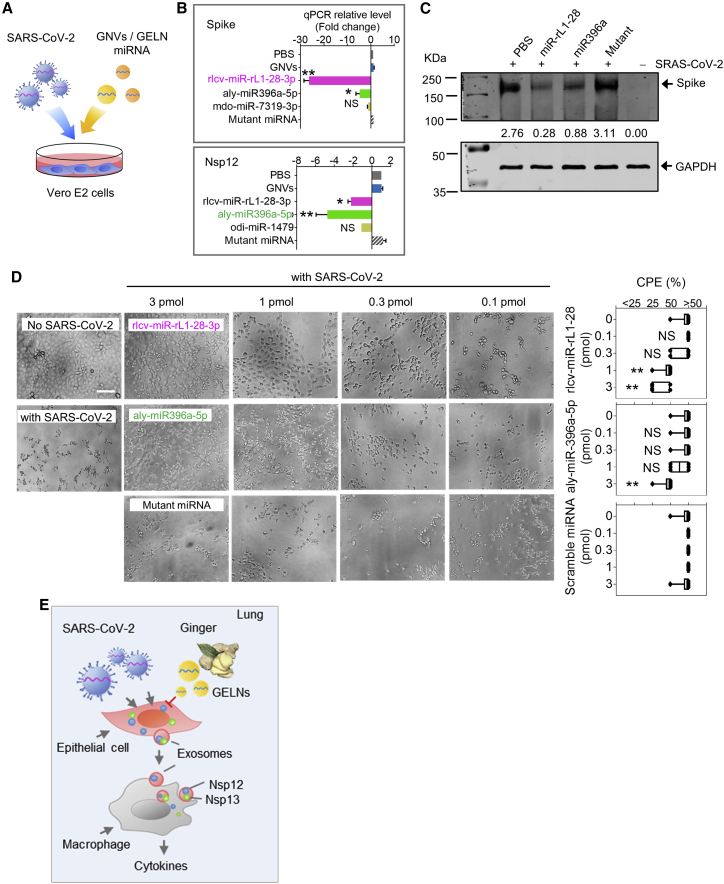
Lung inflammation is a hallmark of coronavirus disease 2019 (COVID-19). In this study, we show that mice develop inflamed lung tissue after being administered exosomes released from the lung epithelial cells exposed to severe acute respiratory syndrome coronavirus 2 (SARS-CoV-2) Nsp12 and Nsp13 (exosomesNsp12Nsp13). Mechanistically, we show that exosomesNsp12Nsp13 are taken up by lung macrophages, leading to activation of nuclear factor κB (NF-κB) and the subsequent induction of an array of inflammatory cytokines. Induction of tumor necrosis factor (TNF)-α, interleukin (IL)-6, and IL-1β from exosomesNsp12Nsp13-activated lung macrophages contributes to inducing apoptosis in lung epithelial cells. Induction of exosomesNsp12Nsp13-mediated lung inflammation was abolished with ginger exosome-like nanoparticle (GELN) microRNA (miRNA aly-miR396a-5p. The role of GELNs in inhibition of the SARS-CoV-2-induced cytopathic effect (CPE) was further demonstrated via GELN aly-miR396a-5p- and rlcv-miR-rL1-28-3p-mediated inhibition of expression of Nsp12 and spike genes, respectively. Taken together, our results reveal exosomesNsp12Nsp13 as potentially important contributors to the development of lung inflammation, and GELNs are a potential therapeutic agent to treat COVID-19.

Keywords: ACE2; IL-1β; IL-6; NF-κB; Nsp12; SARS-CoV-2; TNF-α; exosomes; ginger exosome-like nanoparticle; lung epithelial cells; lung inflammation; macrophages; microRNA; spike.


Conflict of interest statement

Declaration of interests The authors declare no competing interests.

Figures

None
Graphical abstract
Figure 1
Figure 1
Lung epithelial cells release exosomes containing Nsp12 of SARS-CoV-2 that enhances the inflammatory response in lung (A) Schematic representation of the treatment schedule for the effect of lung epithelial cell-derived exosomes containing SARS-CoV-2 proteins on lung immune cells. (B) SARS-CoV-2 protein expression plasmids transfected into lung epithelial A549 cells. (Left and middle panels) Representative blots of viral proteins in exosomes and cells as well as exosomal marker CD63 by western blot using Strep-Tactin-HRP conjugate and antibody to CD63. (Right panel) Intensity of GFP fused with spike (S) protein expressed in exosomes (Exos) and cells using BioTek’s Synergy microplate reader. (C) Representative western blot of exosomes from Vero E2 cells transfected with Nsp12 and Nsp13 plasmids. (D) Cytokines in the medium assessed by ELISA. (E) Schematic representation of intratracheal injection (left panel) and a mouse undergoing laryngoscopy to expose the vocal cords (right panel). (F and G) Exosomes from mouse lung LLC1 cells transfected with SARS-CoV-2 plasmids administered to C57BL/6 mice (5 × 108/kg, body weight, n = 5) by intratracheal injection. After 24 h, the frequencies of F4/80+ cells (F), Gr-1+ cells (G), and PKH26-labled exosomes in the lung from C57BL/6 mice were assessed using flow cytometry. Numbers in boxes indicate the percentage of exosome/PKH26+ cells. (H) Quantification of percentage of exosome/PKH26+ in F4/80+ cells and Gr-1+ cells. (I) (Top panel) Assessment of cytokines in the lungs using ELISA. (J) Cytokines in the F4/80+ cells assessed by flow cytometry. (Bottom panel) Quantification of data from flow cytometry. (K) Representative hematoxylin and eosin (H&E)-stained sections of formalin-fixed, paraffin-embedded lungs (original magnification, ×400; scale bars, 200 μm) from C57BL/6 mice. (L) A549 cells co-transfected with the plasmids of pAcGFP1-C-Nsp12-FLAG and pLVX-Nsp13-Strep. At 72 h after transfection, Nsp12/13 complex pull-down by Strep-Tactin XT magnetic beads and immunoblot analysis with anti-FLAG antibody are shown. Data are representative of three independent experiments (error bars, SD). ∗p < 0.05, ∗∗p < 0.01 (two-tailed t test).
Figure 2
Figure 2
GELN miRNA potentially targets to the RNA of the SARS-CoV-2 (A) Flow diagram depicting the steps taken in identifying unique GELN miRNAs potentially targeting the RNA of SARS-CoV-2. (B) Venn diagram of miRNAs detected in the ginger tissue and GELNs using miRNA sequencing. (C) Heatmap showing miRNAs from ginger tissue, GELNs, and human and mouse brain (n = 3 per group). (D) Waterfall plot showing the differences in the relative abundance of miRNAs between GELNs and ginger tissue normalized by human miRNAs. (E) Distribution of RNA biotype differences. Boxes represent median and interquartile ranges. (F) Schematic diagram and distribution of the putative binding sites of GELN miRNAs in the full-length SARS-CoV-2 genome. UTR, untranslated region. The miRNAs of humans and mice that have the same mapping seed sequences as GELNs are indicated in red and were excluded in further experiments. (G and H) Predicted consequential pairing of target region of spike gene (G, top), Nsp12 gene (H, top), GELN rlcv-miR-rL1-28-3p (G, bottom), and aly-miR396a-5p (H, bottom), respectively. The miRNA seed matches in the target RNAs are mutated at the positions as indicated. (I) A549 cells transfected with CoV-2 S inserted into pcDNA3-GFP and GELN rlcv-miR-rL1-28-3p, mutant RNA. Visualization with confocal fluorescence microscopy. (J) A549 cells transfected with Nsp12 inserted into pLVX-EF1alpha-2xStrep-IRES and GELN aly-miR396a-5p, mutant RNA. Visualization is with Strep-Tactin-HRP conjugate by immunoblot. Data are representative of three independent experiments (error bars, SD). ∗p < 0.05, ∗∗p < 0.01 (two-tailed t test).
Figure 3
Figure 3
aly-miR396a-5p reduces NF-κB activated by Nsp12/13 through phosphorylation of IKKβ (A) Western blot analysis showing the phosphorylation (p) of IKKβ, IκBα, and NF-κB (p65). JNK as well as total NF-κB (p65) are shown in macrophages of the lung in C57BL/6 mice (n = 5) inoculated by intratracheal administration with exosomes (5 × 108/kg, body weight) from LLC1 cells transfected with Nsp12 and/or Nsp13 as well as aly-miR396a-5p. Arrows mark the positions of p54 and p46 subunits of p-JNK. GAPDH served as a loading control. Numbers below western blots represent densitometry values normalized to the loading control. (B) Pretreatment with p-JNK inhibitor (SP600125, 5 mg/kg/day, body weight) and p-IκBα inhibitor (Bay 11-7821, 10 mg/kg/day, body weight) (n = 5) by intraperitoneal injection 3 days following intratracheal administration of exosomes. Western blot analysis shows p-IκBα, p-JNK, and p-p65 in lung macrophages. (C) Western blot analysis of cleaved (c-)caspase-3, c-caspase-7, and c-PARP in the lungs of mice. (D) Analysis of apoptosis by TUNEL staining in lung tissues. The TUNEL assay revealed apoptotic-positive cells in lung marked by GFP staining. The blue DAPI stain marks intact DNA. Original magnification, ×400 (left panel). (Right panel) Quantification of TUNEL-positive cells. The data were collected by counting positive cells from three lung sections of specimens and are shown as mean ± SD versus vehicle. ∗∗p < 0.01. NS, not significant. (E) Analysis of apoptosis by flow cytometry using annexin V-FITC staining in EpCAM+ cells of lungs from mice. (Top panel) Numbers in boxes indicate a representative percentage of EpCAM+ apoptotic cells. The adjunct histograms display the univariate plots that correspond to the EpCAM in the bivariate plot. (Bottom panel) Quantification of percentage of EpCAM+annexin V+7-aminoactinomycin D (7-AAD) cells. Data are representative of three independent experiments (error bars, SD). ∗p < 0.05, ∗∗p < 0.01 (two-tailed t test). (F) Analysis of apoptosis by flow cytometry in lung epithelial A549 cells presented to Nsp12/13 and Bay 11-7821 (top panel), or culture supernatant from U937 macrophages treated with A549-derived Nsp12/13 exosomes with or without Bay 11-7821 (middle panel), and anti-TNF-α, anti-IL-1β, and anti-IL-6 antibodies (10 ng/mL, bottom panel), respectively. Numbers in boxes indicate a representative percentage of annexin V+7-AAD apoptotic cells. (Right panel) Quantification of percentage of annexin V+7-AAD cells. Data are representative of three independent experiments (error bars, SD); versus Nsp12/13 group: ∗p < 0.05, ∗∗p < 0.01 (two-tailed t test). (G) Proposed model for the crosstalk between GELN miR396a-5p that regulates cytokine expression mediated by SARS-CoV-2 Nsp12 in a manner dependent on NF-κB signaling.
Figure 4
Figure 4
GELN aly-miR396a-5p suppresses the expression of cytokines mediated by Nsp12/13 synergy (A) GELN-derived nanovectors (GNVs, 10 mg) administered to C57BL/6 mice (n = 5) by intratracheal injection. Representative flow cytometry plots show GNVs stained with PKH26 in F4/80+ cells (left) and EpCAM+ cells (right) of lungs 12 h after intratracheal injection. (B) Western blot analysis expression of Nsp12-Strep and spike protein in lungs with Strep-Tactin-HRP conjugate and anti-S antibody 48 h after administration of viral plasmid CoV-2-Nsp12-2xStrep and pcDNA3-CoV-2-S, as well as GNVs packing aly-miR396a-5p and rlcv-miR-rL1-28 or appropriate mutant RNA, respectively, by intratracheal injection. GAPDH served as a loading control. Numbers below the western blots represent densitometry values normalized to the loading control. (C) ELISA analysis showing the levels of TNF-α, IL-1β, and IL-6 in human macrophage U937 cells transfected with Nsp12 and/or Nsp13 as well as aly-miR396a-5p. (D) ELISA analysis showing the level of TNF-α, IL-1β, and IL-6 in the lungs inoculated with Nsp12 and/or Nsp13 as well as aly-miR396a-5p through intratracheal administration. Nsp12/13 versus Nsp12 or Nsp13, ∗p < 0.05, ∗∗p < 0.01; Nsp12/13+miR396a-5p versus Nsp12/13, #p < 0.05, ##p < 0.01. (E) Analysis of cytokine levels in lungs from C57BL/6 mice with indicated treatment in the figures through intratracheal administration using a mouse cytokine array (n = 3). (F) Quantification of relative intensity of the selective upregulation and downregulation of cytokines shown in the cytokine array. (G) Cytokines in F4/80+ cells assessed by flow cytometry (top panel). (Bottom panel) Quantification of data from flow cytometry. (H) Cytokines in F4/80+ cells assessed by qPCR. (I) Representative H&E-stained sections of lungs (original magnification, ×400; scale bars, 200 μm). Data are representative of three independent experiments (error bars, SD). ∗p < 0.05, ∗∗p < 0.01 (two-tailed t test).
Figure 5
Figure 5
GELN miRNAs inhibit cytopathic effects (CPEs) of Vero E2 cells infected with SARS-CoV-2 (A) Schematic representation of the treatment schedule for the effect of GELN miRNAs on the CPEs of Vero E2 cells infected with SARS-CoV-2. (B) qPCR analysis of spike gene (top panel) and Nsp12 (bottom panel) expression in Vero E2 cells after a 72-h infection with SARS-CoV-2 at an MOI of 0.003. (C) Western blot analysis of spike protein in transfected Vero E2 cells. Numbers below the western blot represent densitometry values normalized to the loading control. (D) 2 × 104 Vero E2 cells in 96-well plates exposed to 60 PFU of SARS-CoV-2 and GELN miRNAs as well as control indicated in the graph. A representative CPE estimated at 72 h post-infection is shown. Scale bar, 100 μm (left panel). Semiquantitative analysis of CPE at four levels (<25%, 25%, 50%, >50%) from three independent experiments (right panel). (E) Proposed model of SARS-CoV-2 activation of cytokines in lung macrophages mediated by exosome cargo of viral protein from infected epithelial cells. GELN miRNA extinguishes the activation of cytokines in lung by directly targeting the viral gene of SARS-CoV-2. Data are representative of three independent experiments (error bars, SD). ∗p < 0.05, ∗∗p < 0.01 (two-tailed t test). NS, not significant.

References

    1. Mu J., Zhuang X., Wang Q., Jiang H., Deng Z.B., Wang B., Zhang L., Kakar S., Jun Y., Miller D., Zhang H.G. Interspecies communication between plant and mouse gut host cells through edible plant derived exosome-like nanoparticles. Mol. Nutr. Food Res. 2014;58:1561–1573. - PMC - PubMed
    1. Xiao J., Feng S., Wang X., Long K., Luo Y., Wang Y., Ma J., Tang Q., Jin L., Li X., Li M. Identification of exosome-like nanoparticle-derived microRNAs from 11 edible fruits and vegetables. PeerJ. 2018;6:e5186. - PMC - PubMed
    1. Sampey G.C., Saifuddin M., Schwab A., Barclay R., Punya S., Chung M.C., Hakami R.M., Zadeh M.A., Lepene B., Klase Z.A. Exosomes from HIV-1-infected cells stimulate production of pro-inflammatory cytokines through trans-activating response (TAR) RNA. J. Biol. Chem. 2016;291:1251–1266. - PMC - PubMed
    1. Miura T.A. Respiratory epithelial cells as master communicators during viral infections. Curr. Clin. Microbiol. Rep. 2019;6:10–17. - PMC - PubMed
    1. Mukhamedova N., Hoang A., Dragoljevic D., Dubrovsky L., Pushkarsky T., Low H., Ditiatkovski M., Fu Y., Ohkawa R., Meikle P.J. Exosomes containing HIV protein Nef reorganize lipid rafts potentiating inflammatory response in bystander cells. PLoS Pathog. 2019;15:e1007907. - PMC - PubMed

Publication types

MeSH terms