. 2021 Sep:77:194-201.
doi: 10.1016/j.clinimag.2021.04.033. Epub 2021 Apr 29.

Quantitative assessment of lung involvement on chest CT at admission: Impact on hypoxia and outcome in COVID-19 patients

Affiliations

Quantitative assessment of lung involvement on chest CT at admission: Impact on hypoxia and outcome in COVID-19 patients

Antonio Esposito et al. Clin Imaging. 2021 Sep.

Abstract

Background: The aim of this study was to quantify COVID-19 pneumonia features using CT performed at time of admission to emergency department in order to predict patients' hypoxia during the hospitalization and outcome.

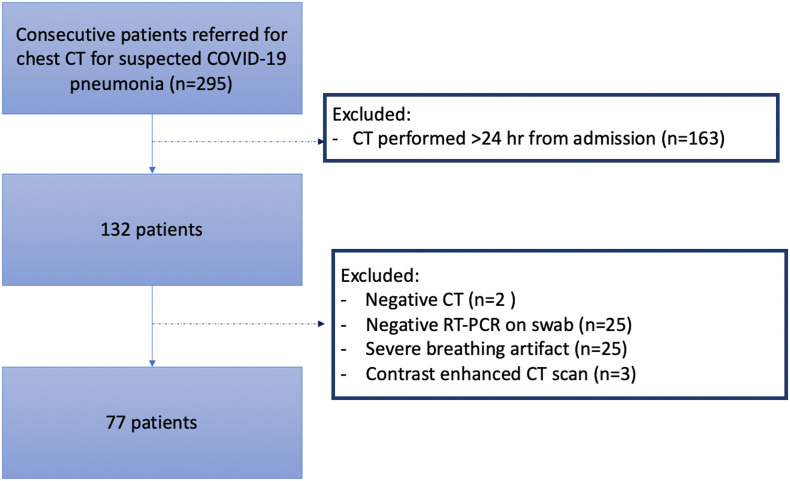
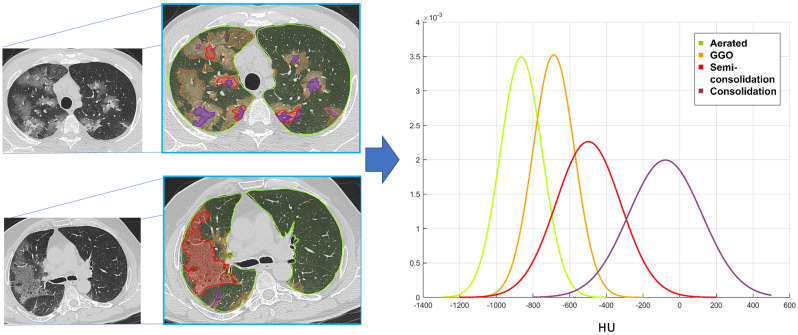
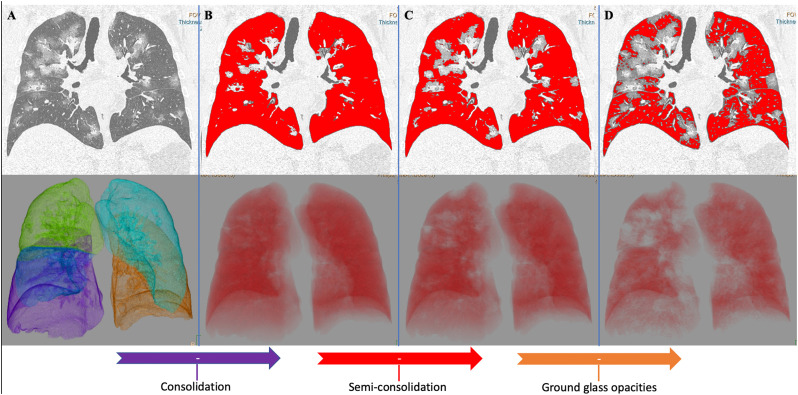
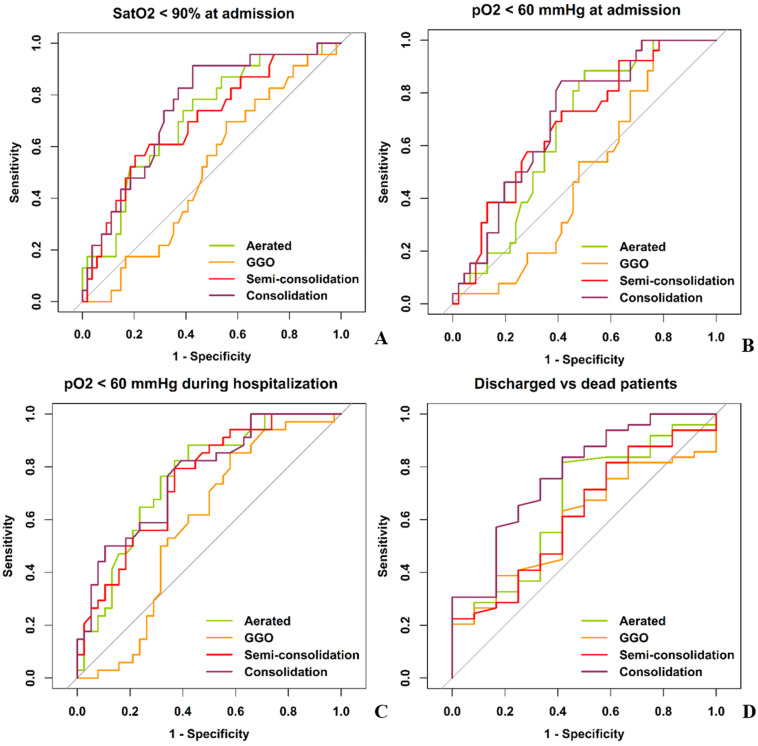
Methods: Consecutive chest CT performed in the emergency department between March 1st and April 7th 2020 for COVID-19 pneumonia were analyzed. The three features of pneumonia (GGO, semi-consolidation and consolidation) and the percentage of well-aerated lung were quantified using a HU threshold based software. ROC curves identified the optimal cut-off values of CT parameters to predict hypoxia worsening and hospital discharge. Multiple Cox proportional hazards regression was used to analyze the capability of CT quantitative features, demographic and clinical variables to predict the time to hospital discharge.

Results: Seventy-seven patients (median age 56-years-old, 51 men) with COVID-19 pneumonia at CT were enrolled. The quantitative features of COVID-19 pneumonia were not associated to age, sex and time-from-symptoms onset, whereas higher number of comorbidities was correlated to lower well-aerated parenchyma ratio (rho = -0.234, p = 0.04) and increased semi-consolidation ratio (rho = -0.303, p = 0.008). Well-aerated lung (≤57%), semi-consolidation (≥17%) and consolidation (≥9%) predicted worst hypoxemia during hospitalization, with moderate areas under curves (AUC 0.76, 0.75, 0.77, respectively). Multiple Cox regression identified younger age (p < 0.01), female sex (p < 0.001), longer time-from-symptoms onset (p = 0.049), semi-consolidation ≤17% (p < 0.01) and consolidation ≤13% (p = 0.03) as independent predictors of shorter time to hospital discharge.

Conclusion: Quantification of pneumonia features on admitting chest CT predicted hypoxia worsening during hospitalization and time to hospital discharge in COVID-19 patients.

Keywords: Artificial intelligence; Covid-19; Outcome; Pneumonia; Quantitative CT.


Figures

Fig. 1
Fig. 1
Flowchart of patient selection. Abbreviations: CT = computed tomography; RT-PCR = real time polymerase chain reaction.
Fig. 2
Fig. 2
HU density values extraction. An experienced radiologist segmented the well-aerated parenchyma (lime), ground glass opacities (orange), semi-consolidation (red) and consolidation (plum) on chest CT scan of a subset of 35 randomly selected patients with COVID-19 pneumonia. Two examples of manual segmentation are reported on the left. HU values of each pneumonia lesion features and well-aerated parenchyma were extracted using a pixel-by-pixel approach and Gaussian curves of HU values distribution were created (on the right). Intersection points of Gaussian curves identified the following HU threshold values: - 780 HU as threshold between well-aerated parenchyma and GGO; −570 HU as threshold between GGO and semi-consolidation; −290 as threshold between semi-consolidation and consolidation. (For interpretation of the references to color in this figure legend, the reader is referred to the web version of this article.)
Fig. 3
Fig. 3
Automatic segmentation of both lungs with quantitative extraction of well-aerated parenchyma, ground glass opacities, semi-consolidation and consolidation. This figure reports the coronal images (on top) and the corresponding 3D volume rendering (bottom), obtained during post-processing performed using a dedicated software (IntelliSpace Portal v.8.0, Philips Medical Systems, Eindhoven, The Netherlands). The software performs a fully automatic segmentation of both lungs from native CT dataset (A). After visual check and manual correction of any segmentation error, the HU thresholds calculated as in Fig. 2 were applied in a multistep fashion analysis. In the first step (B) consolidation pattern was extracted from total lung volume applying the threshold -290HU. In the second step (C) consolidation plus semi-consolidation were extracted from total lung volume applying the threshold -570HU. In the final step (D) consolidation, semi-consolidation and ground glass opacities were extracted from total lung volume applying the threshold -780HU and the red volume (D) represent the well-aerated parenchyma. Hence, consolidation volume was obtained subtracting red volume in B from total lung volume (A); semi-consolidation volume was obtained subtracting red volume in C from red volume in B; ground glass volume was obtained subtracting red volume in D from red volume in C. (For interpretation of the references to color in this figure legend, the reader is referred to the web version of this article.)
Fig. 4
Fig. 4
ROC curves of CT quantitative features of lung involvement in patients' suffering from COVID-19 pneumonia in predicting oxygen saturation (A), hypoxemia at hospital arrival (B) and during hospitalization (C) and patients ‘outcome (D). GGO had the worst AUCs, and was found as predictor neither of oxygen saturation (AUC 0.51), hypoxemia at time of admission (AUC 0.51) and during the hospitalization (AUC 0.59) nor of patients’ outcome (AUC 0.59).

References

    1. Matthay M.A., Aldrich J.M., Gotts J.E. Treatment for severe acute respiratory distress syndrome from COVID-19. Lancet Respir Med. 2020 May 1;8(5):433–434. - PMC - PubMed
    1. Ai T., Yang Z., Hou H., et al. Correlation of chest CT and RT-PCR testing in coronavirus disease 2019 (COVID-19) in China: a report of 1014 cases. Radiology. 2020 Feb;26:200642. - PMC - PubMed
    1. Palmisano A., Scotti G.M., Ippolito D., et al. Chest CT in the emergency department for suspected COVID-19 pneumonia. Radiol Med (Torino) 2020 Nov;9:1–5. - PMC - PubMed
    1. Simpson S., Kay F.U., Abbara S., et al. Radiological society of North America expert consensus document on reporting chest CT findings related to COVID-19: endorsed by the society of thoracic radiology, the American college of radiology, and RSNA. Radiol Cardiothoracic Imag. 2020 Mar 25;2(2) - PMC - PubMed
    1. Remy-Jardin M., Giraud F., Remy J., Copin M.C., Gosselin B., Duhamel A. Importance of ground-glass attenuation in chronic diffuse infiltrative lung disease: pathologic-CT correlation. Radiology. 1993 Dec;189(3):693–698. - PubMed