

Policy and weather influences on mobility during the early US COVID-19 pandemic
- PMID: 33986146
- PMCID: PMC8179212
- DOI: 10.1073/pnas.2018185118
Policy and weather influences on mobility during the early US COVID-19 pandemic
Abstract
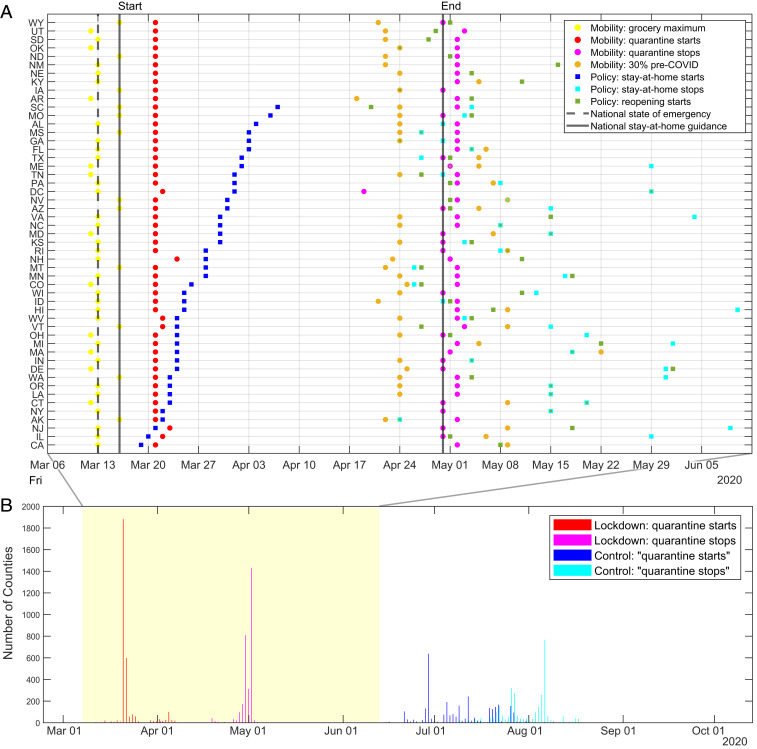
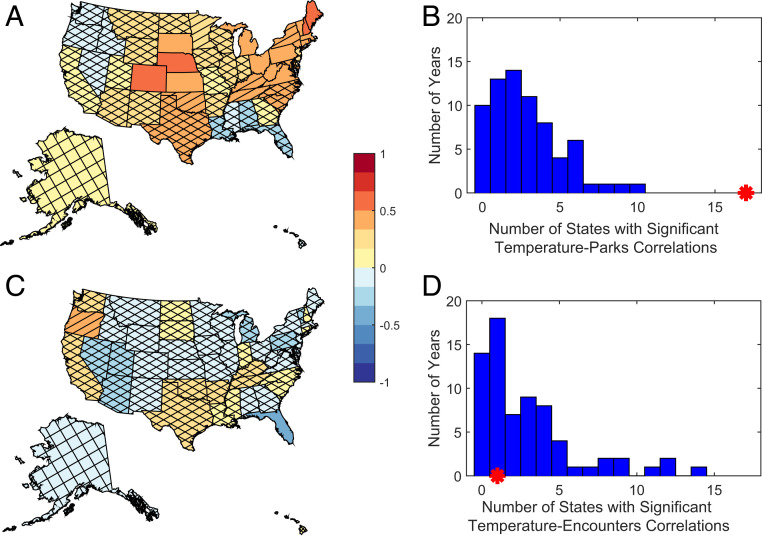
As the novel coronavirus severe acute respiratory syndrome coronavirus 2 (SARS-CoV-2) continues to proliferate across the globe, it is a struggle to predict and prevent its spread. The successes of mobility interventions demonstrate how policies can help limit the person-to-person interactions that are essential to infection. With significant community spread, experts predict this virus will continue to be a threat until safe and effective vaccines have been developed and widely deployed. We aim to understand mobility changes during the first major quarantine period in the United States, measured via mobile device tracking, by assessing how people changed their behavior in response to policies and to weather. Here, we show that consistent national messaging was associated with consistent national behavioral change, regardless of local policy. Furthermore, although human behavior did vary with outdoor air temperature, these variations were not associated with variations in a proxy for the rate of encounters between people. The independence of encounters and temperatures suggests that weather-related behavioral changes will, in many cases, be of limited relevance for SARS-CoV-2 transmission dynamics. Both of these results are encouraging for the potential of clear national messaging to help contain any future pandemics, and possibly to help contain COVID-19.
Keywords: COVID-19; United States; mobility; policy; weather.
Conflict of interest statement
The authors declare no competing interest.
Figures
Similar articles
-
Dynamic Panel Data Modeling and Surveillance of COVID-19 in Metropolitan Areas in the United States: Longitudinal Trend Analysis.J Med Internet Res. 2021 Feb 9;23(2):e26081. doi: 10.2196/26081. J Med Internet Res. 2021. PMID: 33481757 Free PMC article.
-
Weathering COVID-19 storm: Successful control measures of five Asian countries.Am J Infect Control. 2020 Jul;48(7):851-852. doi: 10.1016/j.ajic.2020.04.021. Epub 2020 Apr 29. Am J Infect Control. 2020. PMID: 32360746 Free PMC article.
-
Zero tolerance for complacency by government of West African countries in the face of COVID-19.Hum Antibodies. 2021;29(1):27-40. doi: 10.3233/HAB-200413. Hum Antibodies. 2021. PMID: 32417768 Free PMC article. Review.
-
Impact of COVID-19 outbreaks and interventions on influenza in China and the United States.Nat Commun. 2021 May 31;12(1):3249. doi: 10.1038/s41467-021-23440-1. Nat Commun. 2021. PMID: 34059675 Free PMC article.
-
COVID-19 pandemic: A review of the global lockdown and its far-reaching effects.Sci Prog. 2021 Apr-Jun;104(2):368504211019854. doi: 10.1177/00368504211019854. Sci Prog. 2021. PMID: 34061685 Free PMC article. Review.
Cited by
-
Outdoor recreation, tick borne encephalitis incidence and seasonality in Finland, Norway and Sweden during the COVID-19 pandemic (2020/2021).Infect Ecol Epidemiol. 2023 Nov 18;13(1):2281055. doi: 10.1080/20008686.2023.2281055. eCollection 2023. Infect Ecol Epidemiol. 2023. PMID: 38187169 Free PMC article.
-
Data analysis evidence beyond correlation of a possible causal impact of weather on the COVID-19 spread, mediated by human mobility.Sci Rep. 2024 Aug 1;14(1):17782. doi: 10.1038/s41598-024-67918-6. Sci Rep. 2024. PMID: 39090143 Free PMC article.
-
A vision for incorporating human mobility in the study of human-wildlife interactions.Nat Ecol Evol. 2023 Sep;7(9):1362-1372. doi: 10.1038/s41559-023-02125-6. Epub 2023 Aug 7. Nat Ecol Evol. 2023. PMID: 37550509 Review.
-
Novel mobility index tracks COVID-19 transmission following stay-at-home orders.Sci Rep. 2022 May 10;12(1):7654. doi: 10.1038/s41598-022-10941-2. Sci Rep. 2022. PMID: 35538129 Free PMC article.
-
Environmental Factors Influencing COVID-19 Incidence and Severity.Annu Rev Public Health. 2022 Apr 5;43:271-291. doi: 10.1146/annurev-publhealth-052120-101420. Epub 2022 Jan 4. Annu Rev Public Health. 2022. PMID: 34982587 Free PMC article. Review.
References
-
- BBC News , Trump’s virus travel ban on Europe comes into force. BBC News, 14 March 2020. https://web.archive.org/web/20200728173100/https://www.bbc.com/news/worl.... Accessed 29 July 2020.
-
- The White House , 30 days to slow the spread. coronavirus.gov (2020). https://web.archive.org/web/20200729112720/https://www.whitehouse.gov/wp.... Accessed 29 July 2020.
-
- Education Week , Map: Coronavirus and school closures. Education Week (2020). https://web.archive.org/web/20200729003506/https://www.edweek.org/ew/sec.... Accessed 19 July 2020.
-
- Rothgerber H., et al. ., Politicizing the COVID-19 pandemic: Ideological differences in adherence to social distancing. PsyArXiv [Preprint] (2020). 10.31234/osf.io/k23cv (Accessed 29 July 2020). - DOI
MeSH terms
LinkOut - more resources
Full Text Sources
Other Literature Sources
Medical
Research Materials
Miscellaneous
