. 2021 May 14;372(6543):eaba4220.
doi: 10.1126/science.aba4220.

SLFN2 protection of tRNAs from stress-induced cleavage is essential for T cell-mediated immunity

Affiliations

SLFN2 protection of tRNAs from stress-induced cleavage is essential for T cell-mediated immunity

Tao Yue et al. Science. .

Abstract

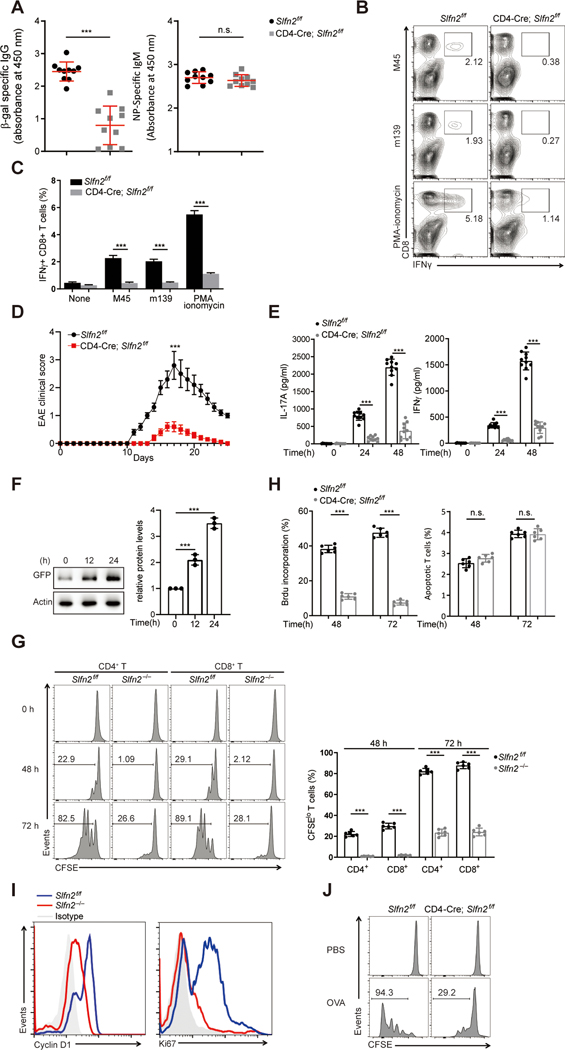
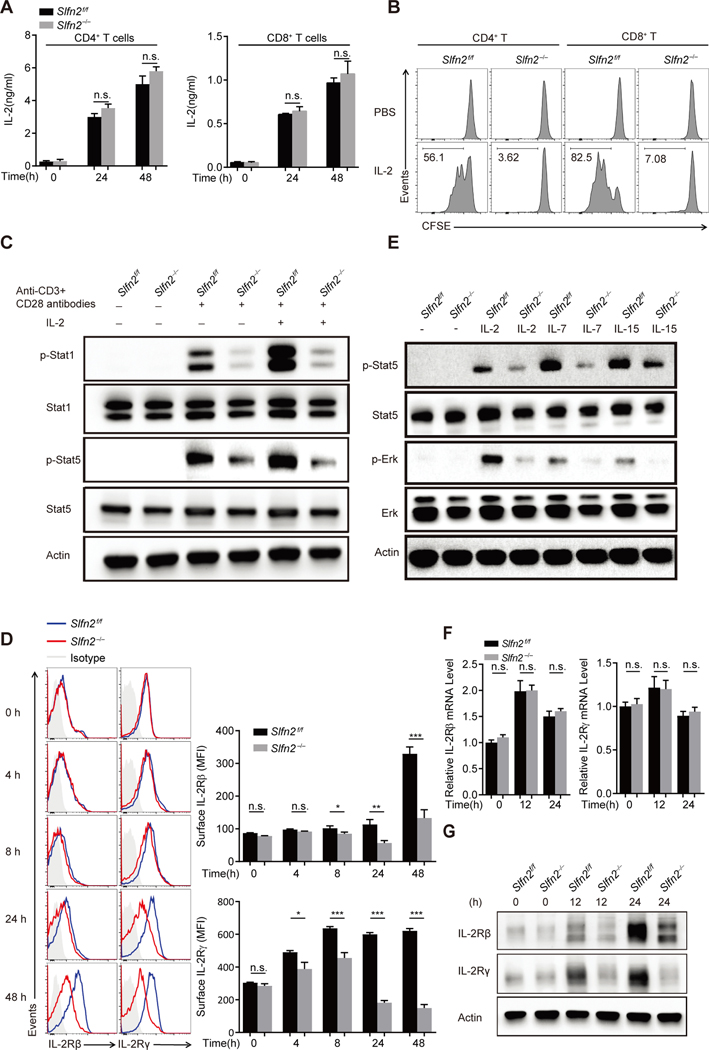
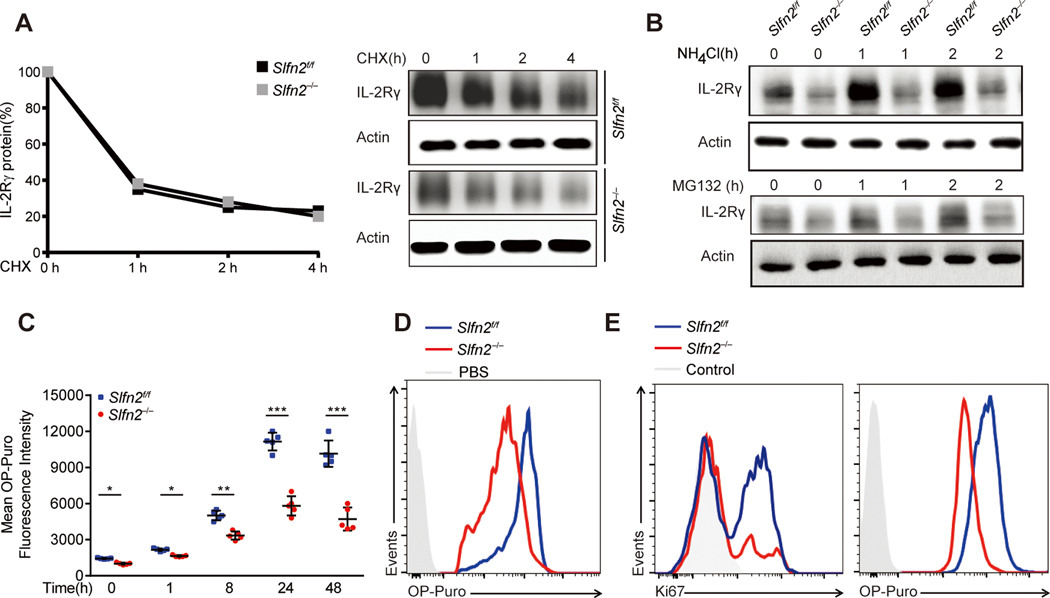
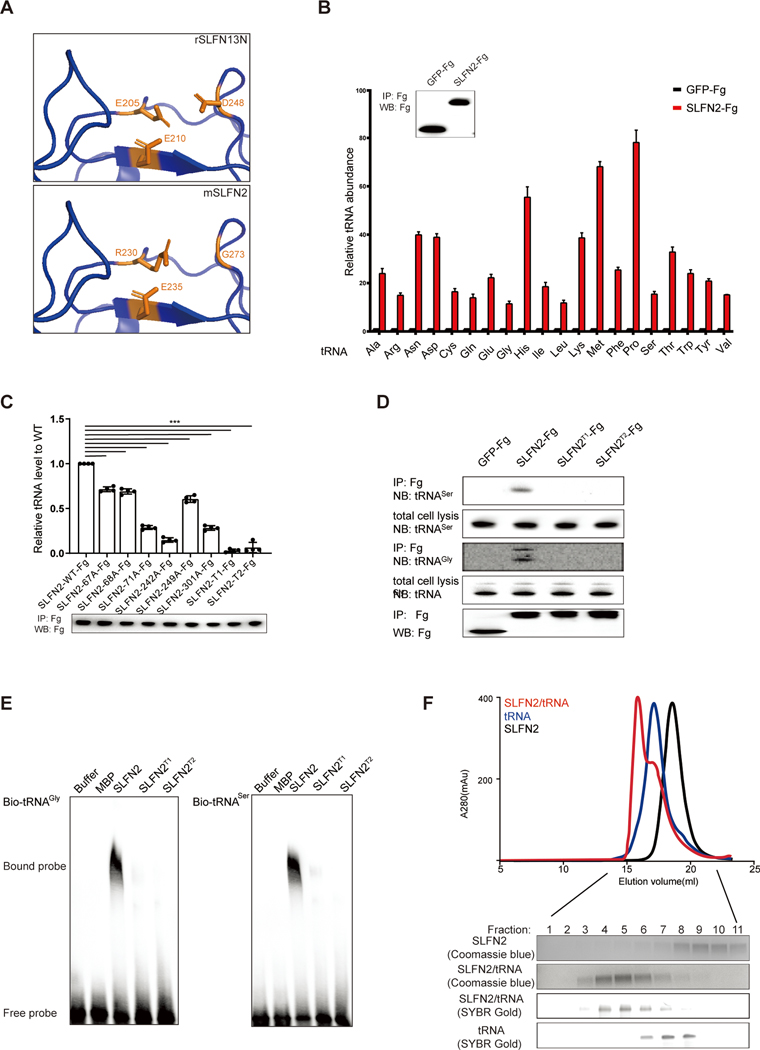
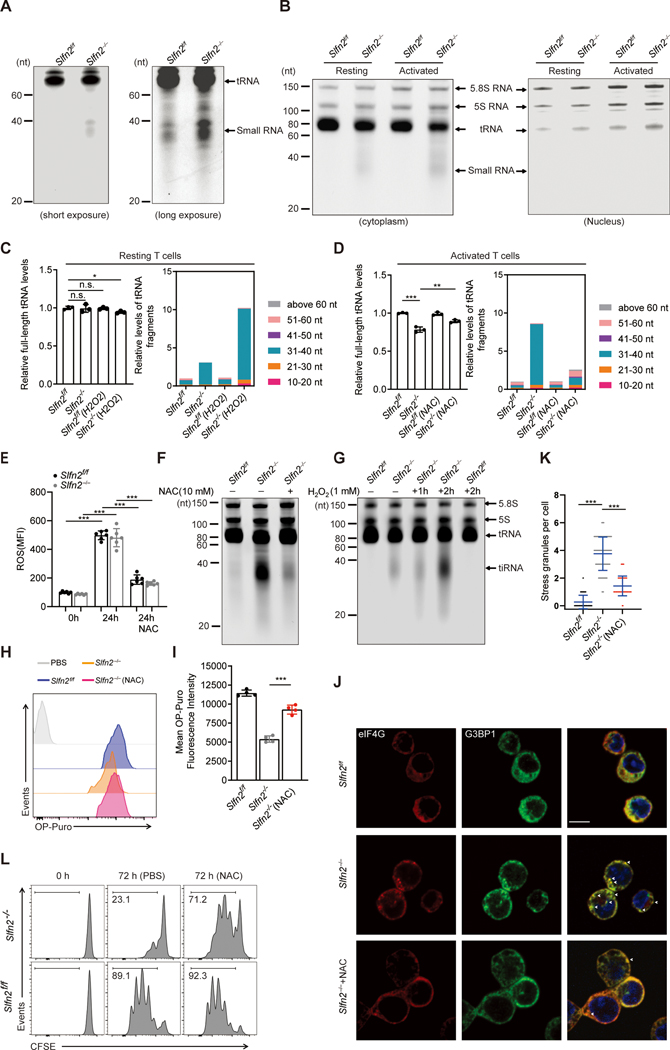
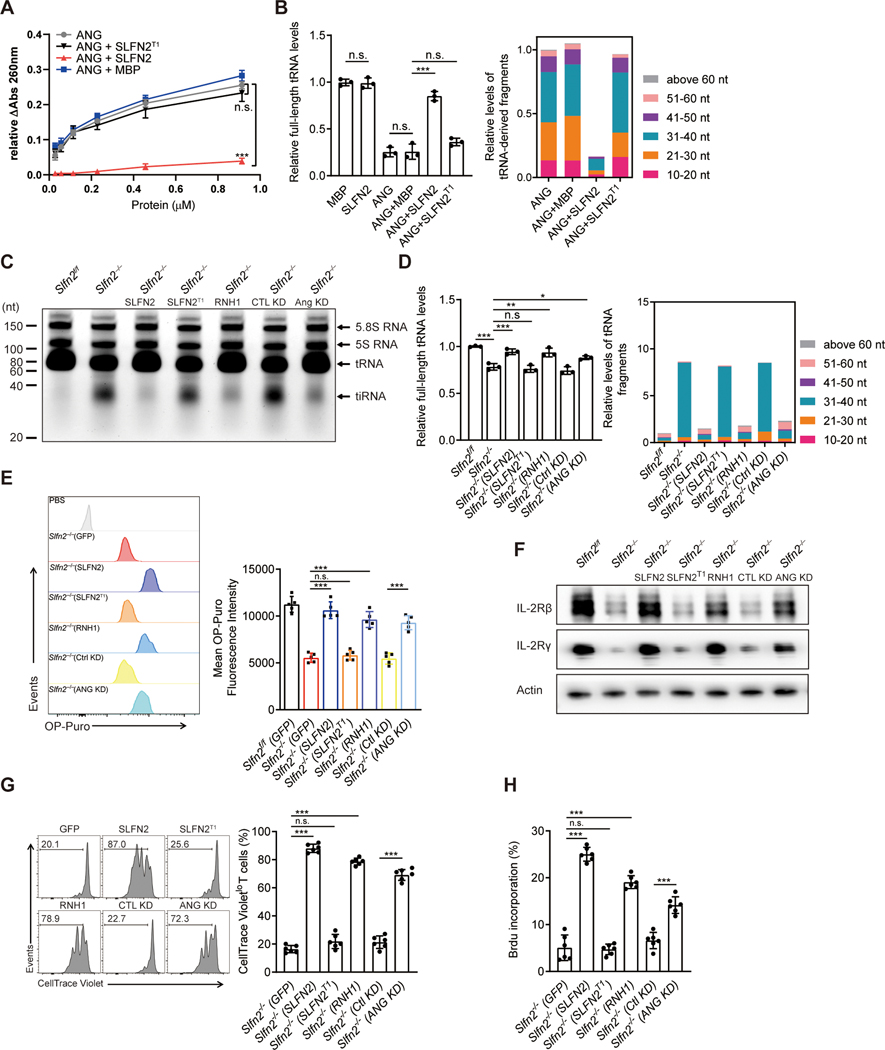
Reactive oxygen species (ROS) increase in activated T cells because of metabolic activity induced to support T cell proliferation and differentiation. We show that these ROS trigger an oxidative stress response that leads to translation repression. This response is countered by Schlafen 2 (SLFN2), which directly binds transfer RNAs (tRNAs) to protect them from cleavage by the ribonuclease angiogenin. T cell-specific SLFN2 deficiency results in the accumulation of tRNA fragments, which inhibit translation and promote stress-granule formation. Interleukin-2 receptor β (IL-2Rβ) and IL-2Rγ fail to be translationally up-regulated after T cell receptor stimulation, rendering SLFN2-deficient T cells insensitive to interleukin-2's mitogenic effects. SLFN2 confers resistance against the ROS-mediated translation-inhibitory effects of oxidative stress normally induced by T cell activation, permitting the robust protein synthesis necessary for T cell expansion and immunity.


Figures

Fig. 1.
Fig. 1.. Impaired T cell-mediated immunity in T cell-specific SLFN2-deficient mice.
(A) Serum β-gal-specific IgG on day 14 after immunization (left) and NP-specific IgM on day 7 after immunization (right) of Slfn2f/f and CD4-Cre; Slfn2f/f mice (n=10 per genotype) with rSFV-encoded β-gal and NP-Ficoll, respectively. Each symbol represents an individual mouse. (B) Representative flow cytometry analysis of IFN-γ+ CD8+ T cells isolated from the spleens of Slfn2f/f and CD4-Cre; Slfn2f/f mice on day 10 after MCMV infection and then stimulated in vitro with MCMV peptides m139 or M45 or PMA–ionomycin. Numbers indicate percent cells in boxed area. (C) Quantification of the percentage of IFN-γ+ CD8+ T cells among 1×10⁶ spleen cells assessed by flow cytometry as in B (n=4 per genotype). (D) Mean EAE clinical scores of age-matched Slfn2f/f and CD4-Cre; Slfn2f/f mice (n=10 per genotype) on the indicated days after immunization with MOG35–55. (E) IL-17 (left) or IFN-γ (right) concentration in the culture medium of spleen cells harvested from Slfn2f/f and CD4-Cre; Slfn2f/f mice (n=10 per genotype) on day 10 after MOG35–55 immunization and stimulated with MOG35–55 in vitro for the indicated time. (F) Immunoblot analysis of GFP-SLFN2 expression in splenic T cells isolated from BAC transgenic mice expressing GFP-tagged SLFN2 and stimulated with anti-CD3/CD28 for the indicated time (left). Quantification of the average intensity of the GFP-SLFN2 protein bands normalized to time 0 hour from three independent experiments (right). (G) Representative flow cytometry analysis of CFSE intensity in splenic Slfn2f/f or Slfn2−/− (from CD4-Cre; Slfn2f/f mice) CD4+ and CD8+ T cells left unstimulated or stimulated with anti-CD3/CD28 for 48 hours and 72 hours (left). Numbers indicate percent dye-positive cells in bracketed region. Frequency of CFSElo cells among dye-positive CD4+ and CD8+ T cells stimulated with anti-CD3/CD28 antibodies for 48 hours and 72 hours (n=6 per genotype) (right). (H) Percentage of Slfn2f/f and Slfn2−/− splenic T cells that incorporated BrdU or expressed annexin V (apoptotic cells) 48 hours and 72 hours after anti-CD3/CD28 stimulation, assessed by flow cytometry (n=6 per genotype). (I) Representative flow cytometry analysis of intracellular cyclin D1 and Ki67 expression in splenic T cells isolated from Slfn2f/f and CD4-Cre; Slfn2f/f mice (n=6 per genotype) and stimulated with anti-CD3/CD28 for 48 hours. Isotype, Slfn2f/f T cells stained with isotype-matched control antibody. (J) CFSE-labeled OT-1 T cells from Slfn2f/f and CD4-Cre; Slfn2f/f mice (n=3 per genotype) were adoptively transferred into Rag1−/− recipients. Representative flow cytometry analysis of CFSE intensity in OT-1 T cells isolated from the spleens of Rag1−/− recipients 72 hours after OVA immunization (n=3 per genotype). Numbers indicate percent dye-positive cells in bracketed region. P-values were determined by Student’s t test and error bars indicate SD except that mean clinical EAE scores were analyzed by the Mann–Whitney U test (n.s., not significant, *P<0.5, **P <0.01, ***P <0.001). Data are representative of two (I) or three (A to H, J) independent experiments.
Fig. 2.
Fig. 2.. Abrogation of responses to IL-2 is due to diminished IL-2 receptor expression in SLFN2-deficient T cells.
(A) IL-2 concentration in the culture medium of Slfn2f/f or Slfn2−/− (from CD4-Cre; Slfn2f/f mice) CD4+ and CD8+ T cells left unstimulated or stimulated with anti-CD3/CD28 for 24 hours and 48 hours (n=4 per genotype). (B) Representative flow cytometry analysis of CFSE intensity in Slfn2f/f or Slfn2−/− splenic CD4+ and CD8+ T cells that were pre-activated with anti-CD3/CD28 for 24 hours, then labeled with CFSE, and treated with IL-2 for 48 hours in the absence of anti-CD3/CD28 antibody (n=3 per genotype). (C) Immunoblot analysis of total and phosphorylated Stat1 and Stat5 in Slfn2f/f or Slfn2−/− splenic T cells pre-activated with anti-CD3/CD28 for 24 hours followed by IL-2 stimulation for 30 min with cells pooled from 4–8 mice per genotype. (D) Representative flow cytometry analysis (left) and mean fluorescence intensity (right) of surface expression levels of IL-2Rβ and IL-2Rγ on Slfn2f/f or Slfn2−/− splenic T cells stimulated with anti-CD3/CD28 for the indicated time (n=4 per genotype). Isotype, Slfn2f/f T cells stained with isotype-matched control antibody. (E) Immunoblot analysis of total and phosphorylated Stat5 and Erk in Slfn2f/f or Slfn2−/− splenic T cells pre-activated with anti-CD3/CD28 for 24 hours followed by IL-2, IL-7, or IL-15 stimulation for 30 min, and cells were pooled from 4–8 mice per genotype. (F) qRT-PCR analysis of IL-2Rβ and IL-2Rγ transcripts in total mRNA isolated from Slfn2f/f or Slfn2−/− splenic T cells stimulated with anti-CD3/CD28 for the indicated time (n= 4 per genotype). Data were normalized to β-actin mRNA expression. (G) Immunoblot analysis of IL-2Rβ and IL-2Rγ in Slfn2f/f or Slfn2−/− splenic T cells stimulated with anti-CD3/CD28 for the indicated time with cells pooled from 4–8 mice per genotype. P-values were determined by Student’s t test (n.s., not significant, *P<0.5, **P<0.01, ***P<0.001). Data are representative of two (D) or three (A to C, E to G) independent experiments, and error bars indicate SD.
Fig. 3.
Fig. 3.. Attenuated translational burst in activated SLFN2-deficient T cells.
(A) Immunoblot analysis of IL-2Rγ in Slfn2f/f or Slfn2−/− (from CD4-Cre; Slfn2f/f mice) splenic T cells stimulated with anti-CD3/CD28 for 24 hours and then treated with cycloheximide for the indicated time with cells pooled from 4–8 mice per genotype (right). Quantification of the intensity of the IL-2Rγ protein bands normalized to time 0 hour (left). (B) Immunoblot analysis of IL-2Rγ in Slfn2f/f or Slfn2−/− splenic T cells stimulated with anti-CD3/CD28 for 24 hours and then treated with NH4Cl (10 mM) or MG132 (10 μM) for the indicated time, and cells were pooled from 4–8 mice per genotype. (C) OP-puro mean fluorescence intensity in Slfn2f/f or Slfn2−/− splenic T cells (n=5 per genotype) stimulated with anti-CD3/CD28 for the indicated time and then labeled with OP-puro for 30 min. Each symbol represents an individual mouse. (D) Representative flow cytometry analysis of OP-puro fluorescence in Slfn2f/f or Slfn2−/− splenic T cells stimulated with anti-CD3/CD28 for 24 hours, followed by OP-puro or PBS incubation (with Slfn2f/f cells as a control) for 30 min. (E) Representative flow cytometry analysis of intracellular Ki67 levels (left) and OP-puro fluorescence (right) in OT-1 cells from Slfn2f/f or CD4-Cre; Slfn2f/f mice 48 hours after i.m. OVA immunization followed by a 1-hour OP-puro treatment in vivo (n=3 per genotype). Control, antibody isotype (left) or PBS treatment (right) of Slfn2f/f cells. P-values were determined by Student’s t test (*P<0.5, **P<0.01, ***P<0.001). Data are representative of two (B to E) or three (A) independent experiments, and error bars indicate SD.
Fig. 4.
Fig. 4.. SLFN2 is not an RNase but directly binds to tRNAs.
(A) Comparison of the putative catalytic site of SLFN2 to the catalytic site of rSLFN13N in a homology model generated using SWISS-MODEL. Catalytic residues identified in rSLFN13 and the corresponding residues in SLFN2 are shown in orange. (B) qRT-PCR analysis of 20 tRNAs that were immunoprecipitated with FLAG antibody from lysates of EL4 cells stably expressing either GFP-Fg or SLFN2-Fg. Data were normalized to β-actin mRNA expression. Inset shows immunoblot analysis of immunoprecipitated GFP-Fg and SLFN2-Fg (n=4 independent cultures per construct). (C) qRT-PCR analysis of tRNAGly that was immunoprecipitated with FLAG antibody from lysates of Neuro-2a cells transfected with Slfn2-WT-Fg or Fg-tagged SLFN2 variants (n=4 independent cultures per construct). Data are expressed relative to GFP-Fg and normalized to Slfn2-WT-Fg, which was set to a value of 1. Immunoprecipitated SLFN2-Fg and Fg-tagged SLFN2 variants were detected by immunoblot (below). (D) RNA blot analysis of tRNAGly and tRNASer immunoprecipitated with FLAG antibody from lysates of Neuro-2a cells transfected with Slfn2-WT-Fg or FG-tagged SLFN2 variants. IP, immunoprecipitation. NB, Northern (RNA) blot. (E) EMSA analysis of in vitro transcribed, biotin-labeled tRNAGly and tRNASer after incubation with recombinant wild-type SLFN2 or SLFN2 variants purified from 293F cells. (F) Gel filtration chromatography analysis of in vitro complex formation between recombinant SLFN2 purified from 293F cells and in vitro transcribed tRNAGly. The indicated fractions were run on either SDS-PAGE gel or 15% denaturing urea PAGE gel for analysis of SLFN2 and tRNAGly in each fraction by Coomassie blue staining or SYBR Gold staining. Data are representative of two (B and C) or three (D to F) independent experiments, and error bars indicate SD.
Fig. 5.
Fig. 5.. Antioxidant inhibition of ROS prevents accumulation of tRNA fragments, suppression of translation, and stress granule assembly, permitting activation-induced proliferation of SLFN2-deficient T cells.
(A) Total RNA extracted from unstimulated Slfn2f/f or Slfn2−/− (from CD4-Cre; Slfn2f/f mice) splenic T cells, separated by 15% denaturing urea PAGE, and visualized by SYBR Gold staining. Positions of tRNA and 30–40-nt small RNA fragments are indicated. (B) Slfn2f/f or Slfn2−/− T cells were left unstimulated or stimulated with anti-CD3/CD28 antibodies for 24 hours. Cell lysates were fractionated into nuclear and cytoplasmic fractions before total RNA was isolated from each fraction, separated by 15% denaturing urea PAGE, and visualized by SYBR Gold staining. Positions of 5.8S RNA, 5S RNA, tRNA, and 30–40-nt RNA fragments are indicated. See also fig. S4 for longer exposure. (C and D) RNA-seq analysis of relative levels of full-length tRNAs (left) and relative levels of tRNA-derived fragments with indicated size ranges (right) from (C) resting Slfn2f/f or Slfn2−/− T cells left untreated or treated with 1 mM H2O2 for 2 hours or (D) Slfn2f/f or Slfn2−/− T cells stimulated with anti-CD3/CD28 for 24 hours in the presence or absence of 10 mM NAC (n=3 mice per genotype and treatment). (E) ROS levels in Slfn2f/f or Slfn2−/− splenic T cells (n=6 mice per genotype) as assessed by staining with DCF-DA. T cells were stimulated for 24 hours with anti-CD3/CD28 in the presence or absence of NAC prior to DCF-DA staining. (F) Total RNA from Slfn2f/f or Slfn2−/− splenic T cells stimulated with anti-CD3/CD28 for 24 hours in the presence or absence of NAC was separated by 15% denaturing urea PAGE and visualized by SYBR Gold staining. (G) Total RNA from unstimulated Slfn2f/f or Slfn2−/−splenic T cells treated with 1 mM H2O2 for indicated time was separated by 15% denaturing urea PAGE and visualized by SYBR Gold staining. Positions of 5.8S RNA, 5S RNA, tRNA, and 30–40-nt RNA fragments are indicated. (H) Representative flow cytometry analysis of OP-puro fluorescence in Slfn2f/f or Slfn2−/− splenic T cells stimulated with anti-CD3/CD28 in the presence or absence of NAC for 24 hours and then labeled with OP-puro for 30 min. PBS was used as a negative control. (I) OP-puro mean fluorescence intensity in Slfn2f/f or Slfn2−/− splenic T cells (n=4 mice per genotype), stimulated with anti-CD3/CD28 in the presence or absence of NAC for 24 hours and then labeled with OP-puro for 30 min. (J) Confocal immunofluorescence microscopy images of G3BP1 (green) and eIF4G (red) in Slfn2f/f or Slfn2−/− splenic T cells stimulated with anti-CD3/CD28 in the presence or absence of NAC for 24 hours. Cell nuclei were stained with SYTOX Deep Red (blue). Scale bar: 10 μm. (K) Quantification of stress granules (G3BP1+eIF4G+) in Slfn2f/f or Slfn2−/− splenic T cells stimulated as in J (n=100 cells per genotype). (L) Representative flow cytometry analysis of CFSE intensity in Slfn2f/f or Slfn2−/− splenic T cells stimulated with anti-CD3/CD28 in the presence or absence of NAC for 72 hours. Numbers indicate percent dye-positive cells in bracketed region. P-values were determined by Student’s t test (n.s., not significant, *P<0.5, **P<0.01, ***P<0.001). Data are representative of three independent experiments (A and B, E to L), and error bars indicate SD.
Fig. 6.
Fig. 6.. SLFN2 protects tRNAs from ANG-mediated cleavage in T cells.
(A) tRNA cleavage activity of mouse ANG towards 2 μM yeast total tRNA in the presence of 2 μM recombinant MBP (negative control), SLFN2, or SLFN2 T1, as measured by the release of perchloric acid-soluble fragments detected by absorbance at 260 nm. (B) RNA-seq analysis of relative levels of full-length tRNAs (left) and relative levels of tRNA-derived fragments with indicated size ranges (right). Total tRNA and tRNA-derived fragments were isolated from in vitro yeast tRNA cleavage assays performed with 1 μM mouse ANG and 2 μM indicated other proteins (n=3 assays per condition). (C) Total RNA extracted from activated Slfn2f/f or Slfn2−/− splenic T cells expressing the indicated proteins or shRNAs for 72 hours, separated by 15% denaturing urea PAGE, and visualized by SYBR Gold staining. Positions of tRNA and 30–40-nt tiRNA are indicated. (D) RNA-seq analysis of relative levels of full-length tRNAs (left) and relative levels of tRNA-derived fragments with indicated size ranges (right) isolated from activated Slfn2f/f or Slfn2−/− splenic T cells expressing the indicated proteins or shRNAs (n=3 per genotype) for 72 hours. (E) Representative flow cytometry analysis of OP-puro fluorescence in activated Slfn2−/− splenic T cells expressing the indicated proteins or shRNAs for 48 hours, followed by OP-Puro or PBS incubation (with “Slfn2−/−(SLFN2)” as a control) for 30 min (left). Quantified OP-puro mean fluorescence intensity is shown (n=5 per genotype) (right). (F) Immunoblot analysis of IL-2Rβ and IL-2Rγ in activated Slfn2f/f or Slfn2−/− splenic T cells expressing the indicated proteins or shRNAs for 48 hours. (G) Representative flow cytometry analysis of CellTrace Violet intensity in activated Slfn2−/− splenic T cells expressing the indicated proteins or shRNAs (left) for 72 hours. Numbers indicate percent dye-positive cells in bracketed region. Frequency of CellTrace Violetlo cells among dye-positive T cells (n=6 per genotype) (right). (H) Percentage of BrdU positive, activated Slfn2−/− splenic T cells expressing the indicated proteins or shRNAs for 48 hours, assessed by flow cytometry (n=6 per genotype). P-values were determined by Student’s t test (n.s., not significant, *P<0.5, **P<0.01, ***P<0.001). Data are representative of two (A and E) or three (C, F to H) independent experiments, and error bars indicate SD.

Comment in

  • De-stressing the T cells in need.
    Su Z, Dutta A. Su Z, et al. Science. 2021 May 14;372(6543):683-684. doi: 10.1126/science.abi7265. Science. 2021. PMID: 33986167 No abstract available.

References

    1. Chang CH et al., Posttranscriptional control of T cell effector function by aerobic glycolysis. Cell 153, 1239–1251 (2013). - PMC - PubMed
    1. Wang R. et al., The transcription factor Myc controls metabolic reprogramming upon T lymphocyte activation. Immunity 35, 871–882 (2011). - PMC - PubMed
    1. Ricciardi S. et al., The Translational Machinery of Human CD4(+) T Cells Is Poised for Activation and Controls the Switch from Quiescence to Metabolic Remodeling. Cell Metab 28, 895–906 e895 (2018). - PMC - PubMed
    1. Araki K. et al., Translation is actively regulated during the differentiation of CD8(+) effector T cells. Nat Immunol 18, 1046–1057 (2017). - PMC - PubMed
    1. Lian G. et al., Glutathione de novo synthesis but not recycling process coordinates with glutamine catabolism to control redox homeostasis and directs murine T cell differentiation. Elife 7, (2018). - PMC - PubMed

Publication types

MeSH terms