. 2021 May 13;12(5):481.
doi: 10.1038/s41419-021-03759-9.

p27 controls autophagic vesicle trafficking in glucose-deprived cells via the regulation of ATAT1-mediated microtubule acetylation

Affiliations

p27 controls autophagic vesicle trafficking in glucose-deprived cells via the regulation of ATAT1-mediated microtubule acetylation

Ada Nowosad et al. Cell Death Dis. .

Abstract

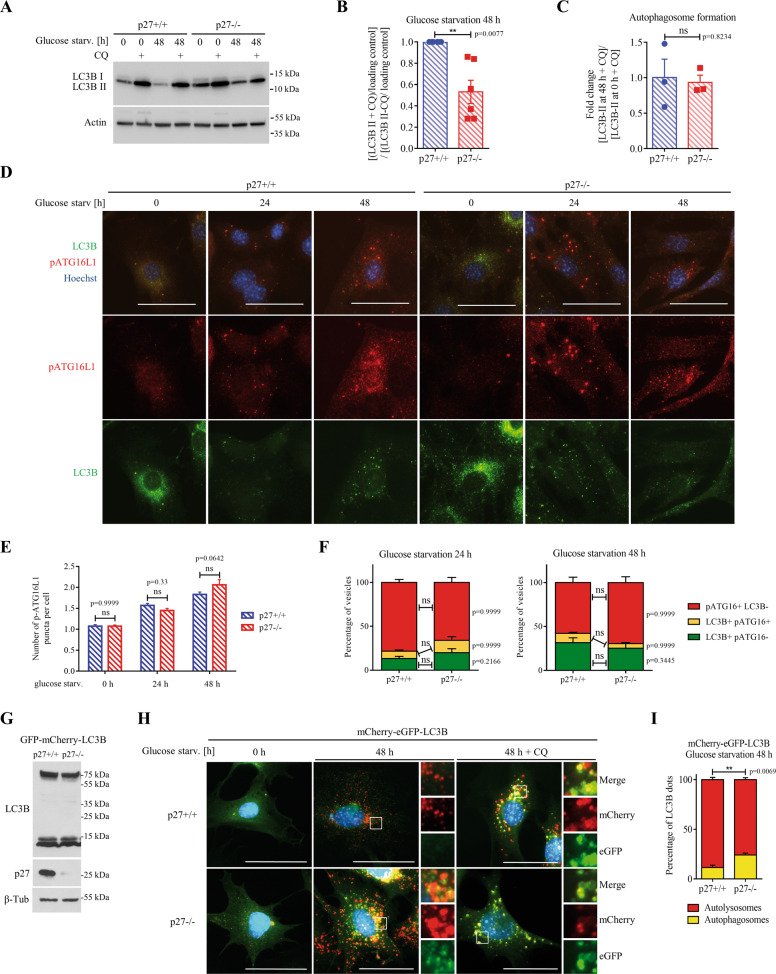
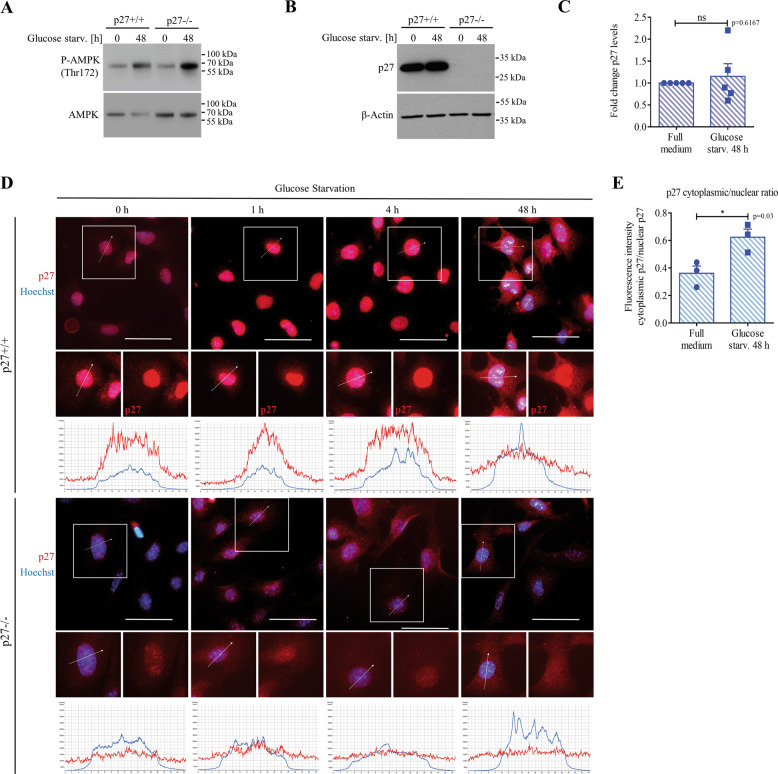
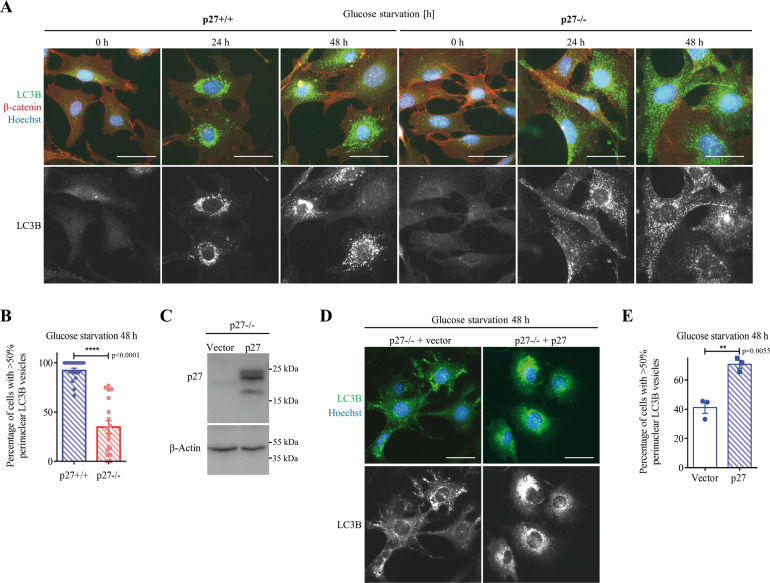
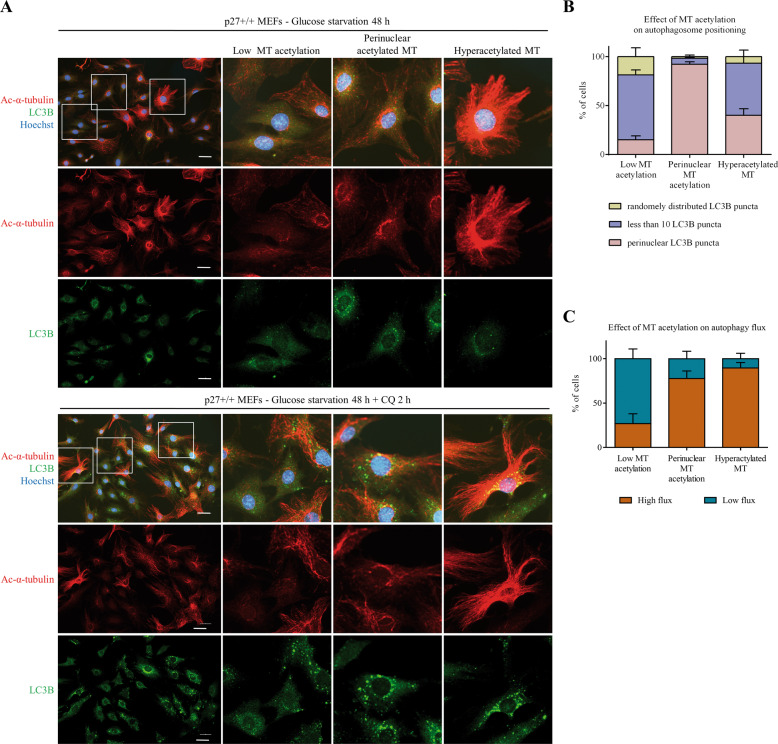
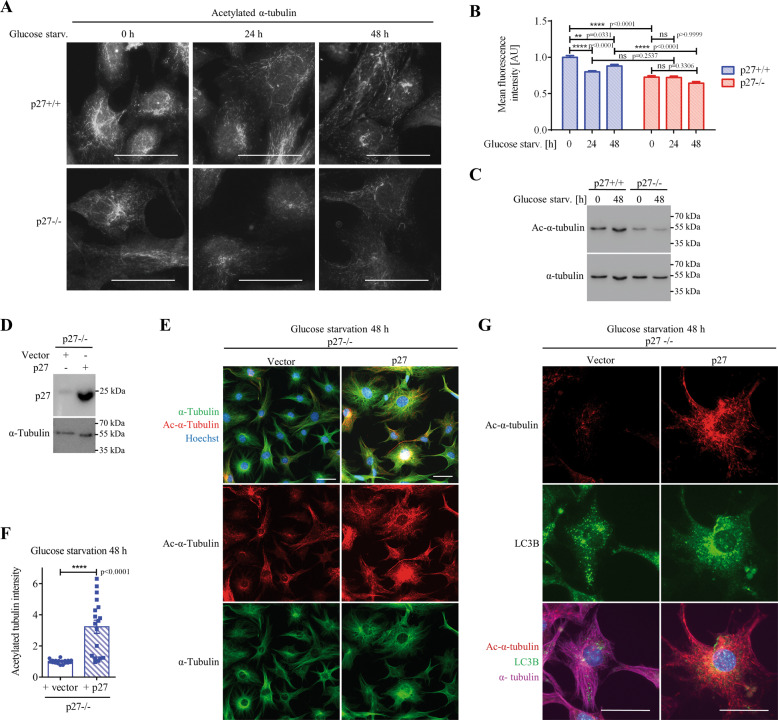
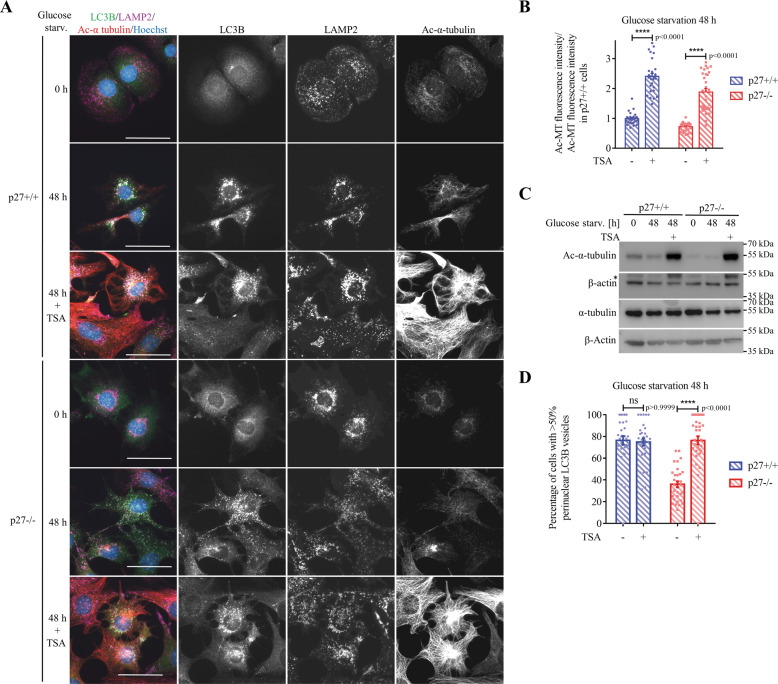
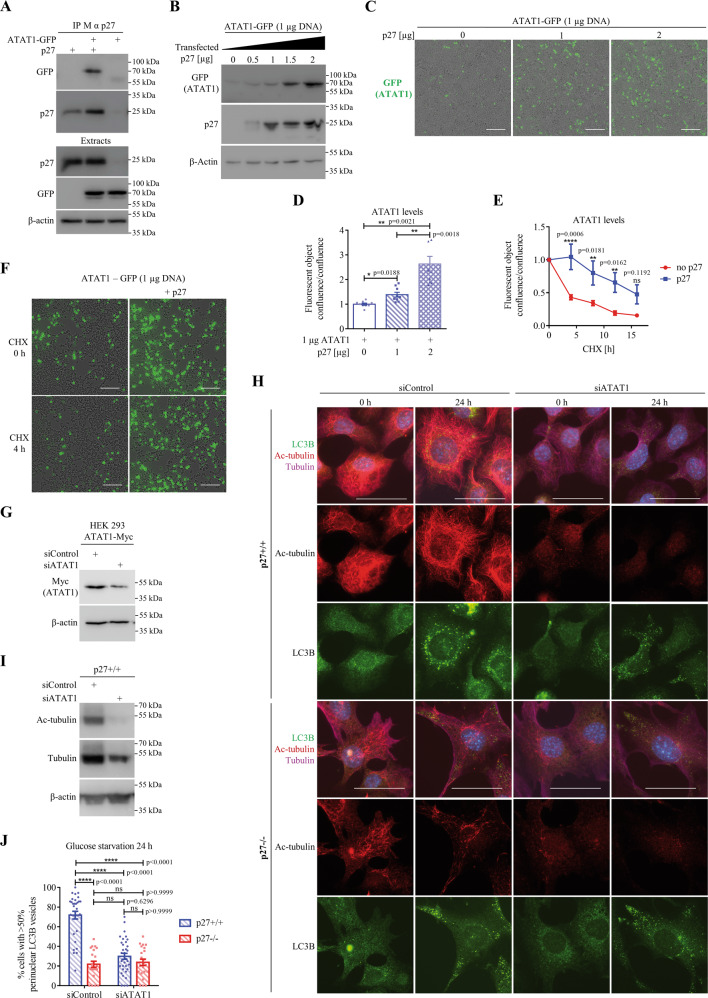
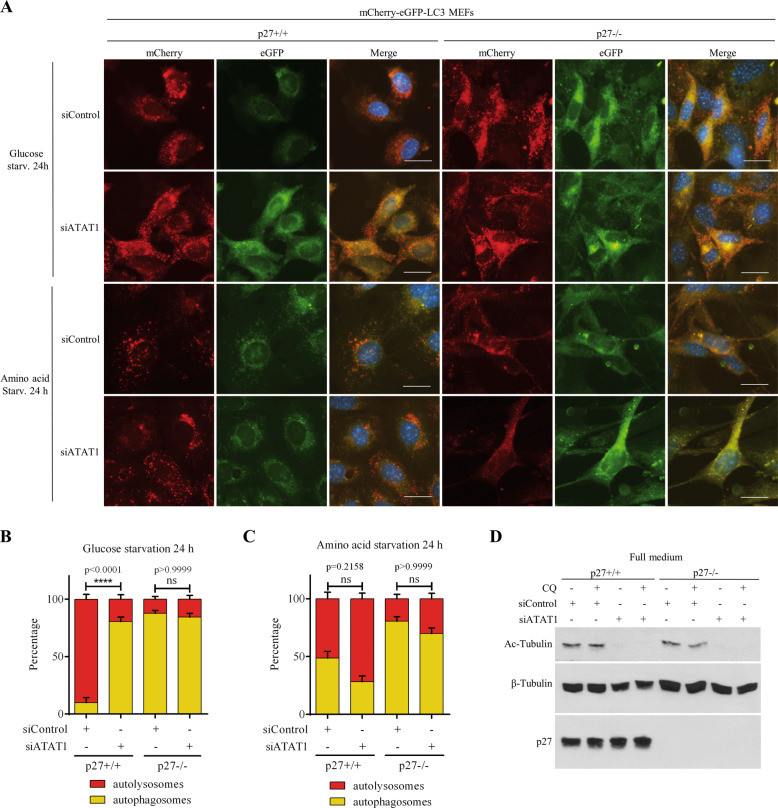
The cyclin-dependent kinase inhibitor p27Kip1 (p27) has been involved in promoting autophagy and survival in conditions of metabolic stress. While the signaling cascade upstream of p27 leading to its cytoplasmic localization and autophagy induction has been extensively studied, how p27 stimulates the autophagic process remains unclear. Here, we investigated the mechanism by which p27 promotes autophagy upon glucose deprivation. Mouse embryo fibroblasts (MEFs) lacking p27 exhibit a decreased autophagy flux compared to wild-type cells and this is correlated with an abnormal distribution of autophagosomes. Indeed, while autophagosomes are mainly located in the perinuclear area in wild-type cells, they are distributed throughout the cytoplasm in p27-null MEFs. Autophagosome trafficking towards the perinuclear area, where most lysosomes reside, is critical for autophagosome-lysosome fusion and cargo degradation. Vesicle trafficking is mediated by motor proteins, themselves recruited preferentially to acetylated microtubules, and autophagy flux is directly correlated to microtubule acetylation levels. p27-/- MEFs exhibit a marked reduction in microtubule acetylation levels and restoring microtubule acetylation in these cells, either by re-expressing p27 or with deacetylase inhibitors, restores perinuclear positioning of autophagosomes and autophagy flux. Finally, we find that p27 promotes microtubule acetylation by binding to and stabilizing α-tubulin acetyltransferase (ATAT1) in glucose-deprived cells. ATAT1 knockdown results in random distribution of autophagosomes in p27+/+ MEFs and impaired autophagy flux, similar to that observed in p27-/- cells. Overall, in response to glucose starvation, p27 promotes autophagy by facilitating autophagosome trafficking along microtubule tracks by maintaining elevated microtubule acetylation via an ATAT1-dependent mechanism.


Conflict of interest statement

The authors declare no competing interests.

Figures

Fig. 1
Fig. 1. p27 promotes autophagy flux in glucose-deprived cells.
A LC3B immunoblot in p27+/+ and p27−/− MEFs in full medium (0 h) or glucose-deprived for 48 h ± CQ (50 µM) for 2 h before collecting cells. Actin was used as loading control. B LC3 turnover, measured as a ratio of LC3B-II signal intensity in starved cells in the presence of CQ versus LC3B-II under the same conditions without CQ, as described in A. Graph shows means ± SEM from n = 6 independent experiments. C Autophagosome formation was evaluated by measuring the ratio of LC3B-II levels, in the presence of CQ to block lysosomal degradation, at 48 h and 0 h of glucose starvation. Graph shows means ± SEM from n = 3 independent experiments. D p27+/+ and p27−/− MEFs were glucose-starved for the indicated times and stained for p-ATG16L1 and LC3B. DNA was stained with Hoechst 33342. E Graph shows the average number of p-ATG16L1 puncta per cell ± SEM. Number of cells used for quantification: p27+/+: n = 210 (0 h), 625 (24 h), n = 822 (48 h); p27−/−: n = 222 (0 h), n = 906 (24 h), n = 284 cells (48 h). F Graphs show mean ± SEM of the distribution of autophagophores (p-ATG16L1+/LC3B−, red), early autophagosomes (p-ATG16L1+/LC3B+, yellow) and mature/sealed autophagosomes (p-ATG16L1−/LC3B+, green) in cells deprived of glucose for 24 h (p27+/+: n = 15; p27−/−: n = 27 images and 48 h (p27+/+: n = 16; p27−/−: n = 19 images). G Immunoblot for LC3B and p27 in mCherry-eGFP-LC3B MEFs used in experiment described in (H). In the LC3B immunoblot, the 75 kDa band is mCherry-GFP-LC3B and the ~13 kDa doublet is endogenous LC3B. β-tubulin was used as loading control. H p27+/+ and p27−/− MEFs expressing mCherry-eGFP-LC3B were glucose deprived for 48 h and fixed prior to microscopy analysis. CQ treatment for 2 h was used as negative control. Scale bars are 50 µm. I Quantification of experiments as described in (H) in MEFs glucose starved for 48 h. Yellow LC3B dots represent autophagosomes, while red LC3B dots represent autolysosomes. Graph shows mean ± SEM number of autolysosomes and autophagosomes from n = 3 independent experiments. At least 150 LC3B dots were analyzed per conditions per experiment. B, C, E, F, I Statistical significance was evaluated by two-tailed Student’s t test with Welch’s correction (B, C) or 2-way ANOVA (E, F, I).
Fig. 2
Fig. 2. p27 localizes in the cytoplasm during prolonged glucose starvation.
A Immunoblot for P-T172-AMPK and AMPK of p27+/+ and p27−/− MEFs in full medium (0 h) or glucose-starved for 48 h. B p27 immunoblot of p27+/+ and p27−/− MEFs in full medium (0 h) or glucose-starved for 48 h. β-actin was used as loading control. C Graph shows mean ± SEM of quantification of p27 levels from experiments shown in B, expressed as fold change from full medium condition from n = 5 independent experiments. D p27+/+ and p27−/− MEFs were glucose-deprived for the indicated times and immunostained for p27. Nuclear DNA was stained with Hoechst 33342. Graphs display the fluorescence intensity (arbitrary unit) in each channel over the distance depicted by the arrows. E Graph shows means ± SEM of the cytoplasm to nuclear ratio of p27 fluorescence intensity in p27+/+ and p27−/− MEFs in full medium (0 h) or glucose-starved for 48 h from n = 3 independent experiments. At least 64 cells were analyzed per condition per experiment. C, E Statistical significance was evaluated by two-tailed Student’s t test with Welch’s correction.
Fig. 3
Fig. 3. p27 affects autophagosome positioning in glucose-deprived cells.
A p27+/+ and p27−/− MEFs were glucose deprived for the indicated times and immunostained for LC3B. β-catenin was used to visualize cell shape and DNA was stained with Hoechst 33342. Scale bars are 50 µm. B Mean percentage of cells with over 50% of LC3B+ vesicles in the perinuclear region. n = 17 (p27+/+) and n = 18 (p27−/−) images from three experiments as described in (A) were used for quantification. Autophagosome distribution was evaluated based on a percentage of LC3 integrated density in perinuclear area (designed by region of interest [ROI]) versus LC3 integrated density in the whole cell. Graph show means ± SEM. C p27 immunoblot of p27−/− MEFs retrovirally infected with p27 or empty vector. β-Actin was used as loading control. D LC3B immunostaining of MEFs infected with p27 or empty vector glucose deprived for 48 h. DNA was stained with Hoechst 33342. Scale bars are 50 µm. E Mean percentage of cells with over 50% LC3B+ vesicles in the perinuclear region from experiments as described in (D) from n = 3 independent experiments. Autophagosome distribution was evaluated as in (B). Graph show means ± SEM. B, E Statistical significance was evaluated by two-tailed Student’s t test with Welch’s correction.
Fig. 4
Fig. 4. MT acetylation levels determine autophagosome positioning and autophagy flux.
A Immunostaining for LC3B and acetylated (Ac-) α-tubulin of p27+/+ MEFs glucose starved for 48 h (upper panel) and treated with 50 µM CQ for the last 2 h (lower panel). Cells were classified into three categories in function of their microtubule (MT) acetylation pattern: low MT acetylation; perinuclear acetylated MT and hyperacetylated MT. In each population, LC3B+ vesicles were analyzed to determine if there is a correlation between MT acetylation status and vesicle positioning. Scale bars are 50 µm. B Mean percentage of cells with distinct LC3B distribution patterns (Randomly distributed, less than 10 LC3B puncta and perinuclear LC3B puncta) in each MT acetylation pattern described in (A). The graph shows means ± SEM from n = 2 independent experiments. At least 65 cells were analyzed per experiment. The number of LC3B puncta was determined using Find maxima function in ImageJ. C Autophagy flux (high or low) was determined based on the capacity of cells to accumulate LC3B dots upon CQ treatment in cells from experiments described in (A), in function of their MT acetylation status. Autophagy flux was estimated by determining the average LC3B fluorescence intensity in cells (designated as ROIs). Then, cells with a mean LC3B fluorescence intensity above that average were considered as having high autophagy flux and cells with a mean LC3B fluorescence intensity below that value were considered as having low autophagy flux. A total of 331 cells were analyzed from n = 2 independent experiments.
Fig. 5
Fig. 5. p27 promotes microtubule acetylation.
A Acetylated (Ac-) α-tubulin immunostaining of p27+/+ and p27−/− MEFs in full medium or glucose-deprived for 24 h and 48 h. B Quantification of acetylated tubulin intensity normalized to the mean value in p27+/+ cells in full medium from experiments described in (A). Number of cells used for quantification: p27+/+: n = 388 (0 h), n = 474 (24 h), n = 706 (48 h); p27−/−: n = 492 (0 h), n = 1316 (24 h), n = 689 (48 h). C Ac-α-tubulin and α-tubulin immunoblots in p27+/+ and p27−/− MEFs in full medium or glucose deprived for 48 h. D p27 immunoblot in p27−/− MEFs infected with either empty vector or p27. α-tubulin was used as loading control. E p27−/− MEFs infected with either empty vector or p27 were glucose-starved for 48 h and immunostained for Ac-α-tubulin and α-tubulin. DNA was stained with Hoechst 33342. F Quantification of acetylated tubulin fluorescence intensity in p27−/− MEFs re-expressing p27 normalized to control vector infected cells from n = 3 independent experiments as described in (E). At least 155 cells were analyzed per condition per experiment. G Ac-α-tubulin, LC3B and α-tubulin immunostaining of p27−/− MEFs infected with either empty vector or p27, glucose starved for 48 h. A, E, G Scale bars are 50 µm. B, F Graphs show means ± SEM. Statistical significance was determined using 2-way ANOVA (B) or unpaired two-tailed Student’s t test with Welch’s correction (F).
Fig. 6
Fig. 6. HDAC inhibition restores autophagosomes positioning in p27−/− cells.
A LC3B, LAMP2 and Ac-α-tubulin immunostaining of p27+/+ and p27−/− MEFs glucose deprived for 48 h ± 0.2 µM TSA for 1 h. Scale bars are 50 µM. B Acetylated tubulin fluorescence intensity was measured in cells glucose-starved for 48 h. Values were normalized to 48 h glucose-starved p27+/+ cells. At least 160 cells were analyzed per condition in each experiment from n = 3 independent experiments. C Immunoblotting for Ac-α-tubulin and tubulin in cells as described in A. Actin was used as loading control. * denotes remaining Ac-α-tubulin signal after membrane stripping. D Percentage of p27+/+ and p27−/− MEFs glucose deprived for 48 h ± 0.2 µM TSA for 1 h with >50 % of LC3B vesicles in the perinuclear region. Autophagosome distribution was evaluated based on a percentage of LC3 integrated density in perinuclear area (designed by region of interest [ROI]) versus LC3 integrated density in the whole cell. At least 91 cells were analyzed per condition. n = 3 independent experiments. B, D Bar graphs show mean ± SEM. Statistical significance was determined using 2-way ANOVA followed by Bonferroni multiple comparison test.
Fig. 7
Fig. 7. p27 regulates autophagosome positioning via the control of ATAT1 stability.
A HEK 293 cells were transfected with p27 and/or ATAT1-GFP for 24 h. p27 was immunoprecipitated and p27-bound ATAT1 was detected with anti-GFP antibodies. Expression levels of p27 and ATAT1-GFP were determined by immunoblotting in extracts. β-actin was used as loading control. B HEK 293 cells were transfected with 1 µg of ATAT1-GFP vector and increasing amounts of p27 for 24 h. Expression levels of ATAT1-GFP and p27 were determined by immunoblotting. β-actin was used as loading control. C Representative images of cells from (B) acquired with the IncuCyte. Green fluorescence represents ATAT1 expression. Scale bars are 200 µm. D Quantification of experiments as described in (C). Fluorescent object confluence was measured and normalized to cell confluence (phase contrast). Values were normalized to empty vector transfected cells condition. n = 9 images per condition from three independent experiments. E HEK 293 cells were transfected with 1 µg ATAT1-GFP for 48 h and 2 µg p27 or empty vector and treated with 50 µg/ml cycloheximide (CHX) for 16 h. Images were acquired with an IncuCyte every 4 h to monitor ATAT1-GFP expression levels (green fluorescence). Values of fluorescent object confluence were normalized to cell confluence. n = 12 images per time point for each condition from three independent experiments were used for quantification. F Representative images of experiment as described in (E). Scale bars are 200 µm. G Validation of ATAT1 siRNA. HEK 293 cells were transfected with Myc-ATAT1 for 24 h and then with 50 nM siRNA for another 48 h and subjected to immunoblot against Myc. Actin was used as loading control. H p27+/+ and p27−/− MEFs were transfected with either control or ATAT1 siRNA. After 24 h, cells were collected and fixed (0 h) or glucose starved for 24 h. Cells were stained for LC3B, acetylated α-tubulin and α-tubulin. Scale bars are 50 µM. I Acetylated (Ac-) α-tubulin and α-tubulin immunoblot on p27+/+ MEFs transfected with ATAT1 siRNA and collected after 48 h. Since tubulin levels change after ATAT1 siRNA transfection, β-actin was used as loading control. J Mean percentage of cells with over 50% of perinuclear LC3B+ vesicles from three (p27+/+) or two (p27−/−) experiments as described in (H). Autophagosome distribution was evaluated based on a percentage of LC3B integrated density in perinuclear area (designated as region of interest [ROI]) versus LC3B integrated density in the whole cell. Number of images used for quantification: p27+/+: n = 31 (siControl), n = 34 (siATAT1); p27−/−: n = 22 (siControl), n = 22 (siATAT1). At least 105 cells per condition were analyzed per experiment. D, E, J Graphs show means ± SEM. Statistical significance was determined by 1-way (D) or two-way ANOVA (E, J) followed by Bonferroni multiple comparison test.
Fig. 8
Fig. 8. ATAT1 mediates p27 regulation of autophagy in glucose-deprived cells.
A p27+/+ and p27−/− mCherry-eGFP LC3 MEFs were transfected with siRNA against ATAT1 or control siRNA. After 24 h, cells were starved for either glucose or aa for further 24 h. Scale bar 50 µm. B, C Graphs show the percentage of autophagosomes (yellow puncta) and autolysosomes (red puncta) in glucose-deprived cells (B) and amino acid-deprived cells (C), as described in (A). Number of analyzed images: Glucose starvation: p27+/+ siControl n = 31; p27+/+ siATAT1 n = 45; p27−/− siControl n = 38, p27−/− siATAT1 n = 49; Amino acid starvation: p27+/+ siControl n = 40; p27+/+ siATAT1 n = 34; p27−/− siControl n = 38, p27−/− siATAT1 n = 57 Statistical significance was determined by 2-way ANOVA followed by Bonferroni multiple comparison test. D Immunoblot showing the efficiency of siATAT1 by monitoring microtubule acetylation levels in p27+/+ and p27−/− MEFs. Membranes were probed for Ac-α-tubulin, p27 and β-tubulin as loading control.

References

    1. Besson A, Dowdy SF, Roberts JM. CDK Inhibitors: cell cycle regulators and beyond. Developmental Cell. 2008;14:159–169. doi: 10.1016/j.devcel.2008.01.013. - DOI - PubMed
    1. Fero ML, Randel E, Gurley KE, Roberts JM, Kemp CJ. The murine gene p27Kip1 is haplo-insufficient for tumour suppression. Nature. 1998;396:177–180. doi: 10.1038/24179. - DOI - PMC - PubMed
    1. Fero ML, et al. A syndrome of multiorgan hyperplasia with features of gigantism, tumorigenesis, and female sterility in p27(Kip1)-deficient mice. Cell. 1996;85:733–744. doi: 10.1016/S0092-8674(00)81239-8. - DOI - PubMed
    1. Min YH, et al. Cytoplasmic mislocalization of p27Kip1 protein is associated with constitutive phosphorylation of Akt or protein kinase B and poor prognosis in acute myelogenous leukemia. Cancer Res. 2004;64:5225–5231. doi: 10.1158/0008-5472.CAN-04-0174. - DOI - PubMed
    1. Liang J, et al. PKB/Akt phosphorylates p27, impairs nuclear import of p27 and opposes p27-mediated G1 arrest. Nat. Med. 2002;8:1153–1160. doi: 10.1038/nm761. - DOI - PubMed

Publication types