. 2021 Jul;5(7):1011-1023.
doi: 10.1038/s41559-021-01457-5. Epub 2021 May 13.

Engineering complex communities by directed evolution

Affiliations

Engineering complex communities by directed evolution

Chang-Yu Chang et al. Nat Ecol Evol. 2021 Jul.

Abstract

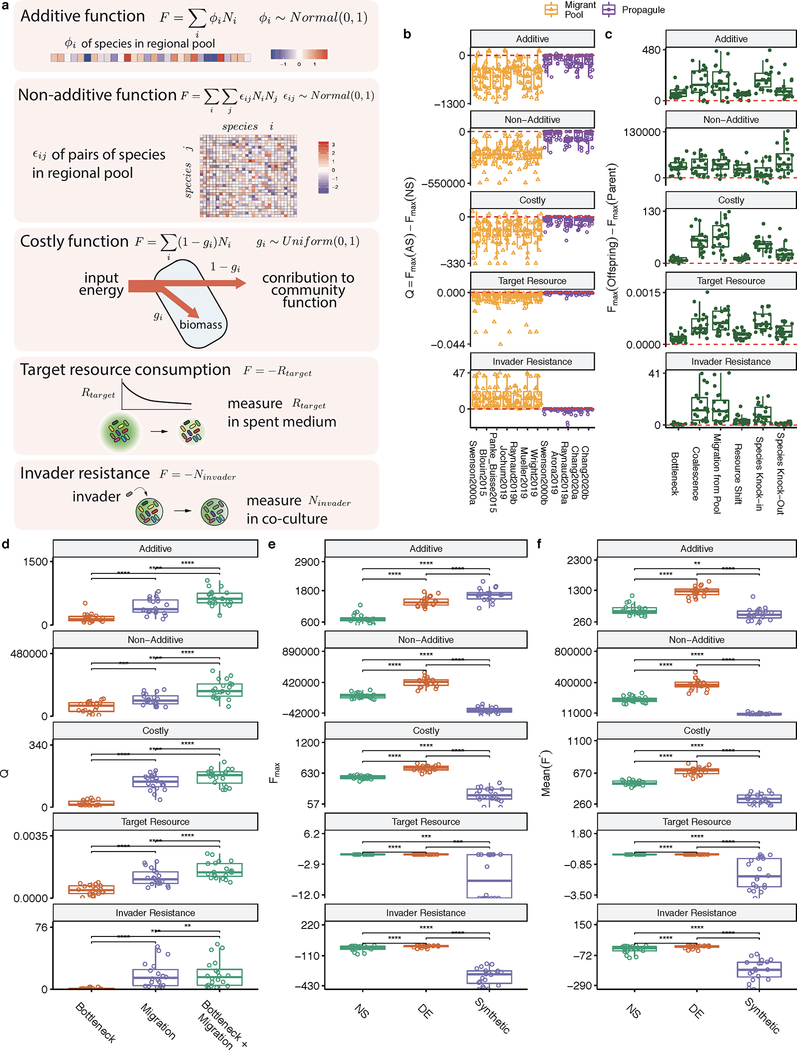
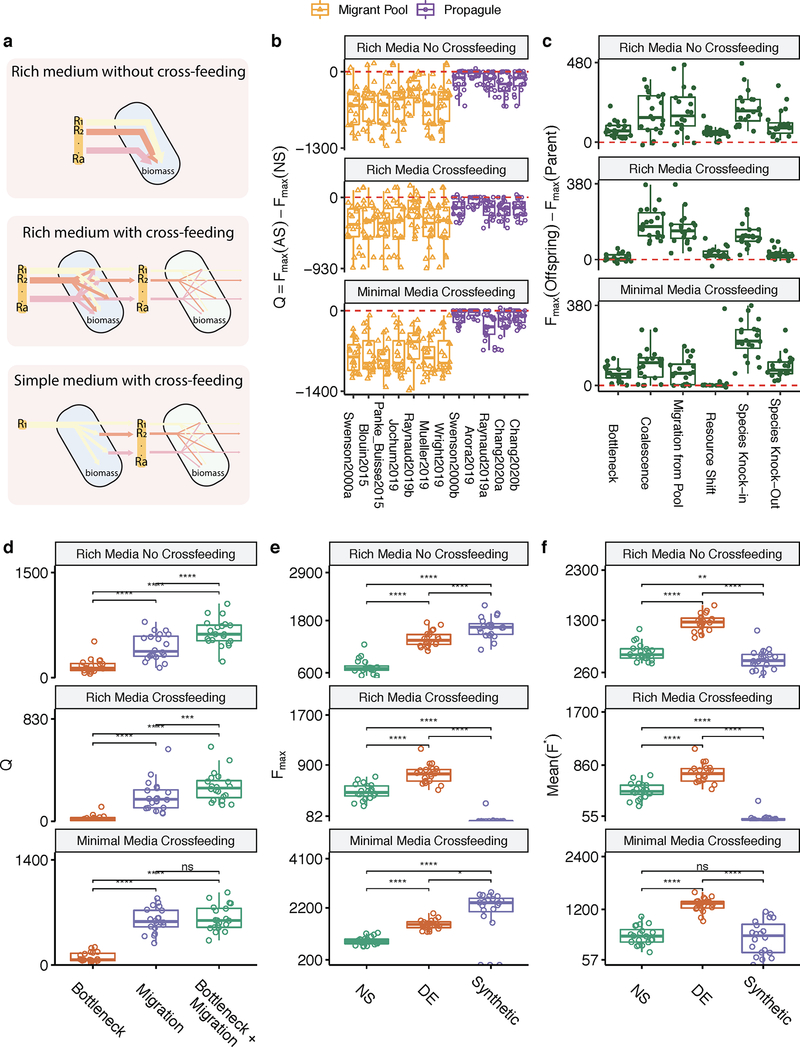
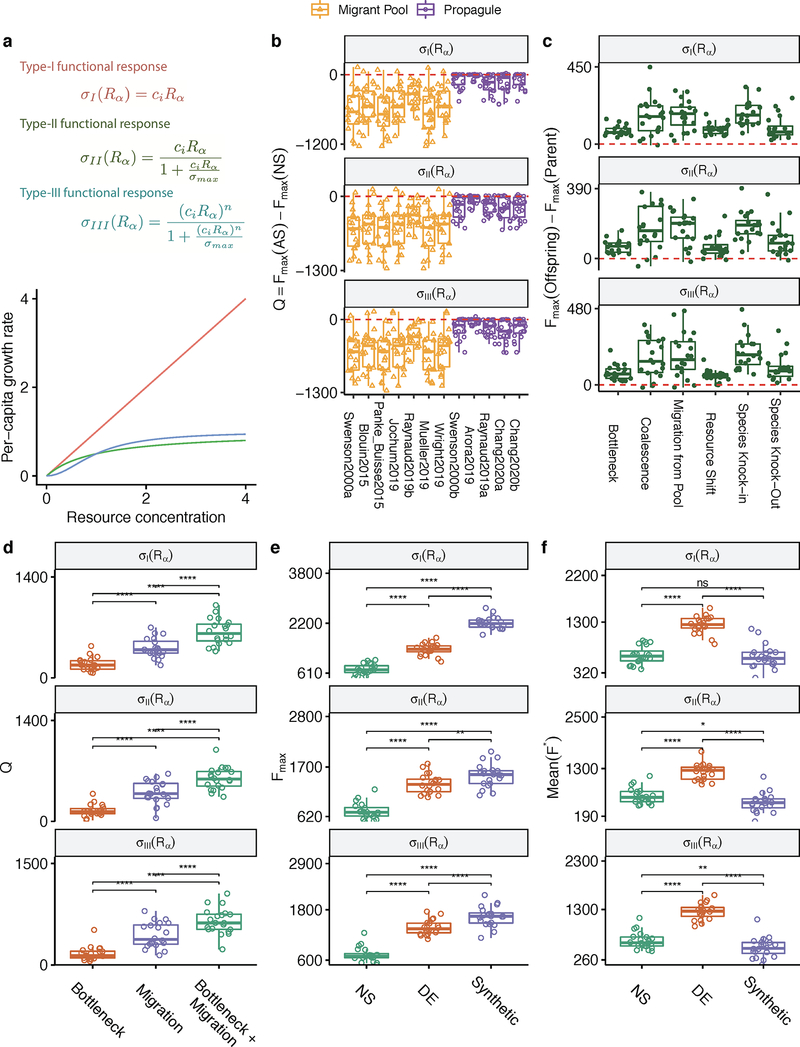
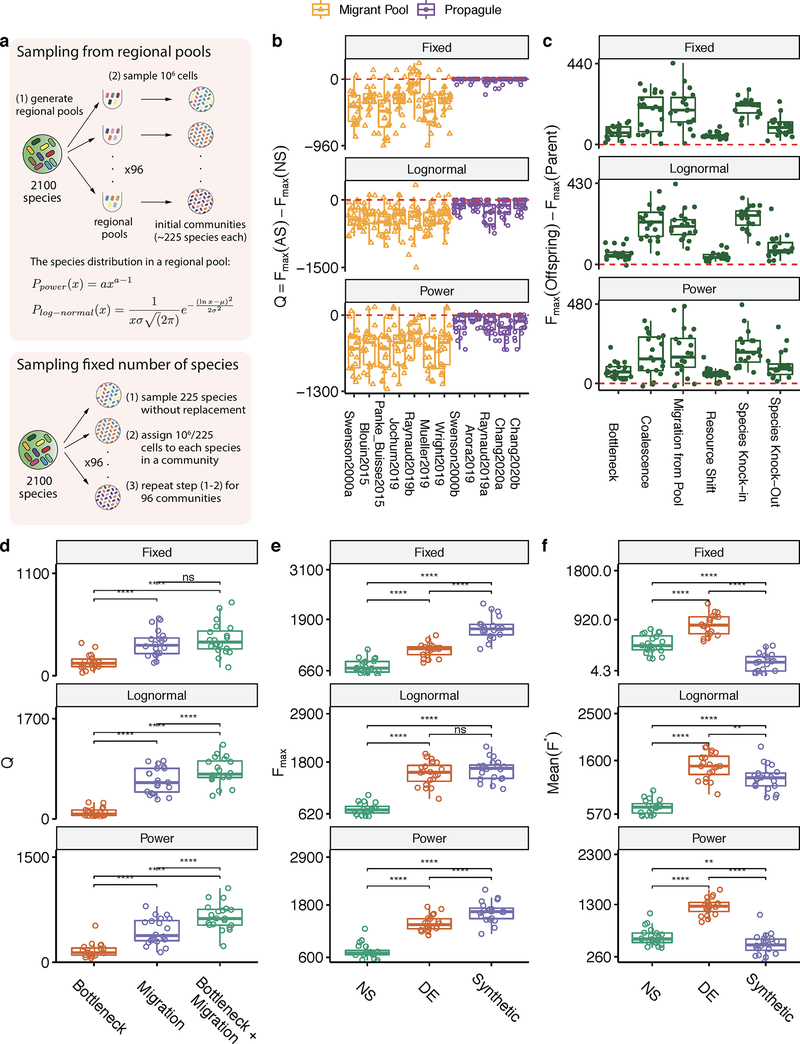
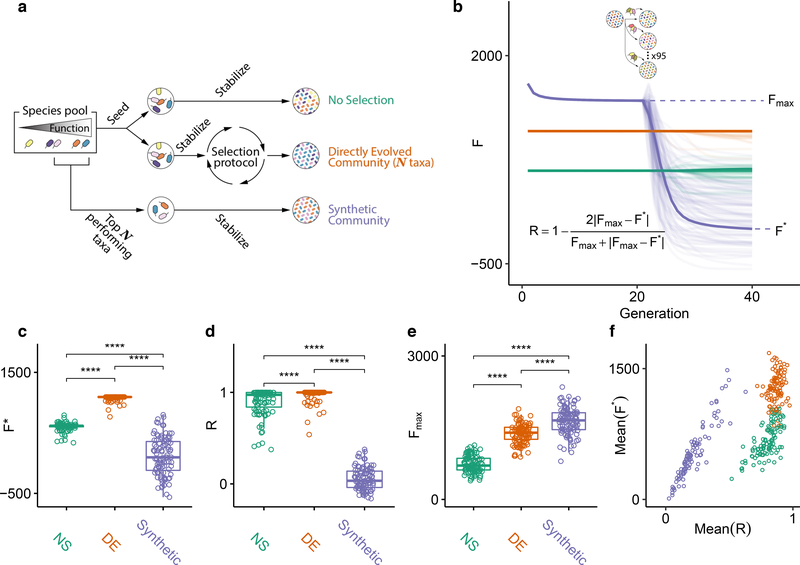
Directed evolution has been used for decades to engineer biological systems at or below the organismal level. Above the organismal level, a small number of studies have attempted to artificially select microbial ecosystems, with uneven and generally modest success. Our theoretical understanding of artificial ecosystem selection is limited, particularly for large assemblages of asexual organisms, and we know little about designing efficient methods to direct their evolution. Here, we have developed a flexible modelling framework that allows us to systematically probe any arbitrary selection strategy on any arbitrary set of communities and selected functions. By artificially selecting hundreds of in silico microbial metacommunities under identical conditions, we first show that the main breeding methods used to date, which do not necessarily let communities reach their ecological equilibrium, are outperformed by a simple screen of sufficiently mature communities. We then identify a range of alternative directed evolution strategies that, particularly when applied in combination, are well suited for the top-down engineering of large, diverse and stable microbial consortia. Our results emphasize that directed evolution allows an ecological structure-function landscape to be navigated in search of dynamically stable and ecologically resilient communities with desired quantitative attributes.


Conflict of interest statement

COMPETING INTERESTS. The authors declare no competing interests

Figures

Extended Data Figure 1.
Extended Data Figure 1.. Non-additive function, costly function, and two empirically motivated functions.
(A) Illustration of the different types of community function we have considered. In addition to the additive function used in the main text we have simulated four other community functions: a non-additive pairwise function, a costly function, a function that maximises the consumption of a target resource, and a function that maximizes resistance to an invader. Panels B-F reproduce the main results reported in Figures 1–4. (B) Difference in Fmax between the artificial selection line (AS) and no-selection line (NS) for all previously published protocols, corresponding to Fig. 1F. (C) Difference in Fmax between parent (before directed evolution) and offspring (after directed evolution) for the 6 types of perturbation considered in figure 2, this plot aggregates the results shown in Fig. 2D–I. (D) Reproduction of Fig. 3E, to show that iteratively combining migrations and bottlenecks does better than either alone. Q is obtained from each of the three iterative protocols at generation 460 (E) Reproduction of Fig. 4E, where we compare Fmax of the no-selection (NS), directed evolution (DE), and synthetic communities; (F) Mean function (F*) of the DE, NS and Synthetic communities following an ecological perturbation (migration). This corresponds to the y-axis of Fig. 4F.
Extended Data Figure 2.
Extended Data Figure 2.. Alternative ecological scenarios with metabolic cross-feeding.
Besides the rich medium without cross-feeding shown in the main text, we have included two other ecological scenarios: i) rich medium with cross-feeding and ii) simple minimal medium with cross-feeding. The layout of (B-F) follows Extended Data Fig. 1B–F, reproducing the main results from Fig. 1–4.
Extended Data Figure 3.
Extended Data Figure 3.. Functional responses.
The resource import rate depends on its concentration in the environments, which can take a linear (type I), Monod (type II), or Hill (type III) form. A Type-III functional response is used in the simulation presented in the main text. The layout of (B-F) follows Extended Data Fig. 1B–F, reproducing the main results from Fig. 1–4.
Extended Data Figure 4.
Extended Data Figure 4.. Alternative Metacommunity sampling approaches.
We simulate three metacommunity sampling approaches: i) Each community is seeded with 106 cells drawn from a different regional pool, where the species abundances in each regional pool are drawn from a power-law distribution with a = 0.01, ii) Each community is seeded with 106 cells drawn from a different regional, where the species abundances in each regional pool are drawn from a log-normal distribution with mean μ = 8 and standard deviation σ = 8, iii) Each community is seeded with a randomly chosen set of 225 species and they are all set to have the same initial abundance. The simulation in the main text adopts the power-law distribution approach. The layout of (B-F) follows Extended Data Fig. 1B–F, reproducing the main results from Fig. 1–4.
Extended Data Figure 5.
Extended Data Figure 5.. Different distributions of per capita species contribution to additive community function.
Per capita species contribution drawn from i) normal distribution centered around 0 with standard deviation sd=1, ii) normal distribution with mean=11 and sd=1, iii) uniform distribution ranged from min=0 to max=1, iiii) a sparse additive function where 20% of the species contribute to community function.In the main text, per capita species contribution uses normal distribution with mean=0 and sd=1. The layout of (B-F) follows Extended Data Fig. 1B–F, reproducing the main results from Fig. 1–4.
Figure 1.
Figure 1.. Migrant-pool and propagule strategies are limited in their ability to find new, high-functioning microbial communities.
(A) We constructed a Python package, ecoprospector, which allows us to artificially select arbitrarily large and diverse in silico communities. The experimental design of a selection protocol (e.g., number of communities, growth medium, method of artificial selection, function under selection, etc.) is entered in a single input .csv file (Methods). Communities are grown in serial batch-culture, where each transfer into a new habitat is referred to as a community “generation”. Within each batch incubation, species compete for nutrients from the supplied medium. At the end of the incubation period, communities are selected according to the specified, protocol-specific selection scheme, and the selected group is used to seed the communities in the offspring generation. Once the protocol is carried out to completion, ecoprospector outputs a simple text format for later analysis on community function and composition. (B) Illustration of previously used migrant pool and propagule selection schemes (AS) as well as the corresponding randomized controls (RS) ,. We also consider a no-selection ‘control’ scheme (NS). All protocols are applied at the end of each community generation and are implemented using a matrix representation depicted in Supplementary Fig. 1. A representative outcome of one community-level selection experiment is shown in (C-D), where we adapted the selection protocol from the migrant-pool strategy in ref . A metacommunity is seeded by inoculating ninoc = 106 randomly drawn cells from a species pool into each of 96 identical habitats and allowing them to grow (Methods). The metacommunity was then subject to 20 rounds of selection (generations), and then allowed to stabilize without selection for another 20 generations. The function maximized under selection F is additive on species contributions, whose per-capita species contribution to function is randomly generated (see main text). In each selection round, the top 20% communities with highest F (AS; red) (or a randomly chosen set in (RS; blue)) are selected and mixed into a single pool which is then used to seed all communities in the next generation by randomly sampling 106 cells into them. The NS protocol (green) simply propagates the communities in batch mode without selection. The changes in overall function over the generations is shown in (C) (average F) and (D) (maximum function Fmax). (E) Selection strategies were adapted from twelve experimental protocols in previous studies (see Supplementary Table 1; Methods). All were applied to standard metacommunity sizes (96 communities), for the same number of generations (20 selection generations + 20 stabilization generations). All protocols have a significantly greater mean function in the AS than in the NS line (two-sided paired t-test, P < 0.01) as well as the RS lines (Supplementary Fig. 4). (F) The difference in Fmax between the AS and NS lines (Q). All protocols show a Mean Q < 0 (two-sided Welch’s t-test, P < 0.01), indicating that they did not succeed at improving the function of the best stabilized community in the ancestral population.
Figure 2.
Figure 2.. Directed evolution as an artificial selection strategy for high-performing communities.
(A) Directed evolution of microbial communities can be represented as a guided navigation of a dynamic structure-function landscape, which contains several stable fixed points with different community functions. Community states are given by the abundances of species i,j in the “adult” population at the end of a batch. Each of the stable fixed points represents a “generationally stable” equilibrium, as defined in the main text. A library of communities is generated by inoculating from a set of different species pools, followed by stabilization without selection before being scored for function. The top-performing community is selected and either passaged intact into the new generation, or subject to ecological perturbations to generate compositional variants, thereby “exploring” the neighboring stable equilibria in the structure-function landscape. We note that this panel is only a cartoon, the true structure-function landscape is multi-dimensional, and the dynamical stability of equilibria can be significantly more complex than illustrated here. None of those details are critical for our results or discussion. (B) A representative outcome of directed evolution of in silico microbial communities. N=96 communities are first stabilized by serially passaging without selection with a dilution factor of 103× for 20 generations. The community with the highest function Fmax(parent) (black dots and line) is selected and used to seed the new generation. To that end, the selected community is either passaged intact with the same dilution factor of 103× (N=1), or subject to 95 dilution shocks (108×) to generate variants. The 96 offspring communities are then propagated for another 20 generations until they stabilize. The top offspring variant Fmax(offspring) is highlighted with black dots and line. The red dashed line denotes the Fmax of a no-selection line. (C) Sampling the optimal bottleneck size by subjecting a single parent community to bottlenecks of different intensity. Each bottleneck is applied 95 times. In orange, we trace the Fmax for the highest-function variants for each bottleneck size. In purple, we track the mean function. Inset shows the outcome of repeating this experiment 100 times with different starting communities (Mean±SD). This shows that intermediate bottlenecks maximize the Fmax. (D-I) Fmax of 95 stable offspring variants generated through a variety of methods (see text for details), as a function of the Fmax of the (stable) parental community from which all variants were generated. Points above the red dashed line indicated an increase in Fmax from parent to offspring. The filled black circle in panel D marks the representative example shown in panel B.
Figure 3.
Figure 3.. Iteratively combining bottlenecks and migrations to optimize community function selects for high-functioning communities.
(A) Schematic of iterative protocols of directed evolution. A metacommunity of 96 communities was stabilized for 30 generations by serial batch-culture with dilution factor 103×(Methods). The top community after 30 generations was selected, and either passaged intact to the offspring generation, or used to generate 95 new variants by three different means: (red) in addition to the regular dilution factor (103×), we applied a harsh bottleneck (104×); (purple) we applied a migration event where 102 cells (~45 species; Methods) were randomly sampled from the regional pool and added to each community immediately after passaging them with the regular dilution factor of 103×; (green) a combination of both: after the passage with regular dilution factor (103×), communities are first bottlenecked with a dilution factor (104×), followed by migration from the regional pool (102 cells of ~45 species). The 96 offspring communities are stabilized for an additional 20 transfers, following which they are scored for function. The process can be iterated at this point (B-D) F for all communities in each generation as a function of time. Each vertical dashed line marks the time points at which the metacommunities experience selection followed by generation of new variants (color represents perturbation type). Red horizontal lines represent the Fmax of a no-selection line. (E) Q obtained from each of the three protocols at the final time point (generation 460) in N=100 independent selection lines. Each point represents the outcome of a different directed evolution experiment. Brackets represent two-sided paired t-tests (N=100 for each test). ****:p<0.0001.
Figure 4.
Figure 4.. Directed evolution produces communities that are resistant to ecological perturbations.
(A) We compare the function and ecological stability of communities engineered from the top-down by directed evolution (DE; red), with a synthetic bottom-up consortium (purple). A no-selection (NS; green) control is also provided for reference. The DE community was found by multiple rounds of selection using a protocol that combines bottleneck and migration to generate variants. The synthetic community of equal diversity (species richness) was assembled by mixing together high-ϕi species from the regional pool (Methods). The top community of the NS control was also chosen as reference. (B) The three communities were stabilized for 20 generations (note that the DE and NS were already in equilibrium at the start, but the synthetic community was not). After that, each community was subject to invasion by a randomly sampled set of species from the regional species pool (Methods). This process was repeated 95 independent times for each community. The perturbed communities (lighter-color lines) were allowed to equilibrate by passaging for an additional 20 generations without artificial selection. Following the perturbation, communities reached a new state with function F*, and from the changes in function before and after the perturbation we compute the resistance R (inset equation) . (C-D) The values of F* and R resulting from panel (B) are plotted. Values above brackets represent p-values of paired t-tests (N = 95 each test). (E-F) The experiment in (B) was repeated 100 times with as many different initial DE, NS, and synthetic consortia. (E) shows Fmax of 100 independent experiments. Values above brackets represent p-values of two-sided paired t-tests (N=100 each test) (F) Mean(R) vs Mean(F*) for all 100 independent experiments. *:p<0.05, ****:p<0.0001.

Comment in

References

    1. Mueller UG & Sachs JL Engineering Microbiomes to Improve Plant and Animal Health. Trends Microbiol 23, 606–617 (2015). - PubMed
    1. Gilbert ES, Walker AW & Keasling JD A constructed microbial consortium for biodegradation of the organophosphorus insecticide parathion. Appl. Microbiol. Biotechnol 61, 77–81 (2003). - PubMed
    1. Yoshida S, Ogawa N, Fujii T & Tsushima S Enhanced biofilm formation and 3-chlorobenzoate degrading activity by the bacterial consortium of Burkholderia sp. NK8 and Pseudomonas aeruginosa PAO1. J. Appl. Microbiol 106, 790–800 (2009). - PubMed
    1. Piccardi P, Vessman B & Mitri S Toxicity drives facilitation between 4 bacterial species. Proc. Natl. Acad. Sci. U. S. A 116, 15979–15984 (2019). - PMC - PubMed
    1. Herrera Paredes S et al. Design of synthetic bacterial communities for predictable plant phenotypes. PLoS Biol 16, e2003962 (2018). - PMC - PubMed

Publication types