. 2021 Apr 27:12:649061.
doi: 10.3389/fimmu.2021.649061. eCollection 2021.

Identification, Validation, and Utilization of Immune Cells in Pancreatic Ductal Adenocarcinoma Based on Marker Genes

Affiliations

Identification, Validation, and Utilization of Immune Cells in Pancreatic Ductal Adenocarcinoma Based on Marker Genes

Willem de Koning et al. Front Immunol. .

Abstract

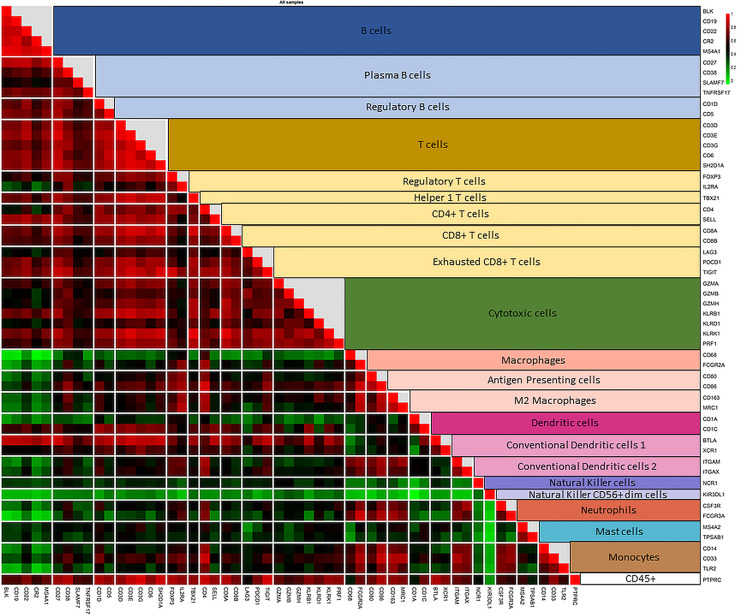
The immune response affects tumor biological behavior and progression. The specific immune characteristics of pancreatic ductal adenocarcinoma (PDAC) can determine the metastatic abilities of cancerous cells and the survival of patients. Therefore, it is important to characterize the specific immune landscape in PDAC tissue samples, and the effect of various types of therapy on that immune composition. Previously, a set of marker genes was identified to assess the immune cell composition in different types of cancer tissue samples. However, gene expression and subtypes of immune cells may vary across different types of cancers. The aim of this study was to provide a method to identify immune cells specifically in PDAC tissue samples. The method is based on defining a specific set of marker genes expressed by various immune cells in PDAC samples. A total of 90 marker genes were selected and tested for immune cell type-specific definition in PDAC; including 43 previously used, and 47 newly selected marker genes. The immune cell-type specificity was checked mathematically by calculating the "pairwise similarity" for all candidate genes using the PDAC RNA-sequenced dataset available at The Cancer Genome Atlas. A set of 55 marker genes that identify 22 different immune cell types for PDAC was created. To validate the method and the set of marker genes, an independent mRNA expression dataset of 24 samples of PDAC patients who received various types of (neo)adjuvant treatments was used. The results showed that by applying our method we were able to identify PDAC specific marker genes to characterize immune cell infiltration in tissue samples. The method we described enabled identifying different subtypes of immune cells that were affected by various types of therapy in PDAC patients. In addition, our method can be easily adapted and applied to identify the specific immune landscape in various types of tissue samples.

Keywords: immune cells; immune microenvironment; mRNA expression; marker genes; pancreatic ductal adenocarcinoma.


Conflict of interest statement

The authors declare that the research was conducted in the absence of any commercial or financial relationships that could be construed as a potential conflict of interest.

Figures

Figure 1
Figure 1
An overview of the method used to determine the definition of immune cells in PDAC tissue samples.
Figure 2
Figure 2
Correlation plot of the pairwise similarity of candidate marker genes tested to identify B cells. The pairwise similarity varies between the 11 selected genes. Five genes (blue) showed a high pairwise similarity (≥ 0.6). These genes were selected to identify B cell infiltration in PDAC tissue samples. Six genes (yellow) showed a low pairwise similarity (< 0.6). these genes were not used to identify B cell infiltration in PDAC tissue samples. The red color in the correlation plot presented the highest correlation score between the genes (R2 = 1); the green color presented the lowest correlation score (R2 = 0).
Figure 3
Figure 3
Correlation plot of the pairwise similarity of all 55 marker genes selected to identify the immune repertoire in PDAC tissue sample. Pairwise similarity plot shows a high correlation between marker genes that identify a specific immune family and the subtype of that family. The highest correlation is shown between the marker genes that identify a specific type of immune cell. In addition, a relatively high correlation is shown between the subtypes of immune cells of the same family (B cells and various subtypes of B cells; T cells and various subtypes of T cells). The correlation between T cells and cytotoxic cells is lower than the other subtypes of T cells because cytotoxic cells include both T and NK cells. The correlation plot also shows a high pairwise similarity and a high specificity of marker genes that identify macrophages and their subtypes in PDAC tissue samples. However, the various types of dendritic cells (DCs)are more difficult to identify. Genes used to identify DCs show a good correlation with T cells and macrophages, highlighting the need to use other marker genes (not measured by the PanCancer Immune profile panel) to increase the accuracy of identifying DCs in PDAC tissue samples.
Figure 4
Figure 4
The impact of using PDAC-MGICs to identify immune cells in PDAC tissue samples. Comparing the relative immune scores using mRNA expression data of 6 tissue samples of patients who were subjected to surgery before receiving any treatment (Surgery Only). Immune cells were identified using the PDAC-MGICs set (purple) or the default marker genes in nSolver® Advanced Analysis module of NanoString technology (yellow). All cell types were relative to the total infiltration of CD45+ expression. Identifying immune cells based on the PDAC-MGICs shows a significant variation (p-value < 0.05) in Macrophages, Neutrophils, Natural Killer cells, and Tregs cells.
Figure 5
Figure 5
The relative immune abundance in PDAC tissue samples that received neoadjuvant therapy compared to treatment naïve samples using PDAC-MGICs. Comparing the relative immune scores using mRNA expression data of 18 PDAC tissue samples of patients who receive three types of neoadjuvant therapy compared to patients who were subjected to surgery before receiving any treatment (Surgery Only). Immune cells were identified using the PDAC-GMICs set and were presented relative to the total infiltration of CD45+ expression. The treatment effect of FOLFIRINOX + SBRT treated samples is most apparent. The p-values are the result of two-sided t-tests between Surgery Only and the other treatment groups individually. Surgery only (purple); neoadjuvant FOLFIRINOX (blue), FOLFIRINOX + SBRT (green), FOLFIRINOX + XRT (yellow).

References

    1. Siegel RL, Miller KD, Jemal A. Cancer Statistics, 2019. CA Cancer J Clin (2019) 69:7–34. 10.3322/caac.21551 - DOI - PubMed
    1. Kleeff J, Korc M, Apte M, La Vecchia C, Johnson CD, Biankin AV, et al. . Pancreatic Cancer. Nat Rev Dis Primers (2016) 2:16022. 10.1038/nrdp.2016.22 - DOI - PubMed
    1. Bai X, Zhang Q, Wu S, Zhang X, Wang M, He F, et al. . Characteristics of Tumor Infiltrating Lymphocyte and Circulating Lymphocyte Repertoires in Pancreatic Cancer by the Sequencing of T Cell Receptors. Sci Rep (2015) 5:13664. 10.1038/srep13664 - DOI - PMC - PubMed
    1. Karamitopoulou E. Tumour Microenvironment of Pancreatic Cancer: Immune Landscape is Dictated by Molecular and Histopathological Features. Br J Cancer (2019) 121:5–14. 10.1038/s41416-019-0479-5 - DOI - PMC - PubMed
    1. Gooden MJM, de Bock GH, Leffers N, Daemen T, Nijman HW. The Prognostic Influence of Tumour-Infiltrating Lymphocytes in Cancer: A Systematic Review With Meta-Analysis. Br J Cancer (2011) 105:93–103. 10.1038/bjc.2011.189 - DOI - PMC - PubMed

Publication types

MeSH terms

Substances