. 2021 May 3:9:e11209.
doi: 10.7717/peerj.11209. eCollection 2021.

Lactobacillus reuteri TSR332 and Lactobacillus fermentum TSF331 stabilize serum uric acid levels and prevent hyperuricemia in rats

Affiliations

Lactobacillus reuteri TSR332 and Lactobacillus fermentum TSF331 stabilize serum uric acid levels and prevent hyperuricemia in rats

Yi-Wei Kuo et al. PeerJ. .

Abstract

Background: Uric acid (UA) is the end product of purine metabolism in the liver and is excreted by the kidneys. When purine metabolism is impaired, the serum UA level will be elevated (hyperuricemia) and eventually lead to gout. During evolution, humans and some primates have lost the gene encoding uricase, which is vital in UA metabolism. With the advances of human society, the prevalence of hyperuricemia has dramatically increased because of the refined food culture. Hyperuricemia can be controlled by drugs, such as allopurinol and probenecid. However, these drugs have no preventive effect and are associated with unpleasant side effects. An increasing number of probiotic strains, which are able to regulate host metabolism and prevent chronic diseases without harmful side effects, have been characterized. The identification of probiotic strains, which are able to exert beneficial effects on UA metabolism, will provide an alternative healthcare strategy for patients with hyperuricemia, especially for those who are allergic to anti-hyperuricemia drugs.

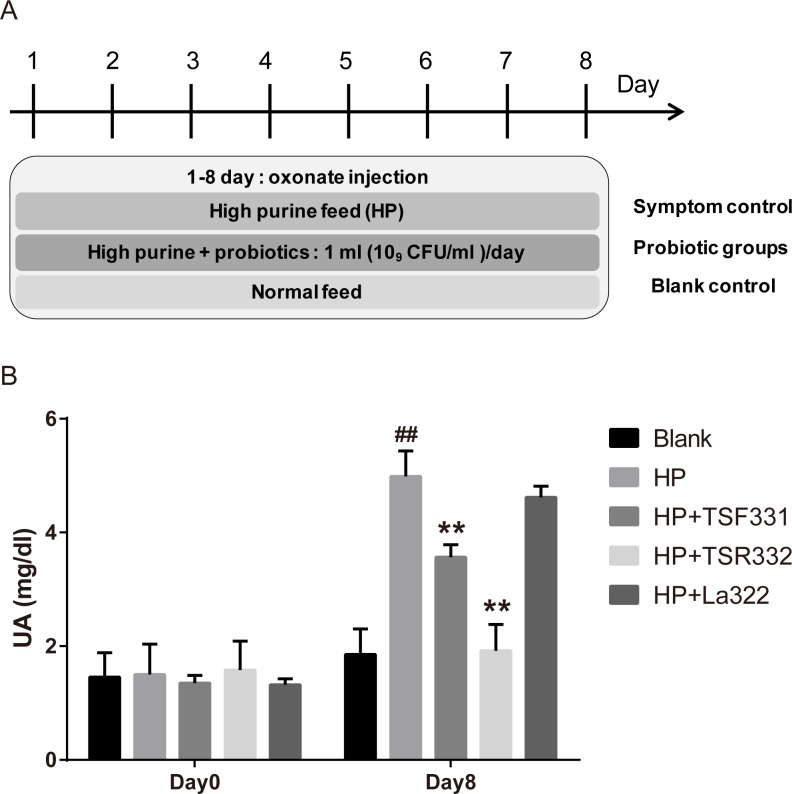
Methods: To elicit hyperuricemia, rats in the symptom control group (HP) were injected with potassium oxonate and fed a high-purine diet. Rats in the probiotic groups received the high-purine diet, oxonate injection, and supplements of probiotic strains TSR332, TSF331, or La322. Rats in the blank control group (C) received a standard diet (AIN-93G) and oxonate injection.

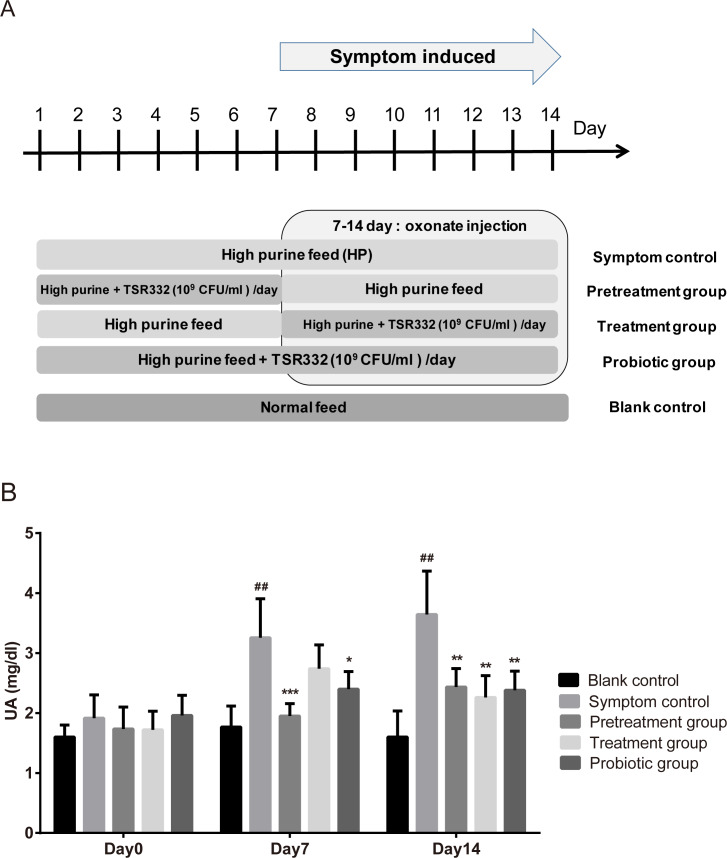
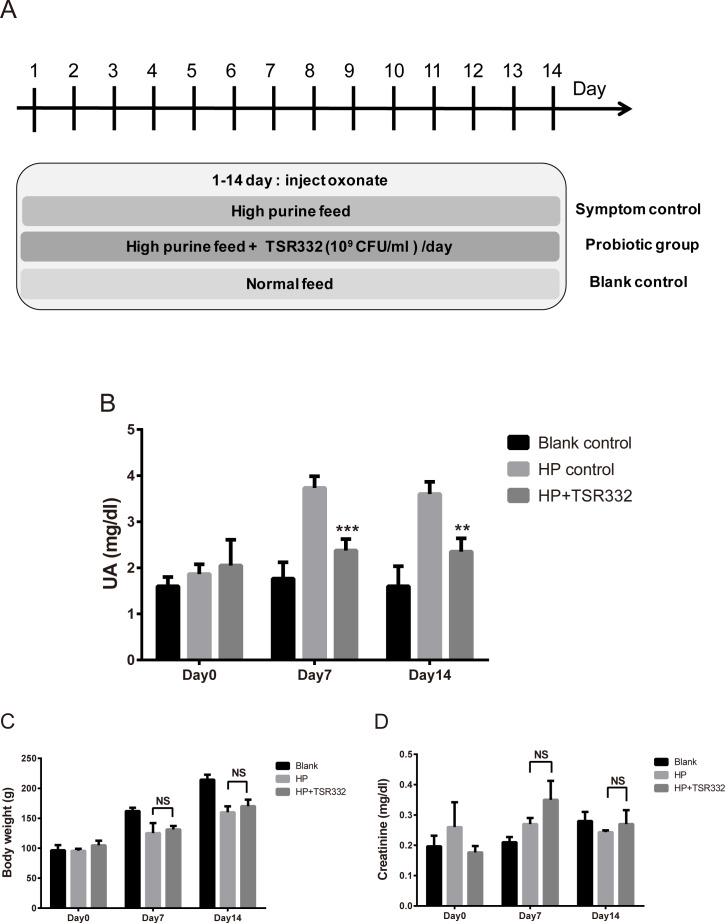
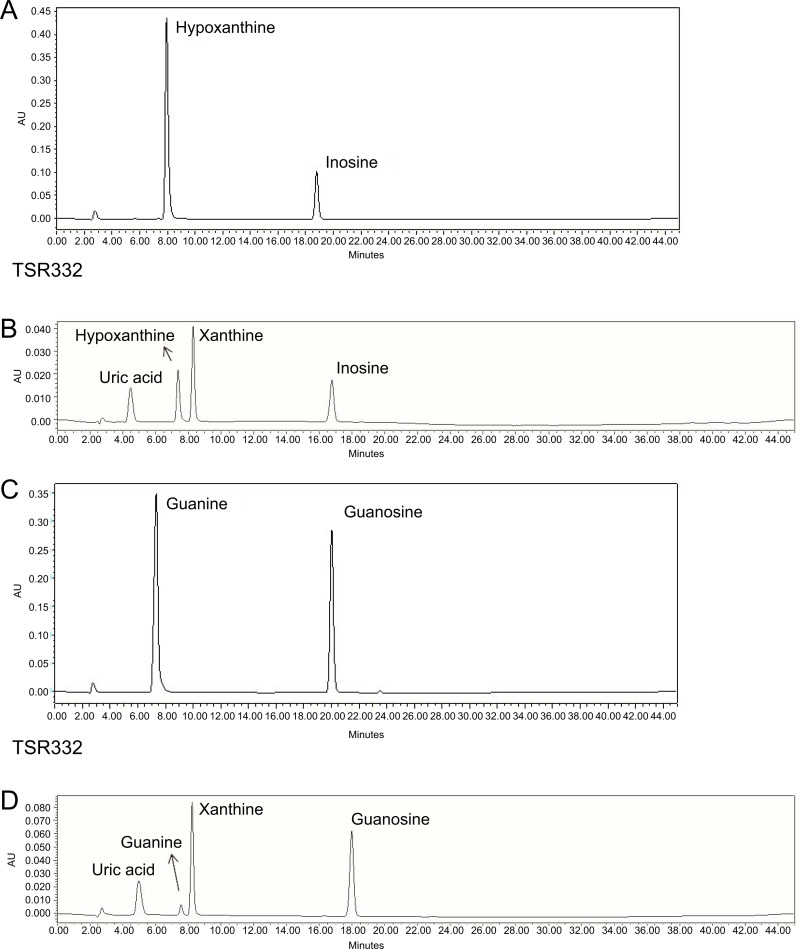
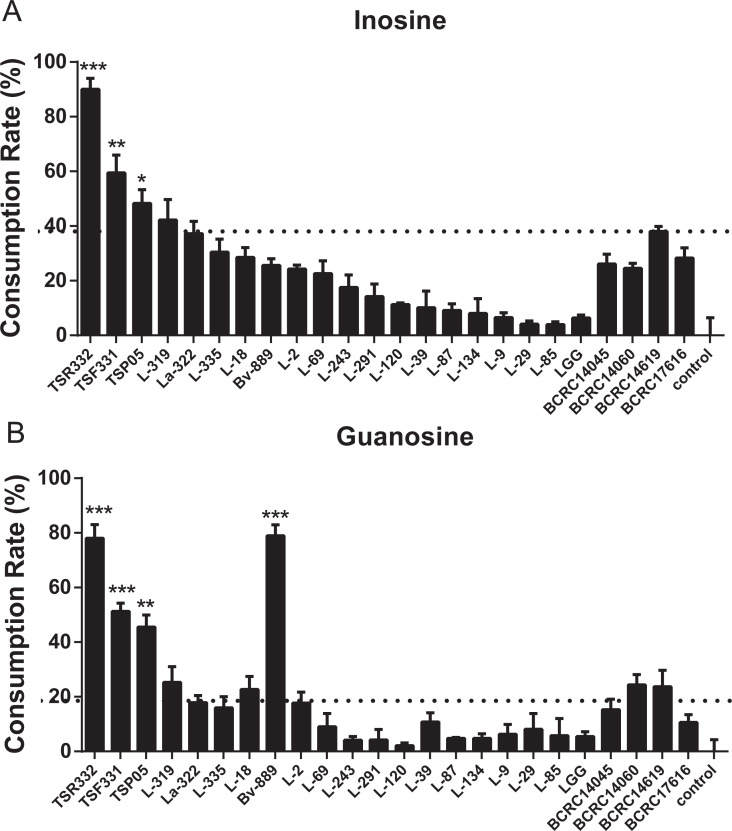
Results: Purine-utilizing strains of probiotics were screened using high-pressure liquid chromatography (HPLC) in vitro, and the lowering effect on serum UA levels was analyzed in hyperuricemia rats in vivo. We found that Lactobacillus reuteri strain TSR332 and Lactobacillus fermentum strain TSF331 displayed significantly strong assimilation of inosine (90%; p = 0.00003 and 59%; p = 0.00545, respectively) and guanosine (78%; p = 0.00012 and 51%; p = 0.00062, respectively) within 30 min in vitro. Further animal studies revealed that serum UA levels were significantly reduced by 60% (p = 0.00169) and 30% (p = 0.00912), respectively, in hyperuricemic rats treated with TSR332 and TSF331 for 8 days. Remarkably, TSR332 ameliorated the occurrence of hyperuricemia, and no evident side effects were observed. Overall, our study indicates that TSR332 and TSF331 are potential functional probiotic strains for controlling the development of hyperuricemia.

Keywords: Gout; Hyperuricemia; Lactobacillus; Probiotics; Purine metabolism.


Conflict of interest statement

Yi-Wei Kuo, Shih-Hung Hsieh, Jui-Fen Chen, Cheng-Ruei Liu, Ching-Wei Chen, Yu-Fen Huang, and Hsieh-Hsun Ho are employed by Glac Biotech Co., Ltd.

Figures

Figure 1
Figure 1. Preliminary tests of TSF331, TSR332, and La322 in hyperuricemic rats.
Five groups of Wistar rats were set up, and the rats were daily injected intraperitoneally with potassium oxonate. The blank control group was fed a regular diet, and the four other groups were fed a high-purine diet to induce hyperuricemia. Three of the hyperuricemic groups were treated with 109 CFU/ml of TSF331, TSR332 and La322, respectively, in 0.85% NaCl daily for 8 days. Blood serum was collected and tested for UA before and after treatments on days 0 and 8. Data are the mean ±  SD. ##p < 0.01 blank vs. hyperuricemic group, ∗∗p < 0.01, hyperuricemic vs. probiotics-treated group, one-way ANOVA.
Figure 2
Figure 2. Pretrestment and treatment effects of TSR332 in hyperuricemic rats.
Five groups of Wistar rats were set up and one blank control group was fed a regular diet. Four other groups were fed a high-purine diet, and the rats were daily injected intraperitoneally with potassium oxonate from day 7 to 14 to induce hyperuricemia. Three of the hyperuricemic groups were treated with 109 CFU/ml of TSR332 in 0.85% NaCl for the designated periods (days 1–7, days 7–14, or days 1–14). Blood serum was collected and tested for UA levels on days 0, 7, and 14. Data are the mean ± SD. ## p < 0.01 blank vs. hyperuricemic group, and p < 0.05, ∗∗p < 0.01, ∗∗∗p < 0.005 hyperuricemic vs. TSR332-treated group, one-way ANOVA.
Figure 3
Figure 3. UA, body weight, and kidney function in acute hyperuricemic rats.
Three groups of Wistar rats were set up, and the rats were daily injected intraperitoneally with potassium oxonate to induce uric acid production. The blank control group was fed a regular diet, and two other groups were fed a high-purine diet to induce hyperuricemia. One of the hyperuricemic groups was treated with 109 CFU/ml of TSR332 in 0.85% NaCl daily for 14 days. Body weight was measured (B), and blood serum was collected to test for (A) UA and creatinine levels on days 0, 7, and 14. Data are the mean ± SD. #p < 0.05, ##p < 0.01) blank vs. hyperuricemic group, ∗∗p < 0.01, ∗∗∗p < 0.005 hyperuricemic vs. TSR332-treated group, one-way ANOVA.
Figure 4
Figure 4. Resolution of purines and purine metabolites by HPLC analysis.
(A) Inosine degradation and hypoxanthine production within 30 min by the probiotic strain, TSR332. (B) A mixture of inosine, xanthine, hypoxanthine, and uric acid was used as the standard solution for the inosine consumption test. (C) Guanosine degradation and guanine production within 30 min by TSR332. (D) A mixture of guanosine, xanthine, guanine, and uric acid was used as the standard solution for the guanosine consumption test. Standard curves were established using 0.625 mM, 1.25 mM, and 2.5 mM solutions.
Figure 5
Figure 5. In vitro purine assimilation assays of inosine and guanosine in probiotic strains.
(A) Inosine assimilation rates in the probiotic strains within 30 min. (B) Guanosine assimilation rates in the probiotic strains within 30 min. Data are the mean ± SD. p < 0.05, ∗∗p < 0.01, ∗∗∗p < 0.001 vs. strain La322, one-way ANOVA. The dotted line represents the assimilation rate in La322.

Similar articles

Cited by

References

    1. Agudelo CA, Wise CM. Gout: diagnosis, pathogenesis, and clinical manifestations. Current Opinion in Rheumatology. 2001;13(3):234–239. doi: 10.1097/00002281-200105000-00015. - DOI - PubMed
    1. Beyl Jr RN, Hughes L, Morgan S. Update on importance of diet in gout. American Journal of Medicine. 2016;129(11):1153–1158. doi: 10.1016/j.amjmed.2016.06.040. - DOI - PubMed
    1. Brown GR. Cephalosporin-probenecid drug interactions. Clinical Pharmacokinetics. 1993;24(4):289–300. doi: 10.2165/00003088-199324040-00003. - DOI - PubMed
    1. Burnstock G. Introduction to the special issue on purinergic receptors. Advances in Experimental Medicine and Biology. 2017;1051:1–6. doi: 10.1007/5584_2017_12. - DOI - PubMed
    1. Cani PD, Delzenne NM. The role of the gut microbiota in energy metabolism and metabolic disease. Current Pharmaceutical Design. 2009;15(13):1546–1558. doi: 10.2174/138161209788168164. - DOI - PubMed