. 2021 Apr 28:9:e11273.
doi: 10.7717/peerj.11273. eCollection 2021.

Identification of a five-gene signature in association with overall survival for hepatocellular carcinoma

Affiliations

Identification of a five-gene signature in association with overall survival for hepatocellular carcinoma

Lei Yang et al. PeerJ. .

Abstract

Background: Hepatocellular carcinoma (HCC) is considered to be a malignant tumor with a high incidence and a high mortality. Accurate prognostic models are urgently needed. The present study was aimed at screening the critical genes for prognosis of HCC.

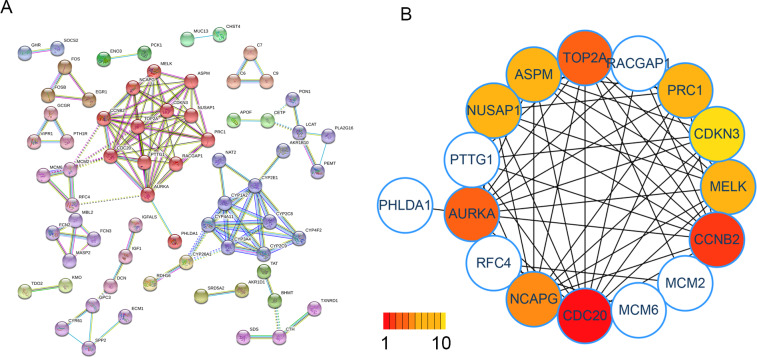
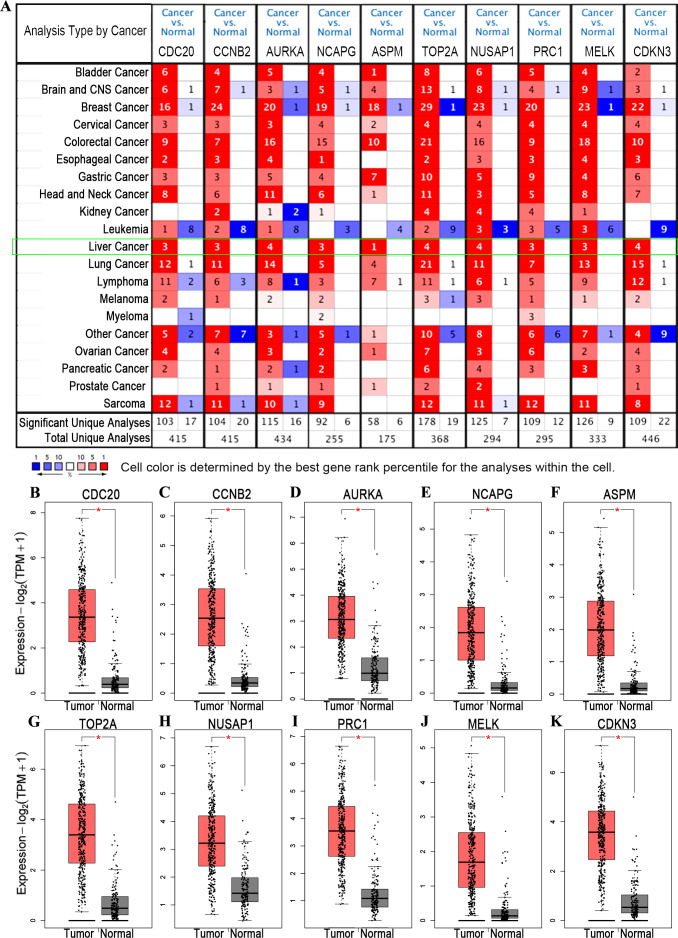
Methods: The GSE25097, GSE14520, GSE36376 and GSE76427 datasets were obtained from Gene Expression Omnibus (GEO). We used GEO2R to screen differentially expressed genes (DEGs). A protein-protein interaction network of the DEGs was constructed by Cytoscape in order to find hub genes by module analysis. The Metascape was performed to discover biological functions and pathway enrichment of DEGs. MCODE components were calculated to construct a module complex of DEGs. Then, gene set enrichment analysis (GSEA) was used for gene enrichment analysis. ONCOMINE was employed to assess the mRNA expression levels of key genes in HCC, and the survival analysis was conducted using the array from The Cancer Genome Atlas (TCGA) of HCC. Then, the LASSO Cox regression model was performed to establish and identify the prognostic gene signature. We validated the prognostic value of the gene signature in the TCGA cohort.

Results: We screened out 10 hub genes which were all up-regulated in HCC tissue. They mainly enrich in mitotic cell cycle process. The GSEA results showed that these data sets had good enrichment score and significance in the cell cycle pathway. Each candidate gene may be an indicator of prognostic factors in the development of HCC. However, hub genes expression was weekly associated with overall survival in HCC patients. LASSO Cox regression analysis validated a five-gene signature (including CDC20, CCNB2, NCAPG, ASPM and NUSAP1). These results suggest that five-gene signature model may provide clues for clinical prognostic biomarker of HCC.

Keywords: Differentially expressed genes; Functional enrichment analysis; Hepatocellular carcinoma; Prognostic analysis.


Conflict of interest statement

The authors declare there are no competing interests.

Figures

Figure 1
Figure 1. The flow chart showing our protocol for studying the mRNA prognostic characteristics of HCC.
Figure 2
Figure 2. Screening of Commonly Differentially Expressed Genes in the four hepatocellular carcinoma datasets.
(A) DEGs in GSE14520 are displayed in the volcano plot. (B) DEGs in GSE25097. (C) DEGs in GSE36376. (D) DEGs in GSE76427. Statistically significant DEGs were defined with adjusted P < 0.05 and |logFC| > 1 as the threshold value. (E) All the DEGs common to the four datasets are displayed in the Venn diagrams. (F) Up-regulated DEGs common to the four datasets. (G) Down-regulated DEGs common to the four datasets.
Figure 3
Figure 3. Prediction and identification of hub genes in HCC.
(A) A total of 142 DEGs were filtered into the PPI interaction network using the STRING online tools. Red nodes were first cluster which was created using the MCL clustering algorithm. (B) The top-10 hub genes ranked by the MCC algorithm of Cytohubba.
Figure 4
Figure 4. Gene Ontology (GO) and Kyoto Encyclopedia of Genes and Genomes (KEGG) analysis of the hub genes.
(A) Significant enrichment of GO annotation and KEGG pathway of hub genes in hepatocellular carcinoma by Metascape (P < 0.05). (B) Network of enriched terms: colored by cluster ID, where nodes that share the same cluster ID are typically close to each other. (C) Network of enriched terms: colored by p-value, where terms containing more genes tend to have a more significant p-value. (D) Protein-protein interaction network and Molecular Complex Detection (MCODE) components identified in the gene lists. (E) Visualization of GSEA results for cell cycles in GSE14520. (F) Visualization of GSEA results for cell cycles in GSE25097. (G) Visualization of GSEA results for cell cycles in GSE36376. (H) Visualization of GSEA results for cell cycles in GSE76427. NES, normalized enrichment score; FDR, adjusted p value.
Figure 5
Figure 5. Differential analysis of transcription levels of hub genes in hepatocellular carcinoma.
(A) The transcription levels of hub genes in different types of cancers. The graphs showed the numbers of datasets with statistically significant mRNA over-expression (red) or down-expression (blue) of these genes. Differences in the level of transcription of hub genes are displayed in the box plot (GEPIA) which derived from gene expression data for GEPIA comparing the expression of hub genes in HCC tissue (n = 369, pink) and normal tissues (n = 160, gray). Including (B) CDC20, (C) CCNB2, (D) AURKA, (E) NCAPG, (F) ASPM, (G) TOP2A, (H) NUSAP1, (I) PRC1, (J) MELK and (K) CDKN3. An asterisk (*) shows that p value is less than 0.01.
Figure 6
Figure 6. Kaplan–Meier analysis for ten hub genes in HCC.
Figure 6 is divided into three parts. First, overall survival (OS) curves of ten hub genes, including (A) CDC20, (B) CCNB2, (C) AURKA, (D) NCAPG, (E) ASPM, (F) TOP2A, (G) NUSAP1, (H) PRC1, (I) MELK and (J) CDKN3. Second, Progression-free survival (PFS) curves of (K) CDC20, (L) CCNB2, (M) AURKA, (N) NCAPG, (O) ASPM, (P) TOP2A, (Q) NUSAP1, (R) PRC1, (S) MELK and (T) CDKN3. Third, Relapse-free survival (RFS) curves of (U) CDC20, (V) CCNB2, (W) AURKA, (X) NCAPG, (Y) ASPM, (Z) TOP2A, (AA) NUSAP1, (BB) PRC1, (CC) MELK and (DD) CDKN3.
Figure 7
Figure 7. Kaplan–Meier analysis predicting overall survival for patients with HCC.
(A) Overall survival (OS) curves of ten hub genes in TCGA-LIHC cohort. (B) Overall survival (OS) curves of five-gene signature in TCGA-LIHC cohort. (C) The expression alteration profiles of the six genes in the TCGA-LIHC cohort. (D) Overall survival (OS) curves of five-gene signature compared the survival difference between the high-score and low-score group in TCGA-LIHC cohort. (E) Overall survival (OS) curves of five-gene signature compared the difference between the high-score and low-score group in the GSE14520 cohort.

References

    1. Ashburner M, Ball C, Blake J, Botstein D, Butler H, Cherry J, Davis A, Dolinski K, Dwight S, Eppig J, Harris M, Hill D, Issel-Tarver L, Kasarskis A, Lewis S, Matese J, Richardson J, Ringwald M, Rubin G, Sherlock G. Gene ontology: tool for the unification of biology. The Gene Ontology Consortium. Nature Genetics. 2000;25:25–29. doi: 10.1038/75556. - DOI - PMC - PubMed
    1. Bray F, Ferlay J, Soerjomataram I, Siegel R, Torre L, Jemal A. Global cancer statistics 2018: GLOBOCAN estimates of incidence and mortality worldwide for 36 cancers in 185 countries. CA: a Cancer Journal for Clinicians. 2018;68:394–424. doi: 10.3322/caac.21492. - DOI - PubMed
    1. Cao Y, Lu X, Li Y, Fu J, Li H, Li X, Chang Z, Liu S. Identification of a six-gene metabolic signature predicting overall survival for patients with lung adenocarcinoma. PeerJ. 2020;8:e10320. doi: 10.7717/peerj.10320. - DOI - PMC - PubMed
    1. Chin C, Chen S, Wu H, Ho C, Ko M, Lin C. cytoHubba: identifying hub objects and sub-networks from complex interactome. BMC Systems Biology. 2014;175:S11. doi: 10.1186/1752-0509-8-s4-s11. - DOI - PMC - PubMed
    1. Cui J, Qu Z, Harata-Lee Y, Nwe Aung T, Shen H, Wang W, Adelson D. Cell cycle, energy metabolism and DNA repair pathways in cancer cells are suppressed by compound kushen injection. BMC Cancer. 2019;19:103. doi: 10.1186/s12885-018-5230-8. - DOI - PMC - PubMed

LinkOut - more resources