. 2021 Apr 27:9:e11321.
doi: 10.7717/peerj.11321. eCollection 2021.

Identification of key genes and biological processes contributing to colitis associated dysplasia in ulcerative colitis

Affiliations

Identification of key genes and biological processes contributing to colitis associated dysplasia in ulcerative colitis

Di Zhang et al. PeerJ. .

Abstract

Background: Ulcerative colitis-associated colorectal cancer (UC-CRC) is a life-threatening complication of ulcerative colitis (UC). The mechanisms underlying UC-CRC remain to be elucidated. The purpose of this study was to explore the key genes and biological processes contributing to colitis-associated dysplasia (CAD) or carcinogenesis in UC via database mining, thus offering opportunities for early prediction and intervention of UC-CRC.

Methods: Microarray datasets (GSE47908 and GSE87466) were downloaded from Gene Expression Omnibus (GEO). Differentially expressed genes (DEGs) between groups of GSE47908 were identified using the "limma" R package. Weighted gene co-expression network analysis (WGCNA) based on DEGs between the CAD and control groups was conducted subsequently. Functional enrichment analysis was performed, and hub genes of selected modules were identified using the "clusterProfiler" R package. Single-gene gene set enrichment analysis (GSEA) was conducted to predict significant biological processes and pathways associated with the specified gene.

Results: Six functional modules were identified based on 4929 DEGs. Green and blue modules were selected because of their consistent correlation with UC and CAD, and the highest correlation coefficient with the progress of UC-associated carcinogenesis. Functional enrichment analysis revealed that genes of these two modules were significantly enriched in biological processes, including mitochondrial dysfunction, cell-cell junction, and immune responses. However, GSEA based on differential expression analysis between sporadic colorectal cancer (CRC) and normal controls from The Cancer Genome Atlas (TCGA) indicated that mitochondrial dysfunction may not be the major carcinogenic mechanism underlying sporadic CRC. Thirteen hub genes (SLC25A3, ACO2, AIFM1, ATP5A1, DLD, TFE3, UQCRC1, ADIPOR2, SLC35D1, TOR1AIP1, PRR5L, ATOX1, and DTX3) were identified. Their expression trends were validated in UC patients of GSE87466, and their potential carcinogenic effects in UC were supported by their known functions and other relevant studies reported in the literature. Single-gene GSEA indicated that biological processes and Kyoto Encyclopedia of Genes and Genomes (KEGG) pathways related to angiogenesis and immune response were positively correlated with the upregulation of TFE3, whereas those related to mitochondrial function and energy metabolism were negatively correlated with the upregulation of TFE3.

Conclusions: Using WGCNA, this study found two gene modules that were significantly correlated with CAD, of which 13 hub genes were identified as the potential key genes. The critical biological processes in which the genes of these two modules were significantly enriched include mitochondrial dysfunction, cell-cell junction, and immune responses. TFE3, a transcription factor related to mitochondrial function and cancers, may play a central role in UC-associated carcinogenesis.

Keywords: Colitis associated dysplasia; Ulcerative colitis; Ulcerative colitis associated colorectal cancer; Weighted gene co-expression network analysis.


Conflict of interest statement

The authors declare there are no competing interests.

Figures

Figure 1
Figure 1. Overview of the work flow and GEO data.
(A) Flow chart of the present study; (B) Principal component analysis plot of the gene expression profiles in GSE47908. Two principal components containing 37.23% of the variance illustrate separate clustering of the three group of samples; (C) Principal component analysis plot of the gene expression profiles in GSE87466. It shows the separate clustering of the two groups with a few samples overlapping by two principal component containing 31.81% of the variance.
Figure 2
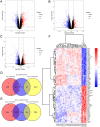
Figure 2. Differential expression analysis.
(A) Volcano plot between UC and control groups. There are 679 up-regulated genes and 288 down-regulated genes in UC compared to controls when log2FC cut-off value was set to 1.092 by calculated. (B) Volcano plot between CAD and UC groups. There are 260 up-regulated genes and 616 down-regulated genes in CAD compared to UC when log2FC cut-off value was set to 1.073 by calculated. (C) Volcano plot between CAD and control groups. Black vertical line indicates log2FC of 0.804, and grey vertical indicates log2FC of 0.3. There are 305 up-regulated genes and 462 down-regulated genes in CAD compared to controls when log2FC cut-off value was set to 0.804, 2904 up-regulated genes and 2025 down-regulated genes when log2FC cut-off value was set to 0.3. (D) Venn diagram illustrating up-regulated genes in different groups. (E) Venn diagram illustrating down-regulated genes in different groups. (F) Heat map of top 40 up-regulated and 40 down-regulated DEGs between CAD and controls after sorted by adjusted p-value from smallest to largest.
Figure 3
Figure 3. Weighted gene co-expression network analysis.
(A) Network topology for different soft-thresholding powers. The scale-free topology can be attained at the soft-thresholding power of 12. (B) Cluster dendrogram and gene modules identified by WGCNA. (C) Correlation heat map of gene modules and traits, labelled with correlation coefficient and p value. The trait “Progress” means the progressive process from normal to UC, and then to CAD, which is assigned the value of 0, 1 and 2, to represent the control, UC and CAD group, respectively.
Figure 4
Figure 4. GO-BP and KEGG pathways enrichment analysis.
(A) Biological processes enriched in green module genes. (B) KEGG pathways enriched in green module genes. (C) Biological processes enriched in blue module genes. (D) KEGG pathways enriched in blue module genes.
Figure 5
Figure 5. Hub genes of green and blue modules.
(A) Identification of hub genes of green module by MM and GS filtering. (B) Differential expression patterns of seven hub genes of green module. (C) Identification of hub genes of blue module by MM and GS filtering. (D) Differential expression patterns of six hub genes of blue module.
Figure 6
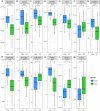
Figure 6. (A–M) Validation of the expression change of hub genes in UC from GSE87466.
Figure 7
Figure 7. Single-gene GSEA analysis of TFE3.
(A) Enriched biological processes of genes positively correlated with TFE3. (B) Enriched biological processes of genes negatively correlated with TFE3. (C) Enriched KEGG pathways positively correlated with TFE3. (D) Enriched KEGG pathways negatively correlated with TFE3.

Similar articles

Cited by

References

    1. Beckmann H, Su LK, Kadesch T. TFE3: a helix-loop-helix protein that activates transcription through the immunoglobulin enhancer muE3 motif. Genes and Development. 1990;4:167–179. doi: 10.1101/gad.4.2.167. - DOI - PubMed
    1. Bernstein CN, Blanchard JF, Kliewer E, Wajda A. Cancer risk in patients with inflammatory bowel disease: a population-based study. Cancer. 2001;91:854–862. doi: 10.1002/1097-0142(20010215)91:4<854::AID-CNCR1073>3.0.CO;2-Z. - DOI - PubMed
    1. Bjerrum JT, Nielsen OH, Riis LB, Pittet V, Mueller C, Rogler G, Olsen J. Transcriptional analysis of left-sided colitis, pancolitis, and ulcerative colitis-associated dysplasia. Inflammatory Bowel Diseases. 2014;20:2340–2352. doi: 10.1097/MIB.0000000000000235. - DOI - PubMed
    1. Bopanna S, Ananthakrishnan AN, Kedia S, Yajnik V, Ahuja V. Risk of colorectal cancer in Asian patients with ulcerative colitis: a systematic review and meta-analysis. The Lancet Gastroenterology and Hepatology. 2017;2:269–276. doi: 10.1016/S2468-1253(17)30004-3. - DOI - PMC - PubMed
    1. Bruggemann M, Gromes A, Poss M, Schmidt D, Klumper N, Tolkach Y, Dietrich D, Kristiansen G, Muller SC, Ellinger J. Systematic analysis of the expression of the mitochondrial ATP synthase (Complex V) subunits in clear cell renal cell carcinoma. Translational Oncology. 2017;10:661–668. doi: 10.1016/j.tranon.2017.06.002. - DOI - PMC - PubMed

LinkOut - more resources