. 2021 May 3;3(2):lqab035.
doi: 10.1093/nargab/lqab035. eCollection 2021 Jun.

Wavelet Screening identifies regions highly enriched for differentially methylated loci for orofacial clefts

Affiliations

Wavelet Screening identifies regions highly enriched for differentially methylated loci for orofacial clefts

William R P Denault et al. NAR Genom Bioinform. .

Abstract

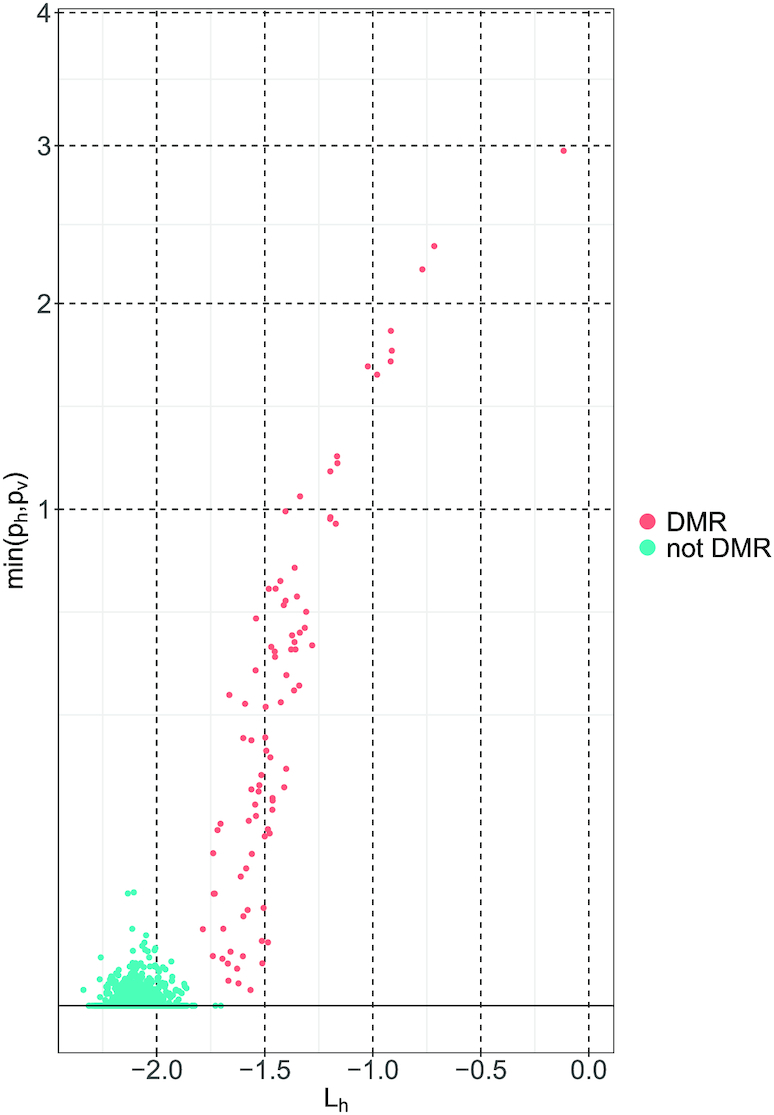
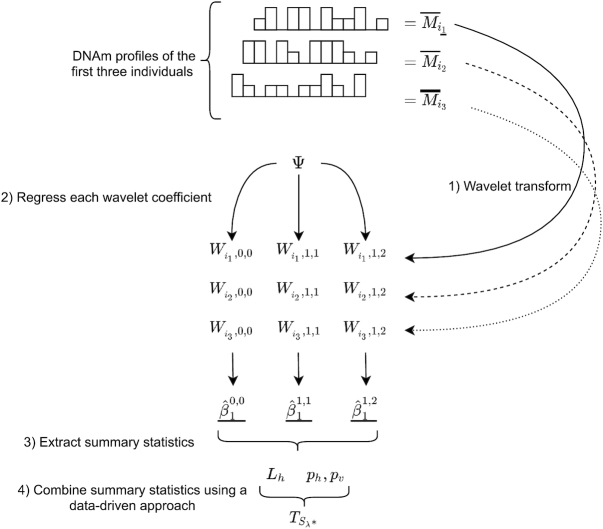
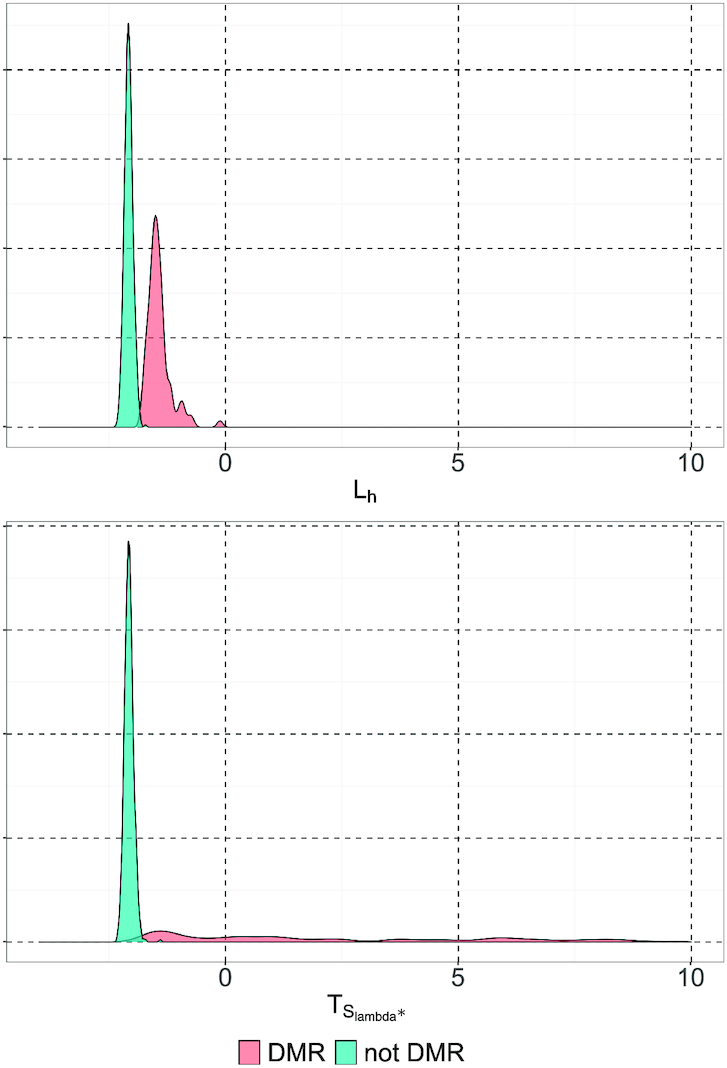
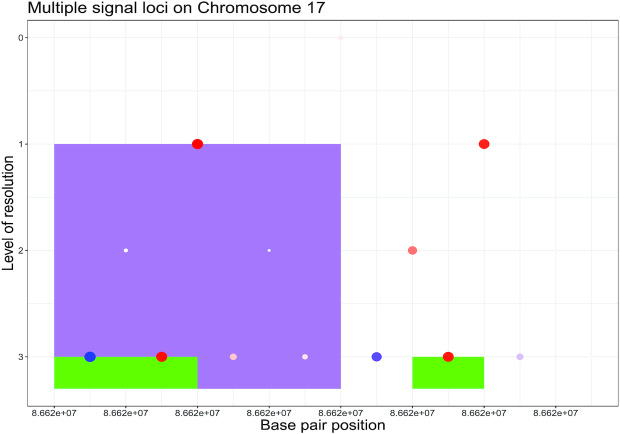
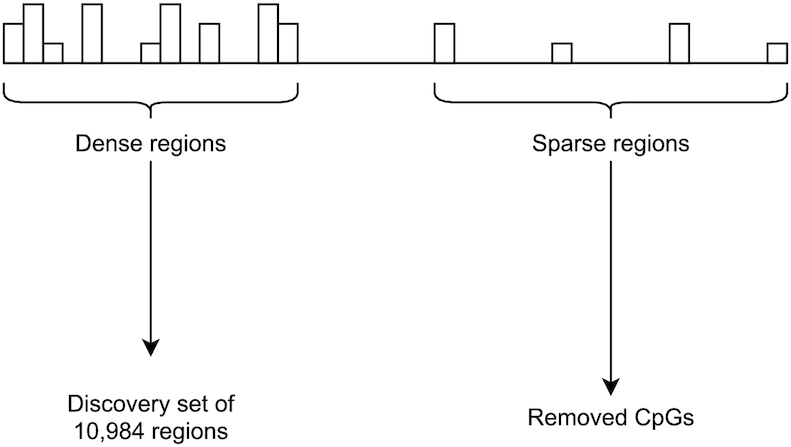
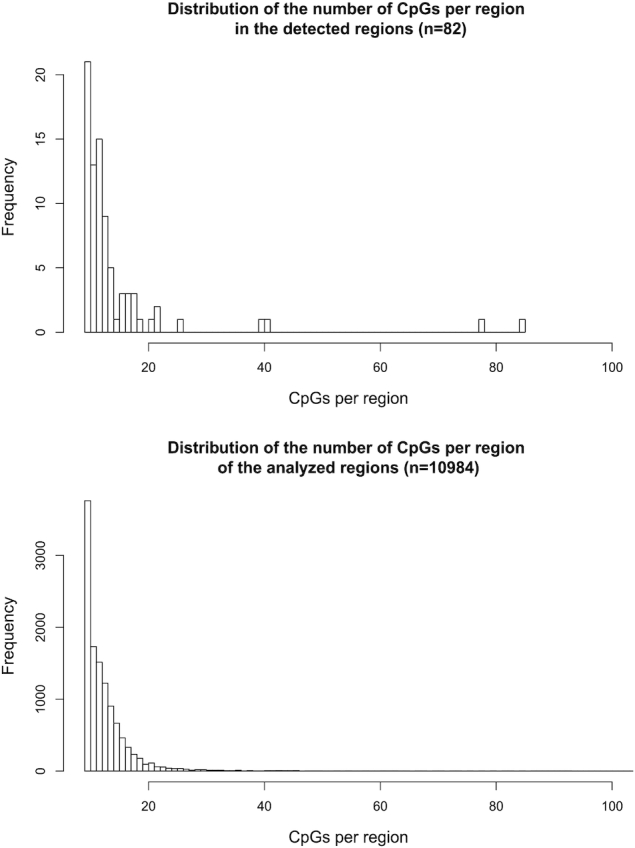
DNA methylation is the most widely studied epigenetic mark in humans and plays an essential role in normal biological processes as well as in disease development. More focus has recently been placed on understanding functional aspects of methylation, prompting the development of methods to investigate the relationship between heterogeneity in methylation patterns and disease risk. However, most of these methods are limited in that they use simplified models that may rely on arbitrarily chosen parameters, they can only detect differentially methylated regions (DMRs) one at a time, or they are computationally intensive. To address these shortcomings, we present a wavelet-based method called 'Wavelet Screening' (WS) that can perform an epigenome-wide association study (EWAS) of thousands of individuals on a single CPU in only a matter of hours. By detecting multiple DMRs located near each other, WS identifies more complex patterns that can differentiate between different methylation profiles. We performed an extensive set of simulations to demonstrate the robustness and high power of WS, before applying it to a previously published EWAS dataset of orofacial clefts (OFCs). WS identified 82 associated regions containing several known genes and loci for OFCs, while other findings are novel and warrant replication in other OFCs cohorts.


Figures

Figure 1.
Figure 1.
Bivariate plot of Lh (x-axis) and min (ph, pformula image) (y-axis). Each dot corresponds to a DNA region. The y-axis is square-root transformed to make is easier to see small values of min (ph, pformula image). The displayed observations were generated using the simulated dataset in the paper by Lee and Morris (16).
Figure 2.
Figure 2.
A schematic overview of WS. The upper part of the figure represents the DNAm profiles of three randomly selected individuals for illustration purposes. The curved arrows represent the corresponding wavelet transformations. The bottom diagram represents the modeling of each wavelet coefficient. Each of these steps (1–4) is explained in greater detail in the main text.
Figure 3.
Figure 3.
Distribution of the test statistic formula image. The observations displayed here were generated using the simulated dataset from the Lee and Morris paper (16). The upper panel shows the distribution of Lh (λ = 0). The lower panel shows the distribution of formula image (λ = 15).
Figure 4.
Figure 4.
Region containing multiple subregions associated with OFCs. The differently colored rectangles highlight the regions with non-thresholded formula image. The dots represent the estimated formula image, with the size of a dot being proportional to its absolute value. Different colors are used to indicate the sign of formula image (blue for negative, red for positive). formula image close to zero are shown in white within a colored rectangle.
Figure 5.
Figure 5.
Overview of the selection of DNAm regions.
Figure 6.
Figure 6.
Distribution of the number of CpGs per region for the 82 associated regions (upper panel) and for a total of 10 984 analyzed regions (the discovery set; lower panel).
Figure 7.
Figure 7.
Schematic overview of the over-representation analysis. The left panel displays the expected overlap between a set of annotated genes and the genes associated with OFCs. The right panel displays an over-represented annotated set of genes for OFCs.

Similar articles

References

    1. Yong W.-S., Hsu F.-M., Chen P.-Y.. Profiling genome-wide DNA methylation. Epigenet. Chromatin. 2016; 9:26. - PMC - PubMed
    1. Lovkvist C., Dodd I. B., Sneppen K., Haerter J. O.. DNA methylation in human epigenomes depends on local topology of CpG sites. Nucleic Acids Res. 2016; 44:5123–5132. - PMC - PubMed
    1. Jaffe A.E., Murakami P., Lee H., Leek J.T., Fallin M.D., Feinberg A.P., Irizarry R.A.. Bump hunting to identify differentially methylated regions in epigenetic epidemiology studies. Int. J. Epidemiol. 2012; 41:200–209. - PMC - PubMed
    1. Lunnon K., Smith R., Hannon E., De Jager P.L., Srivastava G., Volta M., Troakes C., Al-Sarraj S., Burrage J., Macdonald R.et al. .. Methylomic profiling implicates cortical deregulation of ANK1 in Alzheimer’s disease. Nat. Neurosci. 2014; 17:1164–1170. - PMC - PubMed
    1. Martorell-Marugán J., González-Rumayor V., Carmona-Sáez P.. mCSEA: detecting subtle differentially methylated regions. Bioinformatics. 2019; 35:3257–3262. - PubMed

LinkOut - more resources