. 2021 Jul 5;218(7):e20201413.
doi: 10.1084/jem.20201413. Epub 2021 May 14.

Upregulation of VCAM-1 in lymphatic collectors supports dendritic cell entry and rapid migration to lymph nodes in inflammation

Affiliations

Upregulation of VCAM-1 in lymphatic collectors supports dendritic cell entry and rapid migration to lymph nodes in inflammation

Jorge Arasa et al. J Exp Med. .

Abstract

Dendritic cell (DC) migration to draining lymph nodes (dLNs) is a slow process that is believed to begin with DCs approaching and entering into afferent lymphatic capillaries. From capillaries, DCs slowly crawl into lymphatic collectors, where lymph flow induced by collector contraction supports DC detachment and thereafter rapid, passive transport to dLNs. Performing a transcriptomics analysis of dermal endothelial cells, we found that inflammation induces the degradation of the basement membrane (BM) surrounding lymphatic collectors and preferential up-regulation of the DC trafficking molecule VCAM-1 in collectors. In crawl-in experiments performed in ear skin explants, DCs entered collectors in a CCR7- and β1 integrin-dependent manner. In vivo, loss of β1-integrins in DCs or of VCAM-1 in lymphatic collectors had the greatest impact on DC migration to dLNs at early time points when migration kinetics favor the accumulation of rapidly migrating collector DCs rather than slower capillary DCs. Taken together, our findings identify collector entry as a critical mechanism enabling rapid DC migration to dLNs in inflammation.


Conflict of interest statement

Disclosures: The authors declare no competing interests exist.

Figures

None
Graphical abstract
Figure 1.
Figure 1.
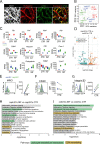
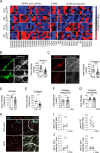
RNA sequencing of LECs derived from lymphatic capillaries and collectors and BECs isolated from murine skin. (A) Representative whole-mount images of steady-state mouse ear skin showing dermal blood vessels (CD31+podoLYVE-1), lymphatic collectors (CD31+podo+LYVE-1; white arrows) and lymphatic capillaries (CD31+podo+LYVE-1+; yellow arrows). Scale bar, 50 µm. (B) Principal component analysis of capLECs, colLECs, and BECs from CTR and INF conditions (n = 5 experimental replicates). (C) Reads per kilobase per million mapped reads (RPKM) plots of vascular marker genes. Box shows median, 25%, and 75% percentile; whiskers show minimum and maximum. (D) Volcano plot of capLECs versus colLECs in steady-state (CTR) conditions (0.5-fold change; P value, 0.05). (E–G) FACS was performed on CTR skin single-cell suspensions following the gating scheme in Fig. S2 A. Analysis of MRC1 (E), ESAM (F), and ITGB3 (G). Representative FACS plots and ΔMFI of three independent experiments are shown. (H and I) Identification of specific differentially regulated pathways in CTR versus INF capLECs (H) and colLECs (I). MetaCore Process network 1.5-fold change; P value, 0.05; deregulated pathways. Max, maximum; MFI, median fluorescent intensity.
Figure S1.
Figure S1.
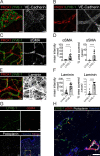
Characterization of dermal lymphatic LYVE-1+ capillaries and LYVE-1 collectors. (A–F) Mouse ear skin whole-mounts were analyzed by immunofluorescence to validate the suitability of LYVE-1 as a marker for differentiating between lymphatic capillaries and collectors. In contrast to dermal lymphatic LYVE-1 collectors, dermal lymphatic LYVE-1+ capillaries are characterized by VE-cadherin+ button-like cell–cell junctions (A and B), the absence of smooth muscle cell coverage (C and D), and a thin BM (E and F). Scale bars in A–C and E, 50 µm. Representative images from three to five experiments are shown. Quantifications of αSMA (D) and laminin (n = pooled whole-mount data from 3–5 mice per condition; G). (G and H) Presence of αSMA-covered collectors in human skin. Immunofluorescence staining for αSMA, podoplanin (podo), LYVE-1, and Hoechst was performed in healthy human skin. The yellow box in G highlights the enlarged region shown in H. Orange arrow, podo+ LYVE-1+ αSMA capillary; yellow arrow, podo+ LYVE-1 αSMA+ collector. Scale bars, 100 µm (overview) and 50 µm (zoomed-in image). Images obtained in one out of three different skin biopsies analyzed are shown. (D and F) Unpaired Mann–Whitney test. ****, P < 0.0001.
Figure S2.
Figure S2.
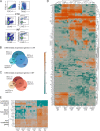
Sequencing results of capLECs, colLECs, and BECs derived from control and CHS-inflamed skin. (A) Gating strategy used for FACS sorting of singlet, 7AAD capLECs (CD45CD31+podo+LYVE-1+), colLECs (CD45CD31+podo+LYVE-1), and BECs (CD45CD31+podo LYVE-1). (B and C) Euler diagrams showing number of differentially expressed genes (0.5-fold; P value, 0.05) in BECs versus colLECs/BECs versus capLECs/colLECs versus capLECs in CTR skin (B) and in INF skin (C). (D) Sample clustering of capLECs, colLECs, and BECs from INF and CTR mice showing the top 100 most variable genes. (E) Heatmap showing lymphatic, blood, and pan-endothelial genes in capLECs, colLECs, and BECs from INF and CTR mice (n = 5 experimental replicates). FSC-A, forward scatter area; FSC-H, forward scatter height; podo, podoplanin; SSC-A, side scatter area.
Figure 2.
Figure 2.
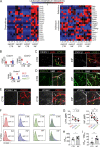
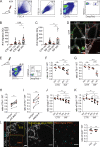
Collector-specific expression of adhesion molecules and chemokines in inflamed lymphatic collectors. (A) Heatmaps of adhesion molecule and chemokine genes involved in leukocyte migration. (B) Reads per kilobase per million mapped reads (RPKM) plots of Cx3cl1, Cxcl12, and Vcam1 in steady-state (CTR) and INF BECs, colLECs, and capLECs. Box shows median, 25%, and 75% percentile; whiskers show minimum and maximum. Representative whole-mount images showing differential expression of (C) CX3CL1, (D) CXCL12, and (E) VCAM-1 in lymphatic vessels in CTR and INF murine ear skin (n = 3 mice per condition). In the case of VCAM-1 (E), the corresponding isotype staining is shown. (C–E) White arrows indicate collectors, yellow arrows capillaries. Scale bars, 50 µm. (F–I) Analysis of VCAM-1 expression in single-cell suspensions generated from CTR and INF murine ear skin. (F) Representative FACS plots showing VCAM-1 expression in capLECs (CD45CD31+podo+LYVE-1+), colLECs (CD45CD31+podo+LYVE-1), and BECs (CD45CD31+podoLYVE-1) under CTR and INF conditions. Shaded histogram, VCAM-1; empty histogram, isotype control. (G) Summary of the delta median fluorescent intensities (ΔMFI: specific-isotype staining) from all experiments performed under CTR (n = 5 mice) or INF (n = 7 mice) conditions. Measurements from the same sample are connected by a line. (H) Summary of MFIs measured for colLECs in CTR or INF samples. (I) Summary of the ΔMFIs measured per experiment between colLECs and capLECs. (G–I) Paired one-way ANOVA with Geisser–Greenhouse correction (G) and unpaired Student’s t test (H and I); *, P < 0.05; **, P < 0.01. cap, capillaries; col, collectors; Max, maximum; podo, podoplanin.
Figure S3.
Figure S3.
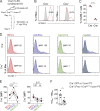
Analysis of CCL21 in murine ear skin and of ICAM-1, VCAM-1, laminin, and fibrillar collagen expression in ear skin explants. (A) Representative whole-mount picture of uninflamed murine ear skin showing intracellular and extracellular CCL21 protein levels (white) in CD31+ (red) LYVE-1+ (green) capillaries and CD31+LYVE-1 collectors. Scale bar, 100 µm. (B) Quantitative PCR analysis of Ccl21 was performed on RNA isolated from FACS-sorted endothelial cells derived from CTR and INF murine ear skin. The same gating scheme as in Fig. S2 A was used for cell isolation (n = 3 experiments; two mice per condition were pooled). (C–K) FACS analysis of ICAM-1 and VCAM-1 expression in single-cell suspensions of freshly isolated CTR ear skin or upon ear skin incubation for 4 h in medium. (C) Depiction of the gating scheme used to identify singlet, live (ZombieAqua) capLECs (CD45 CD31+ podo+ LYVE-1+), colLECs (CD45 CD31+ podo+ LYVE-1), and BECs (CD45 CD31+ podo LYVE-1). (D and E) Representative FACS plots of ICAM-1 expression (shaded histogram) at 0 h (CTR; D) or after 4 h (E) of incubation. (F and G) Representative FACS plots of VCAM-1 expression at 0 h (CTR; F) and after 4 h (G) of incubation. Shaded histogram, VCAM-1; empty histogram, isotype control. (H and I) Quantification of the delta median fluorescent intensities (ΔMFI: specific-isotype staining) of the experiments performed in F and G. Measurements deriving from the same explant are connected by a line. (J) Summary of MFIs measured for colLECs at time 0 (CTR) and after 4 h of incubation. (K) Summary of the ΔMFIs measured per experiment between colLECs and capLECs. Each dot represents the value from one experiment. (H and I) Paired one-way ANOVA with the Geisser–Greenhouse correction. (J and K) unpaired Student’s t test. *, P < 0.05. cap, capillaries; col, collectors; FSC-A, forward scatter area; FSC-H, forward scatter height; Max, maximum; podo, podoplanin; SSC-A, side scatter area.
Figure 3.
Figure 3.
DC entry into lymphatic collectors depends on CCR7, talin1, and integrin β1. (A and B) Ears were split along the cartilage and dorsal and ventral whole-mounts stained for CD31 and LYVE-1. (A) Experimental setup. (B) Image of the vascular network at the rim and the center of the dorsal and ventral ear skin. (C and D) Crawl-in experiments: dorsal ear skins were prestained with fluorescent anti-CD31 and anti–LYVE-1 and incubated with LPS-matured DCs and imaged at the indicted time points. Pictures in D were taken in highlighted areas of C. The yellow arrow in C shows where the first sequence of Video 5 was recorded. Representative pictures from five experiments are shown in B–D. (E–K) 1:1 mixtures of fluorescently labeled WT and KO DCs (CCR7−/−, Tln1−/−, or Itgb1−/−) were incubated on dorsal ears skin explants for 4 h. Explants were stained for CD31 and LYVE-1 before analysis. (E–J) Representative images (E, G, and I) and and corresponding quantifications (F, H, and J) of KO:WT DC ratios in capillaries (cap) and collectors (col). (K) Quantification of the ratio of DCs attached to the abluminal side (see yellow arrows in I for Itgb1−/− DCs) over total DCs colocalizing (i.e., inside or outside) with the collector. Each dot represents the ratio from one explant (n = 4–10 explants per condition). Ratios from the same explant in F, H, J, and K are connected by a line. Statistical significances either compare with the normalized input ratio of 1 or between the groups (connected by lines). Scale bars, 100 µm (in B and C), and 50 µm (in D, E, G, and I). (F, H, J, and K) Paired Student’s t test. *, P < 0.05; **, P < 0.01; and ****, P < 0.0001.
Figure S4.
Figure S4.
DC adhesion, transmigration, and crawling on lymphatic endothelial monolayers is integrin α4β1/VCAM-1 dependent. In vitro functional assays were performed on inflamed imLEC monolayers. (A–C) Representative FACS plots of imLECs showing ICAM-1 and VCAM-1 expression (red lines) in comparison to isotype control (gray shading). Analysis of adhesion (B) and transmigration (C) of Tln1−/− DCs as compared with WT DCs. (D) Analysis of the speed of Tln1−/− and WT DCs. Analysis of adhesion (E) and transmigration (F) of Itgb1−/− DCs as compared with WT DCs. (G) Analysis of the speed of Itgb1−/− and WT DCs. Analysis of adhesion (H) and transmigration (I) of WT DCs after treatment with 10 µg/ml anti–ICAM-1, 25 µg/ml anti–VCAM-1, or 10 µg/ml anti–integrin α4 as compared with treatment with the corresponding isotype control. (B, C, E, F, H, and I) Pooled data from three independent experiments are shown. (J) Speed of WT DCs in the presence of 25 µg/ml anti–VCAM-1 or isotype control. (D, G, and J) One representative out of three similar experiments is shown. Each dot represents a single cell. Red line represents the mean. (B–G and J) Unpaired Student’s t test. (H and I) Unpaired one-way ANOVA followed by Tukey post hoc test. *, P < 0.05; **, P < 0.01; ***, P < 0.001; and ****, P < 0.0001. FSC-A, forward scatter area; Max, maximum; SSC-A, side scatter area.
Figure 4.
Figure 4.
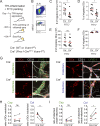
BM degradation and ECM remodeling enhance DC migration. (A) Heatmap of genes involved in BM and ECM remodeling. (B and C) Levels of laminin expression and of fibrillar collagen (SHG signal) were analyzed around collectors in CTR and INF ear skin. Representative whole-mount images of PROX1+ lymphatic collectors and corresponding quantifications are shown in B for laminin (scale bar, 50 µm) and C for fibrillar collagen (scale bar, 10 µm). (D and E) Laminin and fibrillar collagen were quantified in ear skin explants at 0 (CTR) and after 4 h of incubation. (F and G) Ear skin explants were incubated with TNFα and IFNγ in the presence or absence of PRN. 24 h later, fibrillar collagen levels were quantified (F) around lymphatic collectors and (G) in the tissue. (B–G) Pooled data from three whole-mounts per condition in three independent experiments. (H–J) Ear skin explants were incubated for 4 h with or without PRN before adding 1:1 mixtures of fluorescent WT and Itgb1−/−-deficient DCs for 4 h. (H) Representative images showing WT and Itgb1-/KO DCs in capillaries and collectors at the end of the experiment. (I and J) Quantification of the impact of PRN treatment on the ratio of DCs inside the vessel, in comparison to all DCs in per image. Results for WT DCs (I) and Itgb1−/− DCs (J). Left: Capillaries (cap). Right: Collectors (col). Each dot represents the average from one experiment (n = 4 experiments with one or two explants/condition/experiment). Ratios from the same experiment are connected by a line. Scale bars, 50 µm (B, C, and H). (B–F) Unpaired Student’s t test. (H and I) Paired Student’s t test. *, P < 0.05; **, P < 0.01; ***, P < 0.001; and ****, P < 0.0001.
Figure 5.
Figure 5.
Rapid DC migration from inflamed skin to dLNs is integrin β1 dependent. (A–C) Fluorescently labeled WT DCs were injected into INF or CTR mouse ear skin and footpads. DC numbers in dLNs were quantified by FACS at different time points after transfer. (A) Gating scheme. Numbers in graphs show percentage of parent. (B and C) FACS-based quantification of DCs in ear-draining auricular LNs (B) and footpad-draining popliteal LNs (C). Each dot represents the value from one dLN. (D) Representative whole-mounts prepared 5 h after DC injection. Scale bar, 50 µm. (E–K) 1:1 ratios of differently labeled (F–I) WT and Tln−/− DCs (F–I) or WT and Itgb1−/− DCs (J and K) were injected into CTR and INF mouse ear skin or footpads and the DC ratio quantified in the dLNs at different time points after transfer. (E) Representative FACS plots of an ear-draining auricular LN 17 h after DC transfer. (F and G) Analysis of Tln1−/−:WT DC ratios in auricular LNs (F) and popliteal LNs (G). (H and I) Impact of anti–VCAM-1 (H) or anti–integrin α4 (I) treatment on the ratio Tln1−/−:WT DCs recovered from LNs draining inflamed ears or footpads at 14–17 h after DC transfer. (J and K) Analysis of Itgb1−/−:WT DC ratios in footpad-draining popliteal LNs (J) and ear-draining auricular LNs (K). Each dot in F, G, J, and K represents the DC ratio quantified in one dLN of three or four experiments. Each dot in H and I represents the average ratio obtained in 7 or 10 experiments (with 1–3 mice per condition/experiment). Ratios from the same experiment are connected with a line. (L) 1:1 ratios of fluorescent WT and Itgb1−/− DCs were injected into INF mouse footpads and DC ratios quantified in popliteal dLNs 17 h after transfer. Left: Representative picture of a popliteal LN sections at the time of analysis. Middle: Zoom-ins of the subcapsular sinus (SCS) and parenchyma (PAR) areas. All scale bars, 100 µm. Right: Quantification of the Itgb1−/−:WT DC ratios in the respective area. Each dot represents the ratio in 1 LN (analysis of 5–10 images/LN) of three experiments (two LNs per experiment). Statistical significances either compare with the normalized input ratio of 1 or between the groups. (B, C, F, G, and H–L) Unpaired one-way ANOVA followed by Tukey post hoc test (B, C, F, G, J, and K), paired Student’s t test (H and I), or unpaired Student’s t test (L). *, P < 0.05; **, P < 0.01; ***, P < 0.001; and ****, P < 0.0001. FSC-A, forward scatter area; SSC-A, side scatter area.
Figure S5.
Figure S5.
Confirmation of the LEC-specific loss of VCAM-1 in Prox1-CreERT2 Vcam1fl/fl mice. (A) LEC-specific deletion of VCAM-1 was induced in Prox1-CreERT2 Vcam1fl/fl mice by i.p. administration of tamoxifen. (B and C) Deletion of VCAM-1 was confirmed by analyzing VCAM-1 expression in IFNγ- and TNFα-stimulated primary LECs isolated from tail skin of tamoxifen-treated Cre+ (Prox1-CreERT2 Vcam1fl/fl) or Cre control mice (WT or Vcam1fl/fl). Representative FACS plots with respective percentages of VCAM-1+ cells are shown in B. Isotype control is shown as a gray shaded histogram. Quantification of percentage of VCAM-1+ cells is presented in C. Data from three experiments are shown. (D and E) FACS-based analysis of VCAM-1 expression in endothelial cells present in TPA-inflamed ear skin of Cre+ or Cre control mice. Shaded histogram: VCAM-1. Empty histogram: Isotype control. (D) Representative FACS plots. (E) Summary of the delta median fluorescent intensities (ΔMFI: specific-isotype staining) from all experiments performed (n = 4 mice per genotype). Measurements from the same mouse are connected by a line. (G) Summary of the ΔMFIs measured per experiment between colLECs and capLECs. (C and F) Unpaired Student’s t test. (E) Paired one-way ANOVA with the Geisser–Greenhouse correction. *, P < 0.05; **, P < 0.01; and ****, P < 0.0001. cap, capillaries; col, collectors; Max, maximum.
Figure 6.
Figure 6.
Loss of VCAM-1 in lymphatic collectors reduces rapid DC migration. (A–F) A FITC painting experiment was performed in the TPA-inflamed ears of tamoxifen-treated Cre+ (Prox1-CreERT2 Vcam1fl/fl) and Cre (WT or Vcam1fl/fl) mice. (A) Schematic depiction of the experiment. (B) FACS gating scheme on auricular LNs. (C–F) Analysis of absolute numbers (C and E) and percentages (D and F) of FITC+ (C and D) and FITC (E and F) migratory (CD11c+ MHCII+) DCs. Pooled data from two similar experiments are shown (n = 10 mice per group). Each dot represents a value from one mouse. (G–I) Crawl-in experiments were performed with WT DCs in ear skin explants of Cre+ and Cre mice. (G) Representative images of DCs in and around capillaries and collectors. Scale bars, 50 µm. Yellow arrows show DCs that did not enter but remained attached to the abluminal side of the collector. (H) Quantification of the ratio of DCs inside the vessel, in comparison of all DCs counted per image. Left: Capillaries (cap). Right: Collectors (col). (I) Quantification showing the ratio of DCs attached to the abluminal side over all DCs colocalizing (i.e., inside or outside) with the vessel. Average ratios of all the images analyzed in the same experiment (n = 4 experiments; two or three explants/condition/experiment) are connected by a line. (C–F) Unpaired Student’s t test. (H and I) paired Student’s t test. *, P < 0.05; and **, P < 0.01.

References

    1. Akl, T.J., Nagai T., Coté G.L., and Gashev A.A.. 2011. Mesenteric lymph flow in adult and aged rats. Am. J. Physiol. Heart Circ. Physiol. 301:H1828–H1840. 10.1152/ajpheart.00538.2011 - DOI - PMC - PubMed
    1. Ara, T., Tokoyoda K., Sugiyama T., Egawa T., Kawabata K., and Nagasawa T.. 2003. Long-term hematopoietic stem cells require stromal cell-derived factor-1 for colonizing bone marrow during ontogeny. Immunity. 19:257–267. 10.1016/S1074-7613(03)00201-2 - DOI - PubMed
    1. Baluk, P., Fuxe J., Hashizume H., Romano T., Lashnits E., Butz S., Vestweber D., Corada M., Molendini C., Dejana E., and McDonald D.M.. 2007. Functionally specialized junctions between endothelial cells of lymphatic vessels. J. Exp. Med. 204:2349–2362. 10.1084/jem.20062596 - DOI - PMC - PubMed
    1. Bazigou, E., Xie S., Chen C., Weston A., Miura N., Sorokin L., Adams R., Muro A.F., Sheppard D., and Makinen T.. 2009. Integrin-alpha9 is required for fibronectin matrix assembly during lymphatic valve morphogenesis. Dev. Cell. 17:175–186. 10.1016/j.devcel.2009.06.017 - DOI - PMC - PubMed
    1. Berk, D.A., Swartz M.A., Leu A.J., and Jain R.K.. 1996. Transport in lymphatic capillaries. II. Microscopic velocity measurement with fluorescence photobleaching. Am. J. Physiol. 270:H330–H337. 10.1152/ajpheart.1996.270.1.H330 - DOI - PubMed

Publication types

MeSH terms