. 2021 May 14;17(5):e1009570.
doi: 10.1371/journal.ppat.1009570. eCollection 2021 May.

Zinc limitation triggers anticipatory adaptations in Mycobacterium tuberculosis

Affiliations

Zinc limitation triggers anticipatory adaptations in Mycobacterium tuberculosis

Allexa Dow et al. PLoS Pathog. .

Abstract

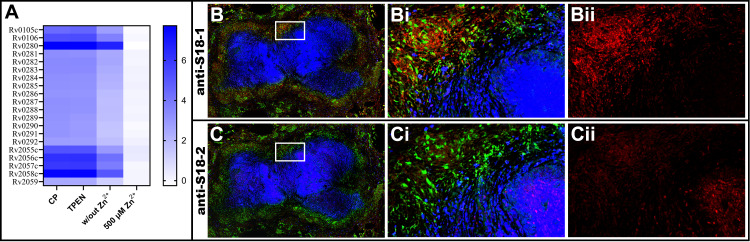
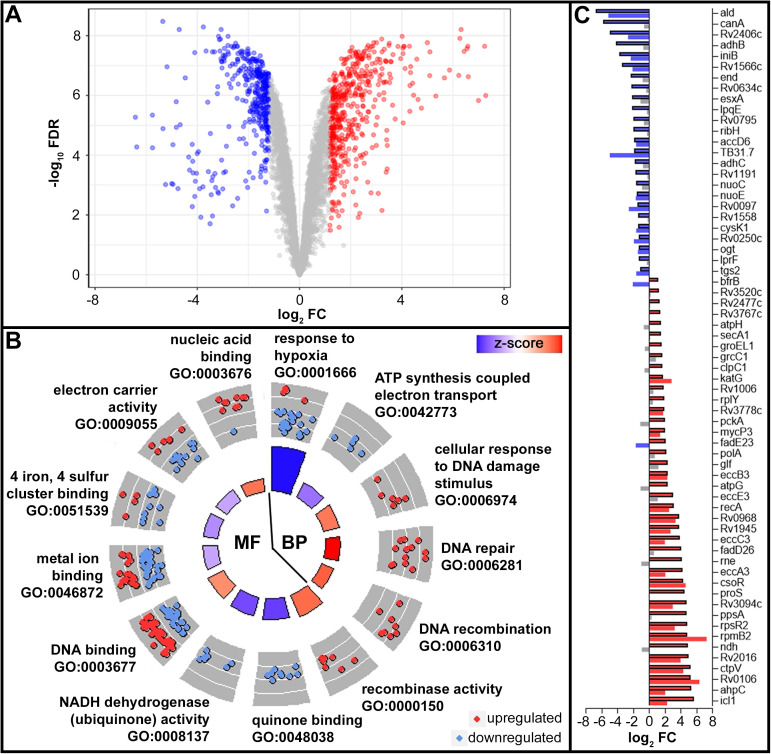
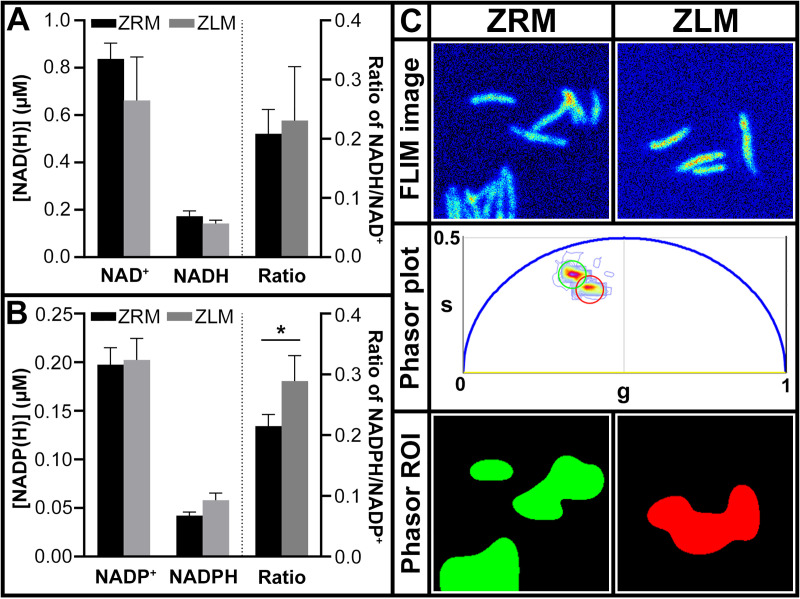
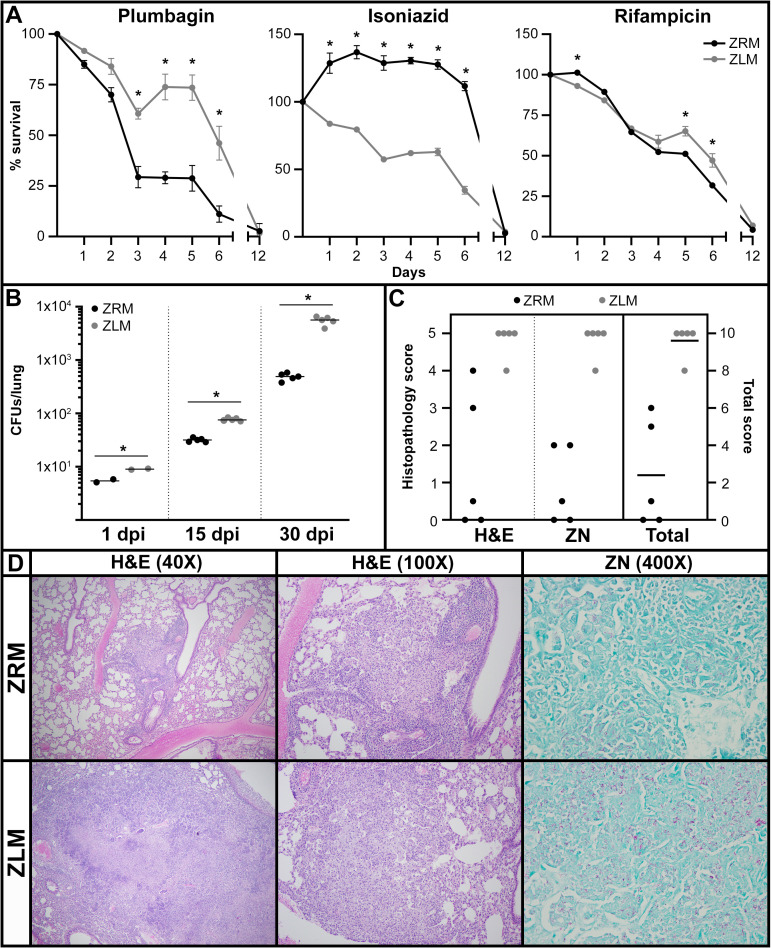
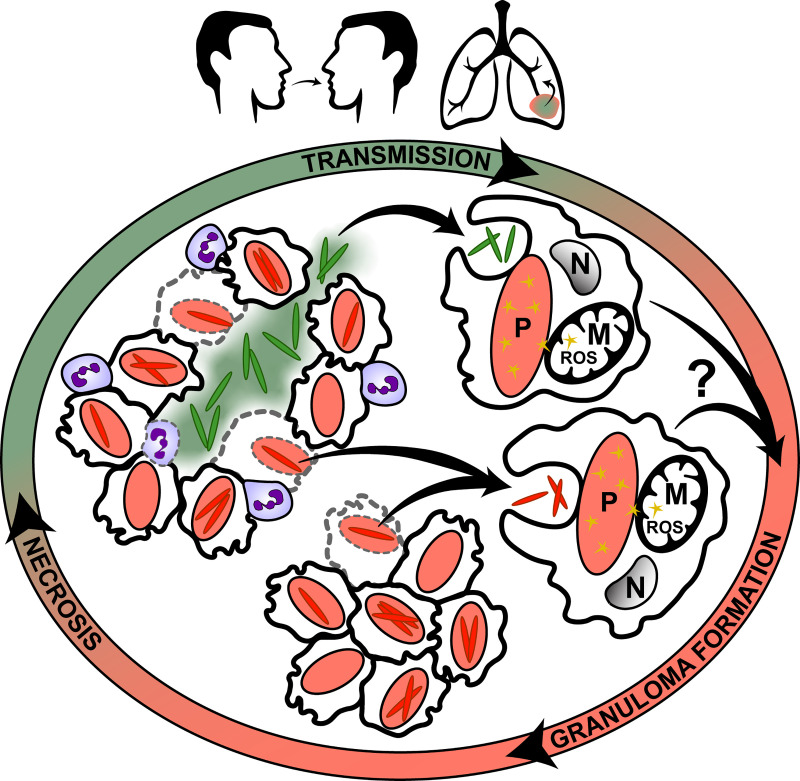
Mycobacterium tuberculosis (Mtb) has complex and dynamic interactions with the human host, and subpopulations of Mtb that emerge during infection can influence disease outcomes. This study implicates zinc ion (Zn2+) availability as a likely driver of bacterial phenotypic heterogeneity in vivo. Zn2+ sequestration is part of "nutritional immunity", where the immune system limits micronutrients to control pathogen growth, but this defense mechanism seems to be ineffective in controlling Mtb infection. Nonetheless, Zn2+-limitation is an environmental cue sensed by Mtb, as calprotectin triggers the zinc uptake regulator (Zur) regulon response in vitro and co-localizes with Zn2+-limited Mtb in vivo. Prolonged Zn2+ limitation leads to numerous physiological changes in vitro, including differential expression of certain antigens, alterations in lipid metabolism and distinct cell surface morphology. Furthermore, Mtb enduring limited Zn2+ employ defensive measures to fight oxidative stress, by increasing expression of proteins involved in DNA repair and antioxidant activity, including well described virulence factors KatG and AhpC, along with altered utilization of redox cofactors. Here, we propose a model in which prolonged Zn2+ limitation defines a population of Mtb with anticipatory adaptations against impending immune attack, based on the evidence that Zn2+-limited Mtb are more resistant to oxidative stress and exhibit increased survival and induce more severe pulmonary granulomas in mice. Considering that extracellular Mtb may transit through the Zn2+-limited caseum before infecting naïve immune cells or upon host-to-host transmission, the resulting phenotypic heterogeneity driven by varied Zn2+ availability likely plays a key role during early interactions with host cells.


Conflict of interest statement

The authors have declared that no competing interests exist.

Figures

Fig 1
Fig 1. CP upregulates the Zur regulon in vitro and detection of Zur-regulated protein expression in regions containing CP in vivo.
(A) Heatmap showing log2FC values for genes in the Zur regulon after growth in media without added Zn2+ followed by short-term exposure to CP, TPEN, 6 μM Zn2+ and 500 μM Zn2+. In each condition the change in expression (log2FC) is relative to the 6 μM Zn2+ condition. Log2FC expression values are calculated from the normalized expression counts of biological replicates (n = 3). Confocal microscopy images of serial sections of lung granulomas at 20X magnification stained for Mtb ribosomal proteins with polyclonal anti-S18-1 (B) and anti-S18-2 (C) antibodies (red), CD68+ macrophages (green) and CP (blue). The field in B and C bound by the white box is magnified in panels Bi-ii and Ci-ii and corresponds to a region containing both CD68+ epithelioid macrophages and CP-stained neutrophils and caseum, as well as distribution of Mtb S18-1 (Bi) and S18-2 (Ci). Single channel images from staining with antibodies specific to Mtb ribosomal proteins only is shown for S18-1 (Bii) and S18-2 (Cii).
Fig 2
Fig 2. Adaptive response to Zn2+ limitation in Mtb.
(A) Volcano plot of DE genes (absFC >2, FDR <0.05) in Mtb H37Rv in ZLM vs. ZRM. Genes colored in red, blue, and grey are significantly upregulated, downregulated or not significantly regulated in ZLM vs. ZRM, respectively. (B) Circle plot showing GO terms of biological processes (BP) and molecular functions (MF) significantly enriched in the list of DE genes in ZLM. Each pie slice of the circle is labeled with the enriched GO term, the outer circle shows a scatter plot of DE genes with the given GO annotation and their log2FC values where red circles display upregulated and blue circles downregulated genes in ZLM vs. ZRM. The color of bars in the inner circle indicates whether the given biological process is more likely to be increased (red) or decreased (blue) in the dataset and the height represents the -log10(FDR) for the enriched term (larger bars have smaller FDR). (C) Horizontal bar graph showing the overlap between transcript and protein expression for the 65 DE proteins identified in ZLM (absFC >1.5, FDR <0.05). For each gene, the bar on top (black outline) represents the log2FC value of the protein and the bar below it (no outline) represents the log2FC value of its transcript. Red bars show upregulation and blue bars show downregulation of the protein or transcript in ZLM vs. ZRM while grey bars represent no significant differential expression for transcripts. RNA and proteins for DE analysis were isolated from the same cultures of day 10 cells from ZRM (n = 3) and ZLM (n = 3).
Fig 3
Fig 3. Zn2+-limited Mtb maintain redox homeostasis and exhibit increased reducing power.
Quantification of oxidized (NAD(P)+) and reduced (NAD(P)H) nicotinamide adenine dinucleotide cofactors (A) and its phosphorylated forms (B) in Mtb mc2 6206 cultures after 10 days of growth in ZLM and ZRM. Data, given as the average of biological replicates (ZRM n = 3, ZLM n = 3) with error bars representing standard deviation, are representative of three independent experiments. Asterisks represent a statistically significant difference (t-test, p-value <0.05) in the ratio of oxidized to reduced forms of nicotinamide cofactors in ZRM and ZLM. (C) Fluorescence lifetime imaging (FLIM) of reduced nicotinamide cofactors (NADH and NADPH) for Mtb mc2 6206 cultures after 10 days of growth in ZRM and ZLM. The FLIM micrographs in the top panel are representative fluorescence intensity images for each condition. The phasor plot in the middle shows the phasor positions obtained from the FLIM micrographs where green and red circles encompass the phasor fingerprints of cells grown in ZRM and ZLM respectively. The bottom panels show the region of interest (ROI) encompassed by the encircled areas in the phasor plot projected onto the FLIM micrographs, demonstrating distinct phasor fingerprints between cultures in ZRM and ZLM.
Fig 4
Fig 4. Lipidomic analysis and corresponding surface morphology of Mtb in ZLM vs. ZRM.
(A) Cloud plot of retention time vs. m/z for 7,408 features detected from LC-MS of lipids extracted from Mtb H37Rv cells after 10 days of growth in ZRM (n = 3) and ZLM (n = 3). Each bubble on the graph represents a unique feature where red and blue bubbles indicate upregulated and downregulated features respectively in ZLM vs. ZRM. For each bubble, the p-value is represented by opacity (lower p-values appear darker) and the fold-change is represented by the radius (larger fold-changes have larger radii). Only features with p-value < 0.01 and absFC >2 are shown. (B) Violin plot showing log2FC for each compound identified from selected lipid classes in ZLM vs. ZRM. The horizontal lines in each violin plot represent the interquartile range. Abbreviations of lipid classes can be found in S1 Text. (C) Scanning electron micrographs representative of Mtb mc2 6206 cultures after 10 days of growth in ZRM (n = 3) and ZLM (n = 3). All images are taken at 120kX magnification, the scale bar applies to all images.
Fig 5
Fig 5. Zn2+-limited Mtb exhibit increased resistance to oxidative stress in vitro and cause higher bacterial burden and pathology in vivo.
(A) Survival of Mtb mc2 6206 after growth in ZRM or ZLM and subsequent exposure to the indicated chemical or antibiotic. Survival was monitored with flow cytometry for twelve days following treatment and was calculated as the percentage of live cells in untreated cultures at the beginning of treatment (S10 Fig). The data are representative of three independent experiments and are given as the average of biological replicates (ZRM n = 3, ZLM n = 2) with error bars representing standard deviation. Asterisks represent a statistically significant difference (t-test, p-value <0.05) between survival of cultures in ZRM vs. ZLM at any given time-point. (B) Bacterial burden in the lungs of C3HeB/FeJ (Kramnik) mice after 1, 15 and 30 days post-infection (dpi) with Mtb H37Rv pre-grown in ZRM or ZLM. Horizontal bars across the data points represent the average CFUs. Asterisks represent a statistically significant difference (t-test, p-value <0.05) between CFUs of mice infected with ZRM vs. ZLM at each timepoint. (C) Blinded histopathology scores from hematoxylin and eosin (H&E) and Ziehl-Neelsen (ZN) staining in panel D. Maximal score of five for H&E and ZN stained cross sections is based on observed changes in lung morphology and immune cell infiltration and bacterial burden respectively and these scores are plotted on the left y-axis. The total score is the sum of the H&E and ZN score for each lung and is given on the right y-axis with a score of 10 representing the maximal level of disease pathology. The horizontal bar through the data for total score represents the average total pathology score. The non-parametric Mann-Whitney U-test for significance was applied to histopathology scores from H&E, ZN and total, all resulting p-values <0.02 indicating a significant difference in pathology scores for mice infected with Mtb pre-grown in ZRM or ZLM. (D) Histopathology micrographs of the lungs of mice infected with Mtb H37Rv pre-grown in ZRM or ZLM at 30 days post-infection. In blinded studies, histology cross-sections of lung tissues were stained with H&E to score changes in lung morphology and immune cell infiltration or ZN stain for mycobacteria (pink) to assess bacterial burden.
Fig 6
Fig 6. Changes in [Zn2+] throughout TB infection cycle drives formation of Zn2+-limited Mtb with anticipatory adaptations.
The gradient around the outside of the figure represents the cycle of changing [Zn2+] throughout infection; red indicates Zn2+-replete and green indicates Zn2+-limited microenvironments. These [Zn2+]-defined microenvironments drive formation of physiologically distinct subpopulations of Mtb with Zn2+-replete Mtb (red rods) in phagosomes and Zn2+-limited Mtb (green rods) exposed to CP, e.g., in the caseum. After phagocytosis of Mtb, solid granulomas form (bottom) and sustained inflammation leads to the recruitment of neutrophils (purple) which cause necrosis (left). Mtb may be transmitted from necrotic or apoptotic cells (grey dashed margins) in either solid or necrotic granulomas. With the latter, Mtb transit through the Zn2+-limited caseum before being transmitted host-to-host or within a single infected individual (top). The Zn2+-limited Mtb subpopulation has adaptations that could enable this subpopulation to anticipate forthcoming stress and resist host killing (e.g., oxidative stress–yellow stars) and/or affect immune cell activation. The exact mechanisms of how [Zn2+]-derived changes in physiology of Mtb may affect disease outcome are unclear and we highlight the importance of defining the host response to Zn2+-replete and Zn2+-limited Mtb (question mark). Drawings are representative and not to scale and some components of granulomas have been omitted for clarity. Abbreviations: nucleus (N), mitochondria (M), phagosome (P).

References

    1. Philips JA, Ernst JD. Tuberculosis Pathogenesis and Immunity. Annu Rev Pathol Mech Dis. 2012;7: 353–384. 10.1146/annurev-pathol-011811-132458 - DOI - PubMed
    1. Barry CE, Boshoff HI, Dartois V, Dick T, Ehrt S, Flynn J, et al.. The spectrum of latent tuberculosis: rethinking the biology and intervention strategies. Nat Rev Microbiol. 2009;7: 845–855. 10.1038/nrmicro2236 - DOI - PMC - PubMed
    1. Lenaerts A, Barry CE, Dartois V. Heterogeneity in tuberculosis pathology, microenvironments and therapeutic responses. Immunol Rev. 2015;264: 288–307. 10.1111/imr.12252 - DOI - PMC - PubMed
    1. Hoff DR, Ryan GJ, Driver ER, Ssemakulu CC, De Groote MA, Basaraba RJ, et al.. Location of Intra- and Extracellular M. tuberculosis Populations in Lungs of Mice and Guinea Pigs during Disease Progression and after Drug Treatment. Tailleux L, editor. PLoS One. 2011;6: e17550. 10.1371/journal.pone.0017550 - DOI - PMC - PubMed
    1. Cadena AM, Fortune SM, Flynn JL. Heterogeneity in tuberculosis. Nat Rev Immunol. 2017;17: 691–702. 10.1038/nri.2017.69 - DOI - PMC - PubMed

Publication types

MeSH terms