

Modelling geographical accessibility to urban centres in Kenya in 2019
- PMID: 33989356
- PMCID: PMC8127925
- DOI: 10.1371/journal.pone.0251624
Modelling geographical accessibility to urban centres in Kenya in 2019
Abstract
Background: Access to major services, often located in urban centres, is key to the realisation of numerous Sustainable Development Goals (SDGs). In Kenya, there are no up-to-date and localised estimates of spatial access to urban centres. We estimate the travel time to urban centres and identify marginalised populations for prioritisation and targeting.
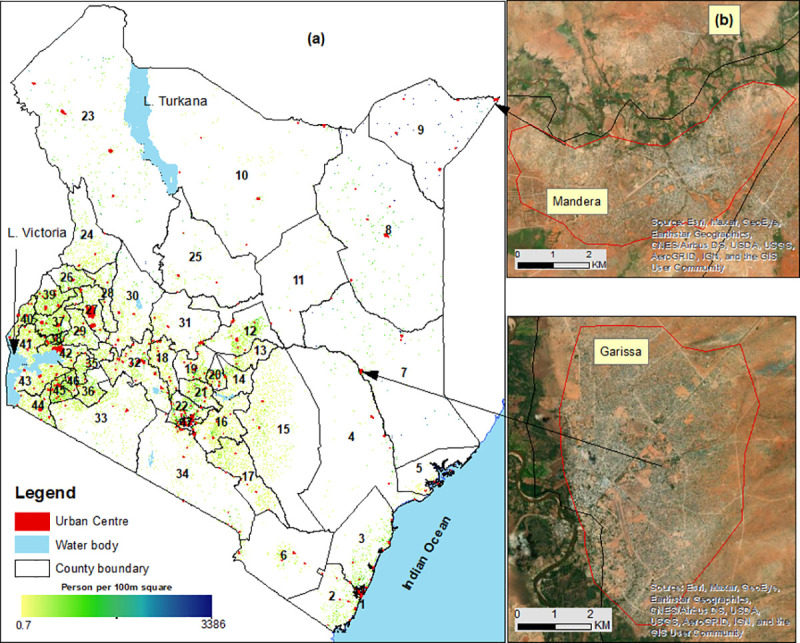
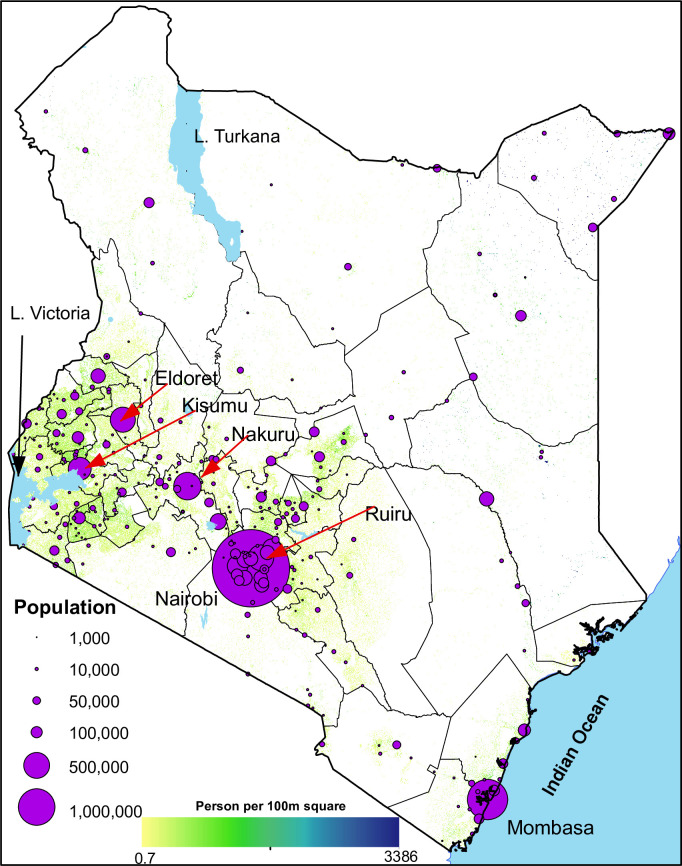
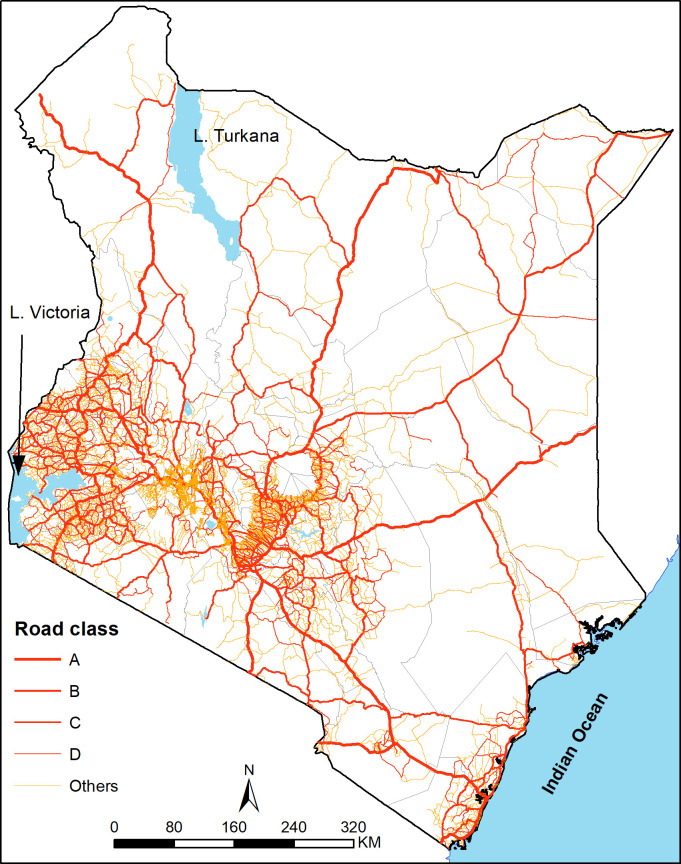
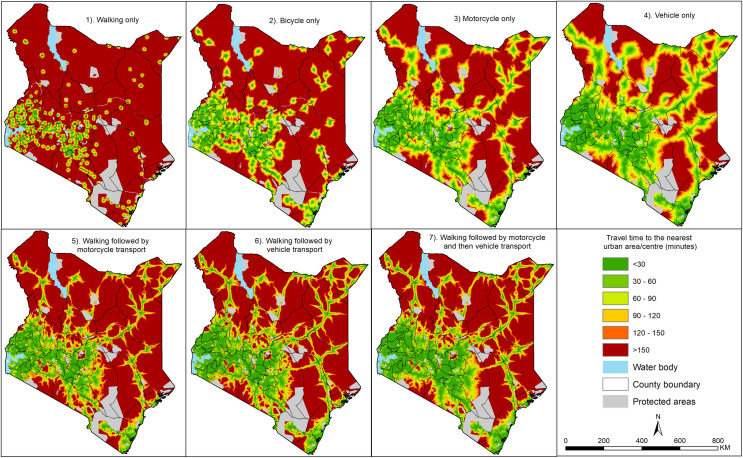
Methods: Urban centres were mapped from the 2019 Kenya population census and combined with spatial databases of road networks, elevation, land use and travel barriers within a cost-friction algorithm to compute travel time. Seven travel scenarios were considered: i) walking only (least optimistic), ii) bicycle only, iii) motorcycle only, iv) vehicle only (most optimistic), v) walking followed by motorcycle transport, vi) walking followed by vehicle transport, and vii) walking followed by motorcycle and then vehicle transport (most pragmatic). Mean travel time, and proportion of the population within 1-hour and 2-hours of the urban centres were summarized at sub-national units (counties) used for devolved planning. Inequities were explored and correlations between the proportion of the population within 1-hour of an urban centre and ten SDG indicators were computed.
Results: A total of 307 urban centres were digitised. Nationally, the mean travel time was 4.5-hours for the walking-only scenario, 1.0-hours for the vehicle only (most optimistic) scenario and 1.5-hours for the walking-motorcycle-vehicle (most pragmatic) scenario. Forty-five per cent (21.3 million people) and 87% (41.6 million people) of Kenya's population resided within 1-hour of the nearest urban centre for the least optimistic and most pragmatic scenarios respectively. Over 3.2 million people were considered marginalised or living outside the 2-hour threshold in the pragmatic scenario, 16.0 million Kenyans for walking only, and 2.2 million for the most optimistic scenario. County-level spatial access was highly heterogeneous ranging between 8%-100% and 32%-100% of people within the 1-hour threshold for the least and most optimistic scenarios, respectively. Counties in northern and eastern parts of Kenya were generally most marginalised. The correlation coefficients for nine SDG indicators ranged between 0.45 to 0.78 and were statistically significant.
Conclusion: Travel time to urban centres in Kenya is heterogeneous. Therefore, marginalised populations should be prioritised during resource allocation and policies should be formulated to enhance equitable access to public services and opportunities in urban areas.
Conflict of interest statement
The authors have declared that no competing interests exist.
Figures
References
-
- UN Department of Economic and Social Affairs (UNDESA). The 17 Sustainable Development Goals. 2015.https://sdgs.un.org/goals (accessed 22 Sep 2020).
-
- Dorosh P, Wang HG, You L, et al. Road connectivity, population, and crop production in sub-Saharan Africa. Agric Econ 2012;43:89–103. 10.1111/j.1574-0862.2011.00567.x - DOI
-
- Mulaku GC, Nyadimo E. GIS in education planning: the Kenyan school mapping project. Surv Rev 2011;43:567–78. 10.1179/003962611X13117748892155 - DOI
Publication types
MeSH terms
Grants and funding
LinkOut - more resources
Full Text Sources
Other Literature Sources
