. 2021 Jul-Aug;14(4):771-779.
doi: 10.1016/j.brs.2021.04.025. Epub 2021 May 11.

Delta oscillation underlies the interictal spike changes after repeated transcranial direct current stimulation in a rat model of chronic seizures

Affiliations

Delta oscillation underlies the interictal spike changes after repeated transcranial direct current stimulation in a rat model of chronic seizures

Yi-Jen Wu et al. Brain Stimul. 2021 Jul-Aug.

Abstract

Background: Transcranial direct current stimulation (tDCS) provides a noninvasive polarity-specific constant current to treat epilepsy, through a mechanism possibly involving excitability modulation and neural oscillation.

Objective: To determine whether EEG oscillations underlie the interictal spike changes after tDCS in rats with chronic spontaneous seizures.

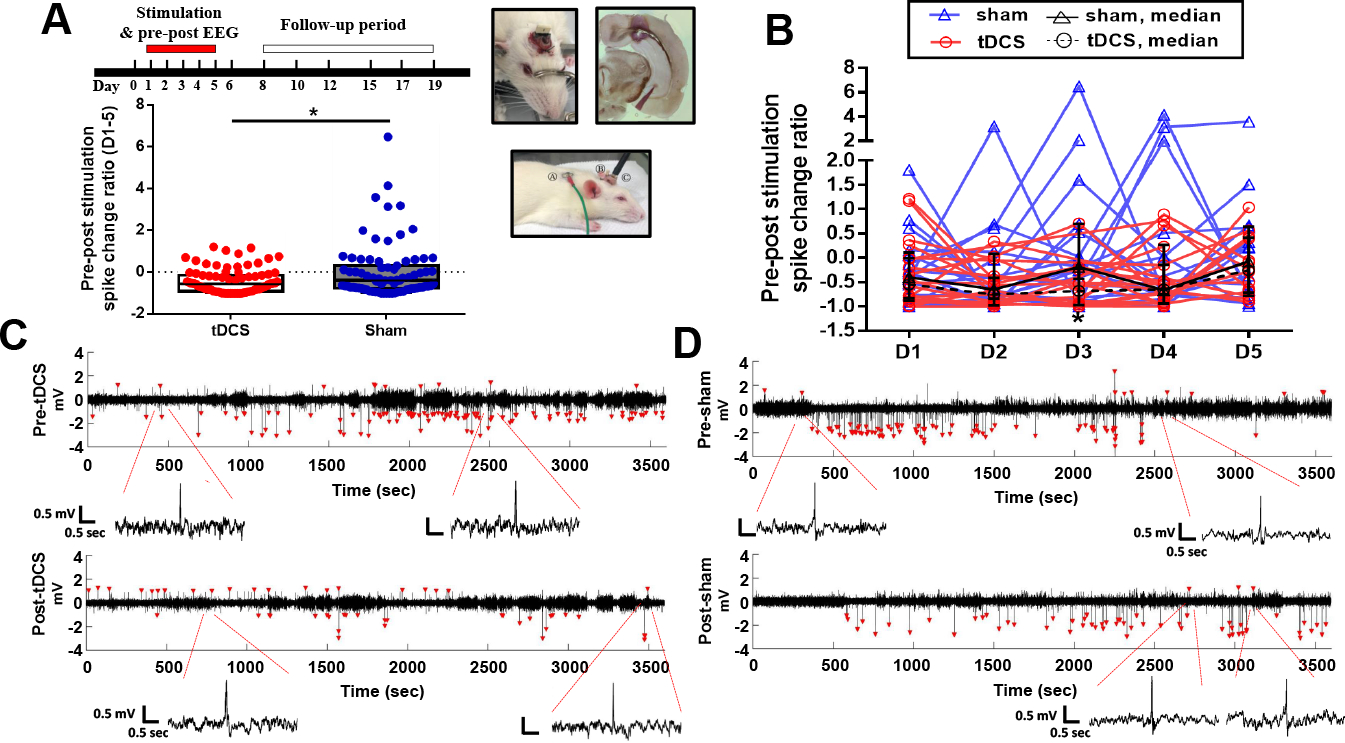
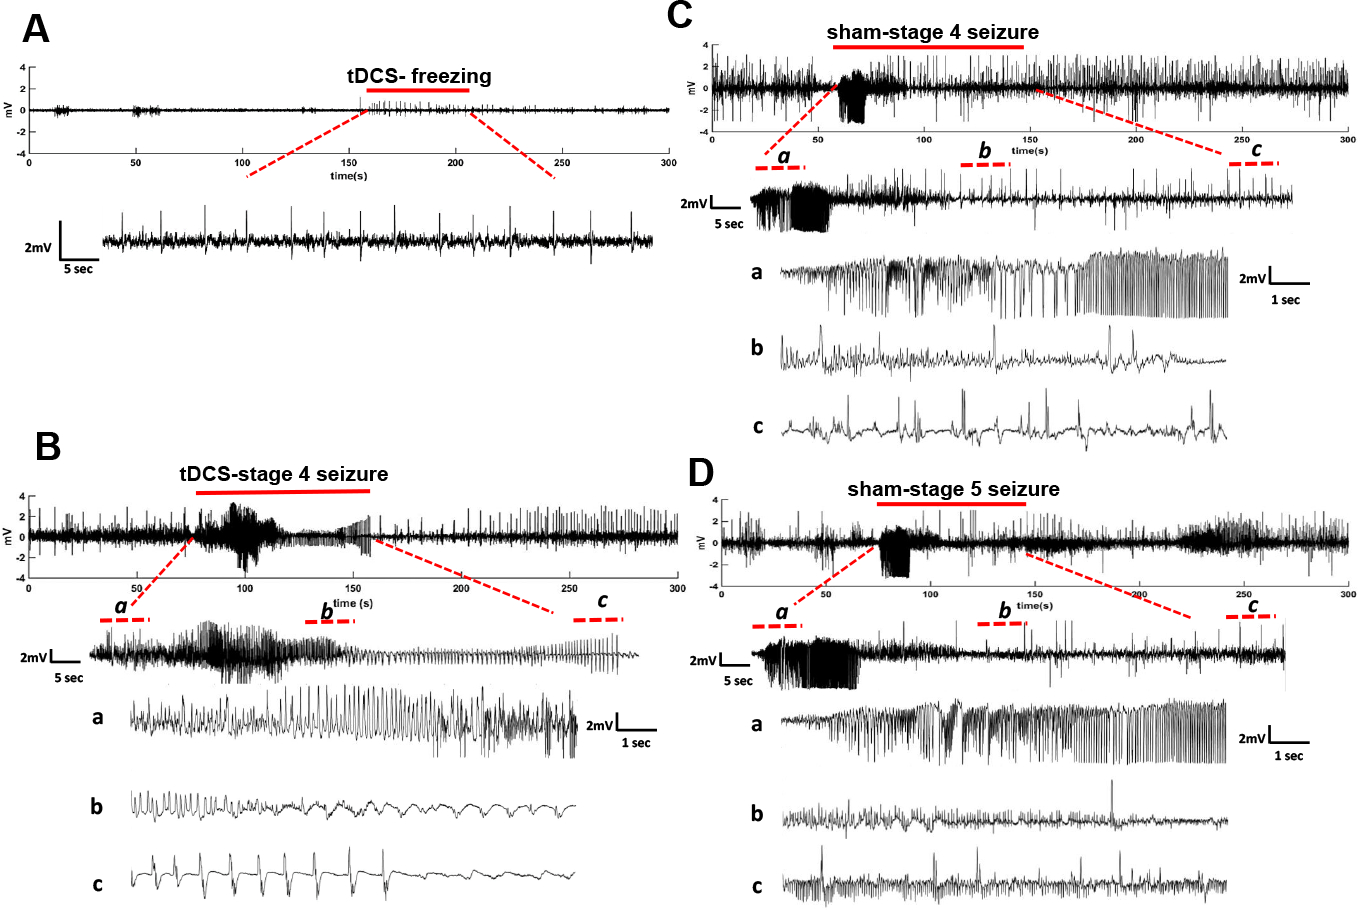
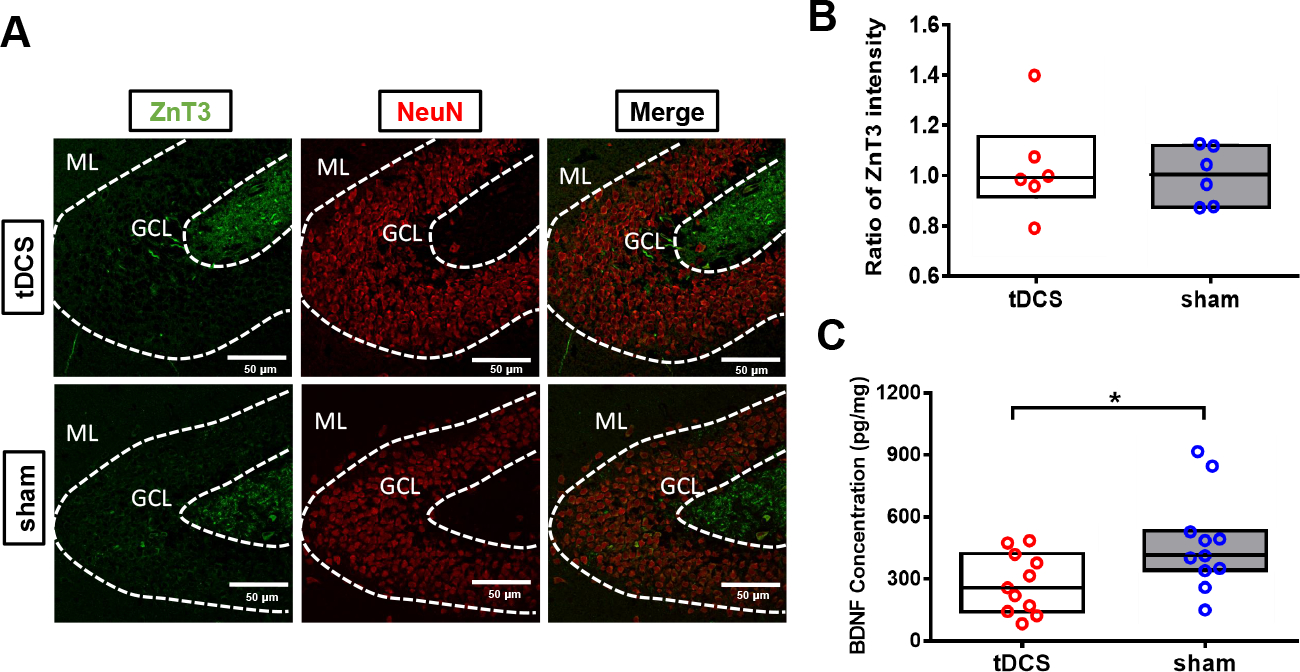
Methods: Rats with kainic acid-induced spontaneous seizures were subjected to cathodal tDCS or sham stimulation for 5 consecutive days. Video-EEG recordings were collected immediately pre- and post-stimulation and for the subsequent 2 weeks following stimulation. The acute pre-post stimulation and subacute follow-up changes of interictal spikes and EEG oscillations in tDCS-treated rats were compared with sham. Ictal EEG with seizure behaviors, hippocampal brain-derived neurotrophic factor (BDNF) protein expression, and mossy fiber sprouting were compared between tDCS and sham rats.

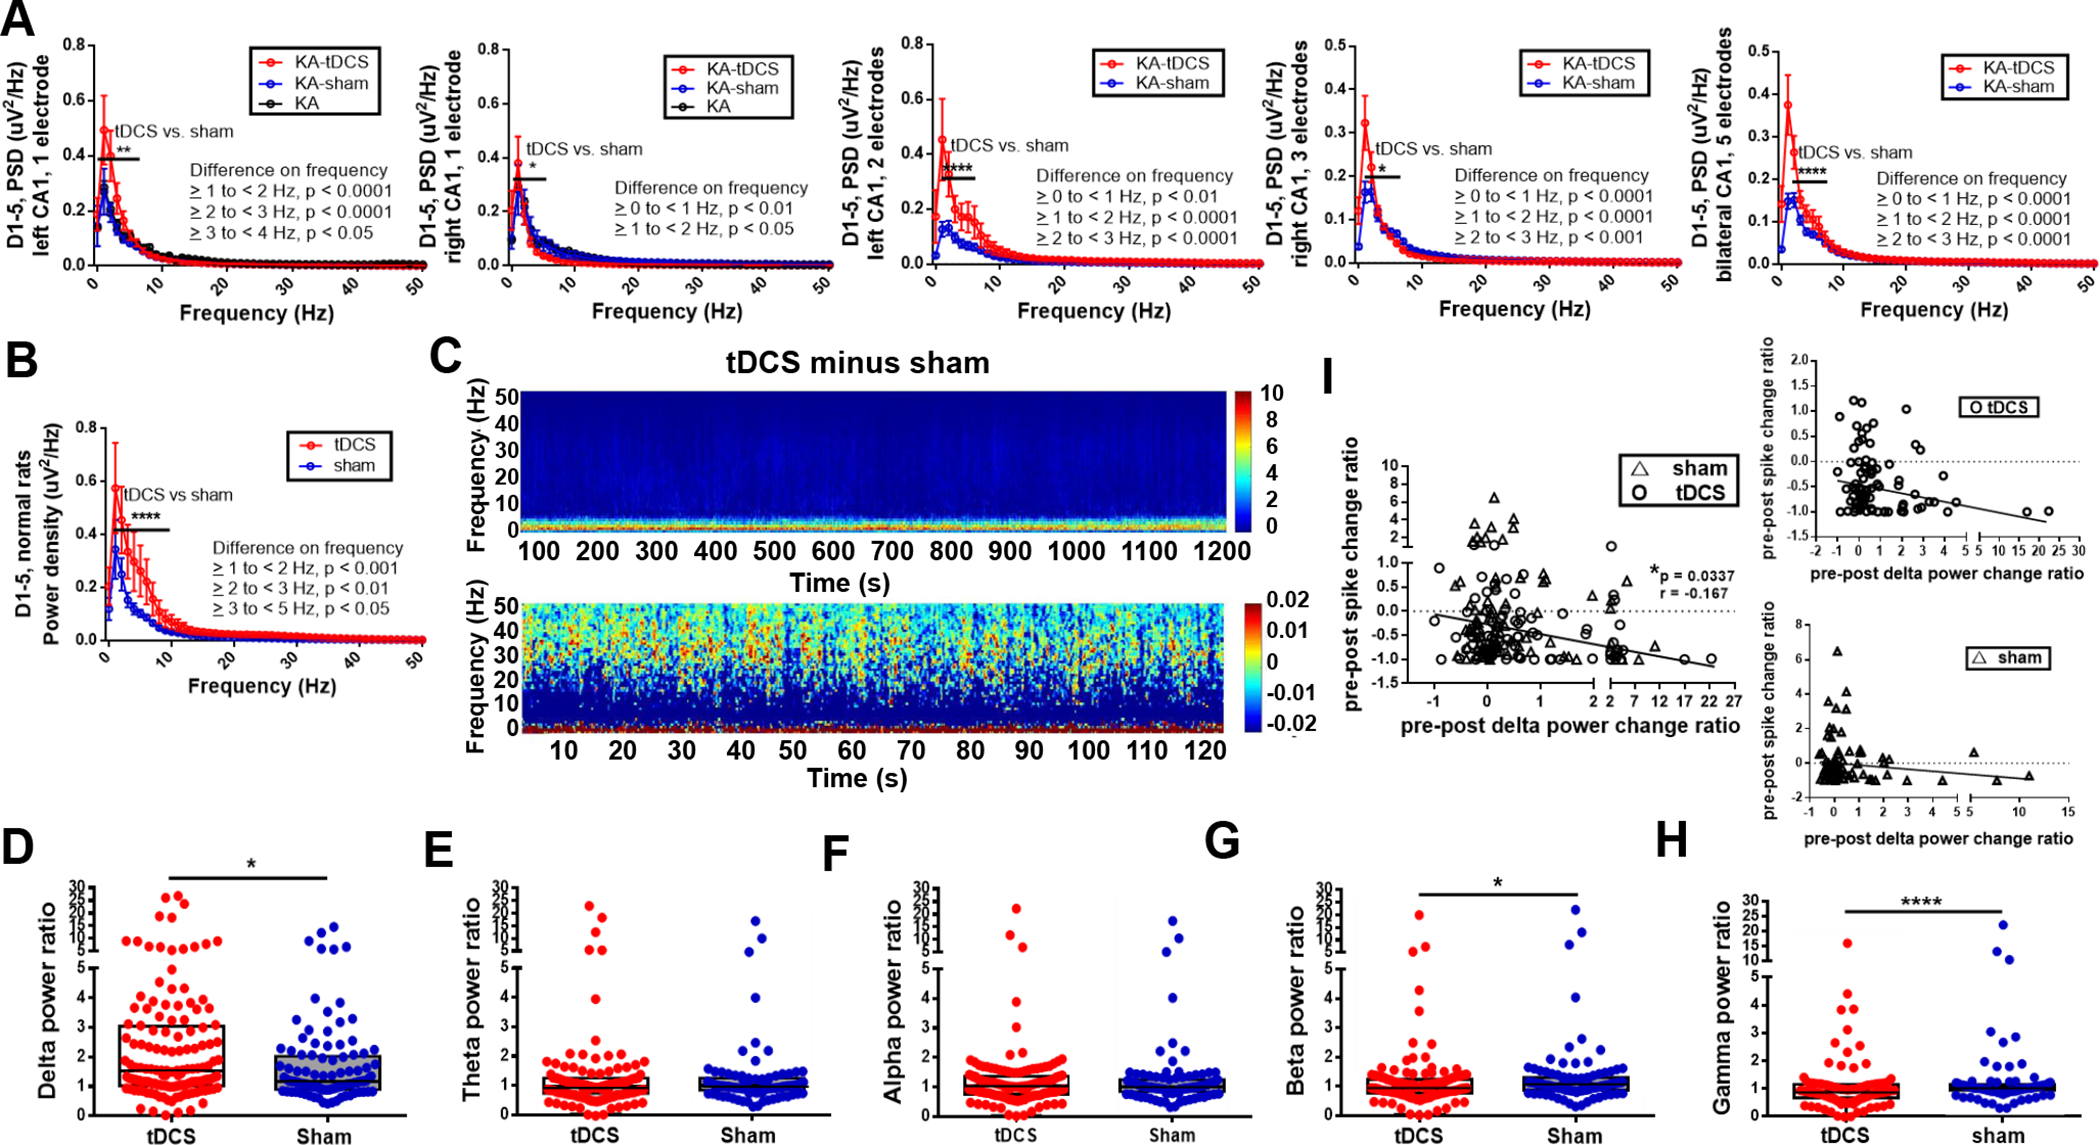
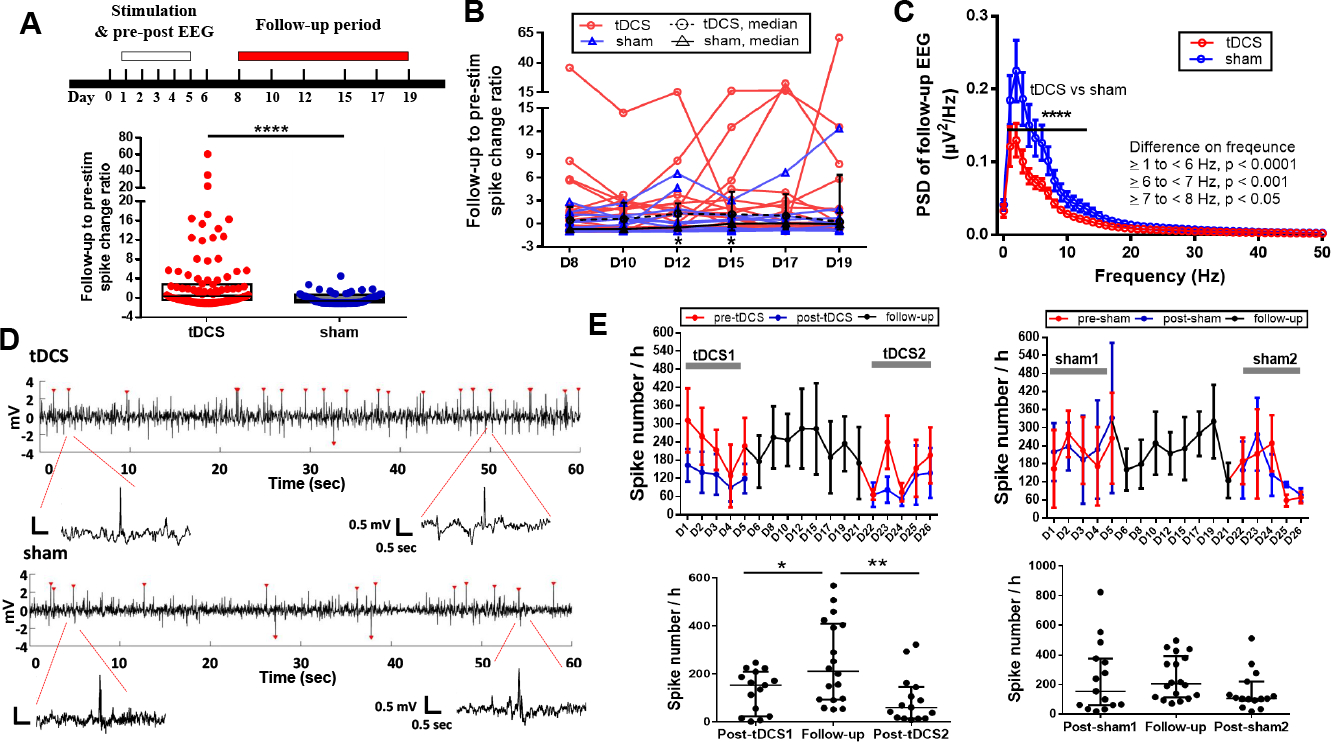
Results: Interictal spike counts were reduced immediately following tDCS with augmented delta and diminished beta and gamma oscillations compared with sham. Cathodal tDCS also enhanced delta oscillations in normal rats. However, increased numbers of interictal spikes with a decrease of delta and theta oscillations were observed in tDCS-treated rats compared with sham during the following 2 weeks after stimulation. Resuming tDCS suppressed the increase of interictal spike activity. In tDCS rats, hippocampal BDNF protein expression was decreased while mossy fiber sprouting did not change compared with sham.

Conclusions: The inverse relationship between the changes of delta oscillation and interictal spikes during tDCS on and off stimulation periods indicates that an enhanced endogenous delta oscillation underlies the tDCS inhibitory effect on epileptic excitability.

Keywords: Electroencephalography (EEG); Epilepsy; Interictal spikes; Oscillation; Seizure; Transcranial direct current stimulation (tDCS).


Conflict of interest statement

Declaration of competing interest The authors declare no competing interests.

Figures

Fig. 1.
Fig. 1.. Interictal spike activity decreased immediately after c-tDCS.
A, Experimental time course (upper left panel). Red bar indicates pre- and post- stimulation EEG sampling period. Assembly of EEG electrode and c-tDCS electrode plugin site (upper middle panel). Electroablation of the depth EEG needle insertion site (upper right panel). Stimulation setup, Ⓐ anodal electrode, Ⓑ EEG assembly, Ⓒ cathodal electrode (lower right panel). Post- to pre-stimulation spike change ratio over the 5 days of stimulation in tDCS treated rats compared with sham (lower left panel, tDCS n = 25 rats, median = −0.580, sham n = 21 rats, median = −0.394, Mann–Whitney U test, p = 0.023). Dark lines indicate median and boxes inter-quartile range (IQR). B, Pre-post interictal spike change ratio on each stimulation day in tDCS and sham-treated rats. A significant reduction on D3 between tDCS and sham (median, tDCS = −0.679 vs. sham = −0.188, Mann–Whitney U = 51.5, p = 0.033). Pre-post spike daily change ratio for each animal shown in blue or red traces for sham and tDCS, respectively. Black traces with triangles and circles represent the median with IQR from sham and tDCS rats, respectively. C, Representative pre- and post- stimulation interictal spikes in a tDCS treated rat. D, Representative pre- and post-stimulation interictal spikes in a sham treated rat. *p < 0.05.
Fig. 2.
Fig. 2.. Delta oscillation was enhanced immediately after repeated c-tDCS.
A, Post-tDCS PSD in KA rats over the 5 stimulation days compared with sham stimulation (first panel, left CA1–1 electrode, two-way repeated measure ANOVA, tDCS vs. sham, p = 0.0021, frequency p < 0.0001, interaction p < 0.0001, post-hoc Bonferroni’s test, tDCS vs. sham, ≧1 to < 2 Hz, p < 0.0001, ≧2 to < 3 Hz, p < 0.0001, and ≧ 3 to < 4 Hz, p = 0.0153; second panel, right CA1–1 electrode, tDCS vs. sham, p = 0.0369, and frequency p < 0.0001, post-hoc test, tDCS vs. sham, ≧ 0 to < 1 Hz, p = 0.0071 and ≧ 1 to < 2 Hz, p = 0.0159; third panel, left CA1–2 electrodes, tDCS vs. sham, p < 0.0001, frequency p < 0.0001, interaction p < 0.0001, post-hoc test, tDCS vs. sham, ≧ 0 to < 1 Hz, p = 0.0027, ≧ 1 to < 2 Hz, p < 0.0001, and ≧ 2 to < 3 Hz, p < 0.0001; fourth panel, right CA1–3 electrodes, tDCS vs. sham, p = 0.0466, frequency p < 0.0001, interaction p < 0.0001, post-hoc test, tDCS vs. sham, ≧ 0 to < 1 Hz, p < 0.0001, ≧ 1 to < 2 Hz, p < 0.0001, and ≧ 2 to < 3 Hz, p = 0.0005; fifth panel, bilateral CA1–5 electrodes, tDCS vs. sham, p < 0.0001, frequency p < 0.0001, interaction p < 0.0001, post-hoc test, tDCS vs. sham, ≧ 0 to < 1 Hz, p < 0.0001, ≧ 1 to < 2 Hz, p < 0.0001, and ≧ 2 to < 3 Hz, p < 0.0001). PSD of age- and time-matched KA rats indicated by black line. B, Post-tDCS PSD of normal rats over the 5 stimulation days compared with sham (two-wavy repeated measure ANOVA, tDCS vs. sham, p < 0.0001 and frequency p < 0.0001, post-hoc Bonferroni’s test, tDCS vs. sham, ≧1 to < 2 Hz, p = 0.0004, ≧2 to < 3 Hz, p = 0.0038, ≧3 to < 4 Hz, p = 0.0218, and ≧4 to < 5 Hz, p = 0.0284). C, Time-frequency spectrogram subtracting the power of sham from tDCS-treated KA rats. Upper panel, sampled and summed every 20 minutes for post-stim 1-h EEG. Lower panel, selected last 2 minutes every 30 minutes for post-stim 1-h EEG. Both including D1 to D5, tDCS, 25 rats; sham, 21 rats. D, Post-stimulation delta power (0.1–3.9 Hz) normalized to pre-stimulation compared tDCS and sham (tDCS vs. sham, median power ratio 1.525 vs. 1.153, U = 5407, p = 0.0158, Mann–Whitney U test). E, Post-stimulation theta power (4.0–7.9 Hz) normalized to pre-stimulation compared tDCS with sham. F, Post-stimulation alpha power (8.0–11.9 Hz) normalized to pre-stimulation compared tDCS with sham. G, Post-stimulation beta power (12.0–29.9 Hz) normalized to pre-stimulation compared tDCS with sham (tDCS vs. sham, median power ratio 0.95 vs. 1.080, U = 5388, p = 0.0142). H, Post-stimulation gamma power (30.0–45.0 Hz) normalized to pre-stimulation compared tDCS with sham (tDCS vs. sham, median power ratio 0.892 vs. 1.04, U = 4665, p < 0.0001). I, Correlation between pre-post stimulation change ratios of interictal spike and delta power among all rats (Spearman r = −0.1670, p = 0.0337), tDCS treated rats (n = 25 rats, Spearman r = −0.1998, p = 0.0701), and sham treated rats (n = 21 rats, Spearman r = −0.06617, p = 0.5623). *p < 0.05, **p < 0.01, ****p < 0.0001.
Fig. 3.
Fig. 3.. Increased interictal spikes and decreased low-frequency oscillation in the follow-up period after tDCS withdrawal.
A, Experimental time course (upper panel). Red bar indicating the follow-up EEG sampling period. Interictal spike ratio of follow-up to pre-stimulation (D0) in tDCS treated rats compared with sham (lower panel, tDCS vs. sham, median power ratio 0.419 vs. −0.529, U = 2254, p < 0.0001, Mann–Whitney U test). Dark lines indicate median and boxes for IQR. B, Follow-up to pre-stimulation interictal spike ratio in tDCS versus sham on each sampling day. It was significantly increased in tDCS than sham on D12 (tDCS vs. sham, median ratio 1.22 vs. −0.53, U = 63, p = 0.0302, Mann–Whitney U test) and D15 (tDCS vs. sham, median ratio 0.872 vs. −0.084, U = 38.00, p = 0.0264). Red line, data of each animal treated with tDCS; blue line, sham. Black traces with triangles and circles represent the median with IQR from sham and tDCS rats, respectively. C, PSD of follow-up EEG comparing tDCS and sham (two-way repeated measure ANOVA, tDCS vs. sham, p < 0.0001, post-hoc Bonferroni’s test, tDCS vs. sham, ≧ 1 to < 6 Hz, p < 0.0001, ≧ 6 to < 7 Hz, p = 0.0003, and ≧ 7 to < 8 Hz, p = 0.0237). D, Representative interictal spikes in the follow-up period from tDCS treated and sham treated KA rats. E, Representative interictal spikes of the follow-up period, and pre- and post-stimulation interictal spikes of the first and second stimulation course of tDCS and sham (upper panel). Statistical graph (lower panel) comparing interictal spike numbers of follow-up period and post-stimulation in tDCS (post-tDCS1 vs. follow-up, p = 0.0316, post-tDCS2 vs. follow-up, p = 0.0036, one-way ANOVA, n = 3 rats) and sham treated rats. pre-stim, pre-stimulation. *p < 0.05, **p < 0.01,****p < 0.0001.
Fig. 4.
Fig. 4.. Ictal discharges in the follow-up period after repeated tDCS.
A, Ictal discharge in a post-tDCS treated KA rat presenting freezing seizure. B, Ictal discharge in a post-tDCS treated KA rat presenting stage 4 convulsive seizure. C, Ictal discharge in a post-sham treated KA rat presenting stage 4 convulsive seizure. D, Ictal discharge in a post-sham treated KA rat presenting stage 5 convulsive seizure. Red lines indicate simultaneous ictal EEG segments of the behavior seizures. Red dash lines, zoom-in of a, the initial, b, the middle and c, the end phase of each ictal EEG.
Fig. 5.
Fig. 5.. Hippocampal mossy fiber sprouting and BDNF expression following repeated tDCS.
A, DG mossy fiber sproutings by ZnT3 staining in tDCS and sham treated KA rats. B, Statistical graph comparing DG mossy fibers of tDCS-treated rats to sham (tDCS n = 6, sham n = 6, Mann–Whitney U, p > 0.999). C, Hippocampal BDNF protein expression of tDCS-treated rats compared with sham (Mann–Whitney U test, tDCS n = 11 vs. sham n = 11, median 256.3 vs. 415.4, U = 27, p = 0.028). Dark lines indicate median and boxes for IQR in B and C. DG, dentate gyrus; GCL, granular cell layer; ML, molecular layer. *p < 0.05.

Similar articles

Cited by

References

    1. Falco-Walter JJ, Scheffer IE, Fisher RS. The new definition and classification of seizures and epilepsy. Epilepsy research 2018;139:73–9. - PubMed
    1. Scheffer IE, Berkovic S, Capovilla G, Connolly MB, French J, Guilhoto L, et al. ILAE classification of the epilepsies: Position paper of the ILAE Commission for Classification and Terminology. Epilepsia 2017;58(4):512–21. - PMC - PubMed
    1. Thijs RD, Surges R, O’Brien TJ, Sander JW. Epilepsy in adults. Lancet 2019;393(10172):689–701. - PubMed
    1. Ryvlin P, Cross JH, Rheims S. Epilepsy surgery in children and adults. The Lancet Neurology 2014;13(11):1114–26. - PubMed
    1. Fisher RS, Velasco AL. Electrical brain stimulation for epilepsy. Nature reviews Neurology 2014;10(5):261–70. - PubMed

Publication types

LinkOut - more resources