

Effects of COVID-19 on the environment: An overview on air, water, wastewater, and solid waste
- PMID: 33990012
- PMCID: PMC8086829
- DOI: 10.1016/j.jenvman.2021.112694
Effects of COVID-19 on the environment: An overview on air, water, wastewater, and solid waste
Abstract
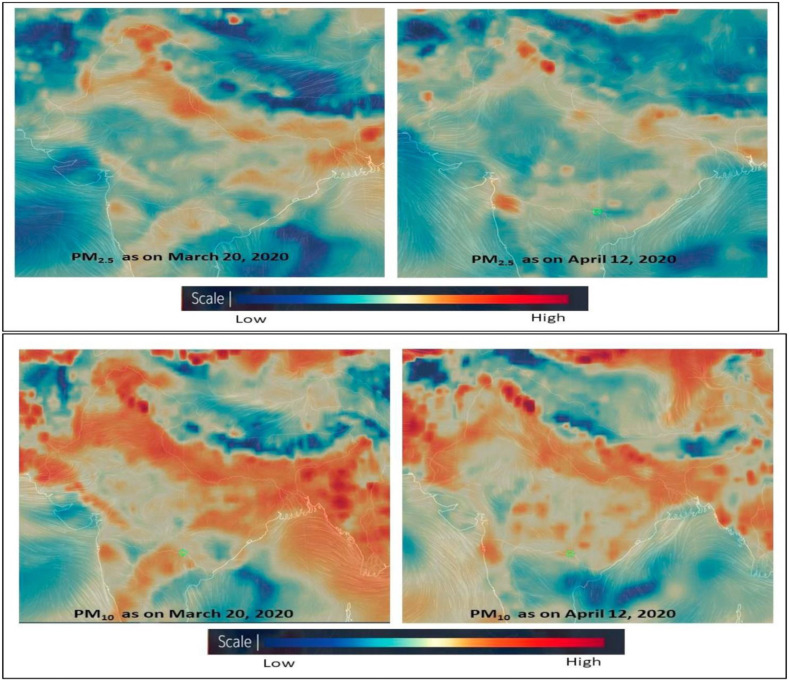
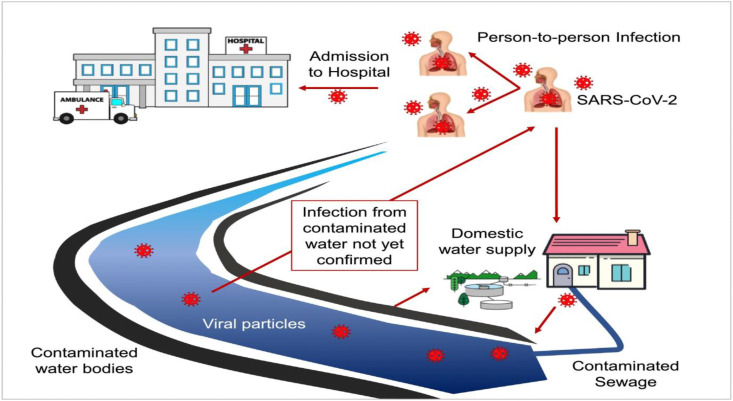
The COVID-19 pandemic has hit the world hardly as of the beginning of 2020 and quickly spread worldwide from its first-reported point in early Dec. 2019. By mid-March 2021, the COVID-19 almost hit all countries worldwide, with about 122 and 2.7 million confirmed cases and deaths, respectively. As a strong measure to stop the infection spread and deaths, many countries have enforced quarantine and lockdown of many activities. The shutdown of these activities has resulted in large economic losses. However, it has been widely reported that these measures have resulted in improved air quality, more specifically in highly polluted areas characterized by massive population and industrial activities. The reduced levels of carbon, nitrogen, sulfur, and particulate matter emissions have been reported and confirmed worldwide in association with lockdown periods. On the other hand, ozone levels in ambient air have been found to increase, mainly in response to the reduced nitrogen emissions. In addition, improved water quality in natural water resources has been reported as well. Wastewater facilities have reported a higher level of organic load with persistent chemicals due to the increased use of sanitizers, disinfectants, and antibiotics. The solid waste generated due to the COVID-19 pandemic was found to increase both qualitatively and quantitatively. This work presents and summarizes the observed environmental effects of COVID-19 as reported in the literature for different countries worldwide. The work provides a distinct overview considering the effects imposed by COVID-19 on the air, water, wastewater, and solid waste as critical elements of the environment.
Keywords: Air quality; COVID-19; Carbon emissions; Environment; Pollution; Solid waste; Wastewater; Water resources.
Copyright © 2021 Elsevier Ltd. All rights reserved.
Conflict of interest statement
The authors declare that they have no known competing financial interests or personal relationships that could have appeared to influence the work reported in this paper.
Figures


References
-
- Abdelkareem M.A., Elsaid K., Wilberforce T., Kamil M., Sayed E.T., Olabi A.G. Environmental aspects of fuel cells: a review. Sci. Total Environ. 2020;752:141803. - PubMed
-
- Adelodun B., Ajibade F.O., Ibrahim R.G., Bakare H.O., Choi K.S. Snowballing transmission of COVID-19 (SARS-CoV-2) through wastewater: any sustainable preventive measures to curtail the scourge in low-income countries? Sci. Total Environ. 2020;742:140680. doi: 10.1016/j.scitotenv.2020.140680. - DOI - PMC - PubMed
-
- Agathokleous R., Bianchi G., Panayiotou G., Arestia L., Argyrou M.C., Georgiou G.S., Tassou S.A., Jouhara H., Kalogirou S.A., Florides G.A., Christodoulides P. Waste heat recovery in the EU industry and proposed new technologies. Energy Procedia. 2019;161:489–496. doi: 10.1016/j.egypro.2019.02.064. - DOI
Publication types
MeSH terms
Substances
LinkOut - more resources
Full Text Sources
Other Literature Sources
Medical
Research Materials
