

Oxytocin Receptor Activation Rescues Opioid-Induced Respiratory Depression by Systemic Fentanyl in the Rat
- PMID: 33990416
- PMCID: PMC8407530
- DOI: 10.1124/jpet.121.000535
Oxytocin Receptor Activation Rescues Opioid-Induced Respiratory Depression by Systemic Fentanyl in the Rat
Abstract
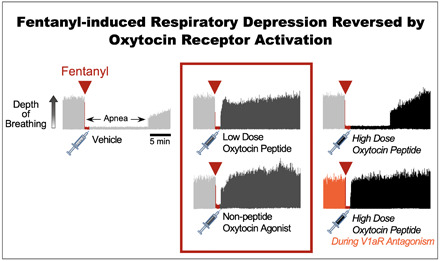
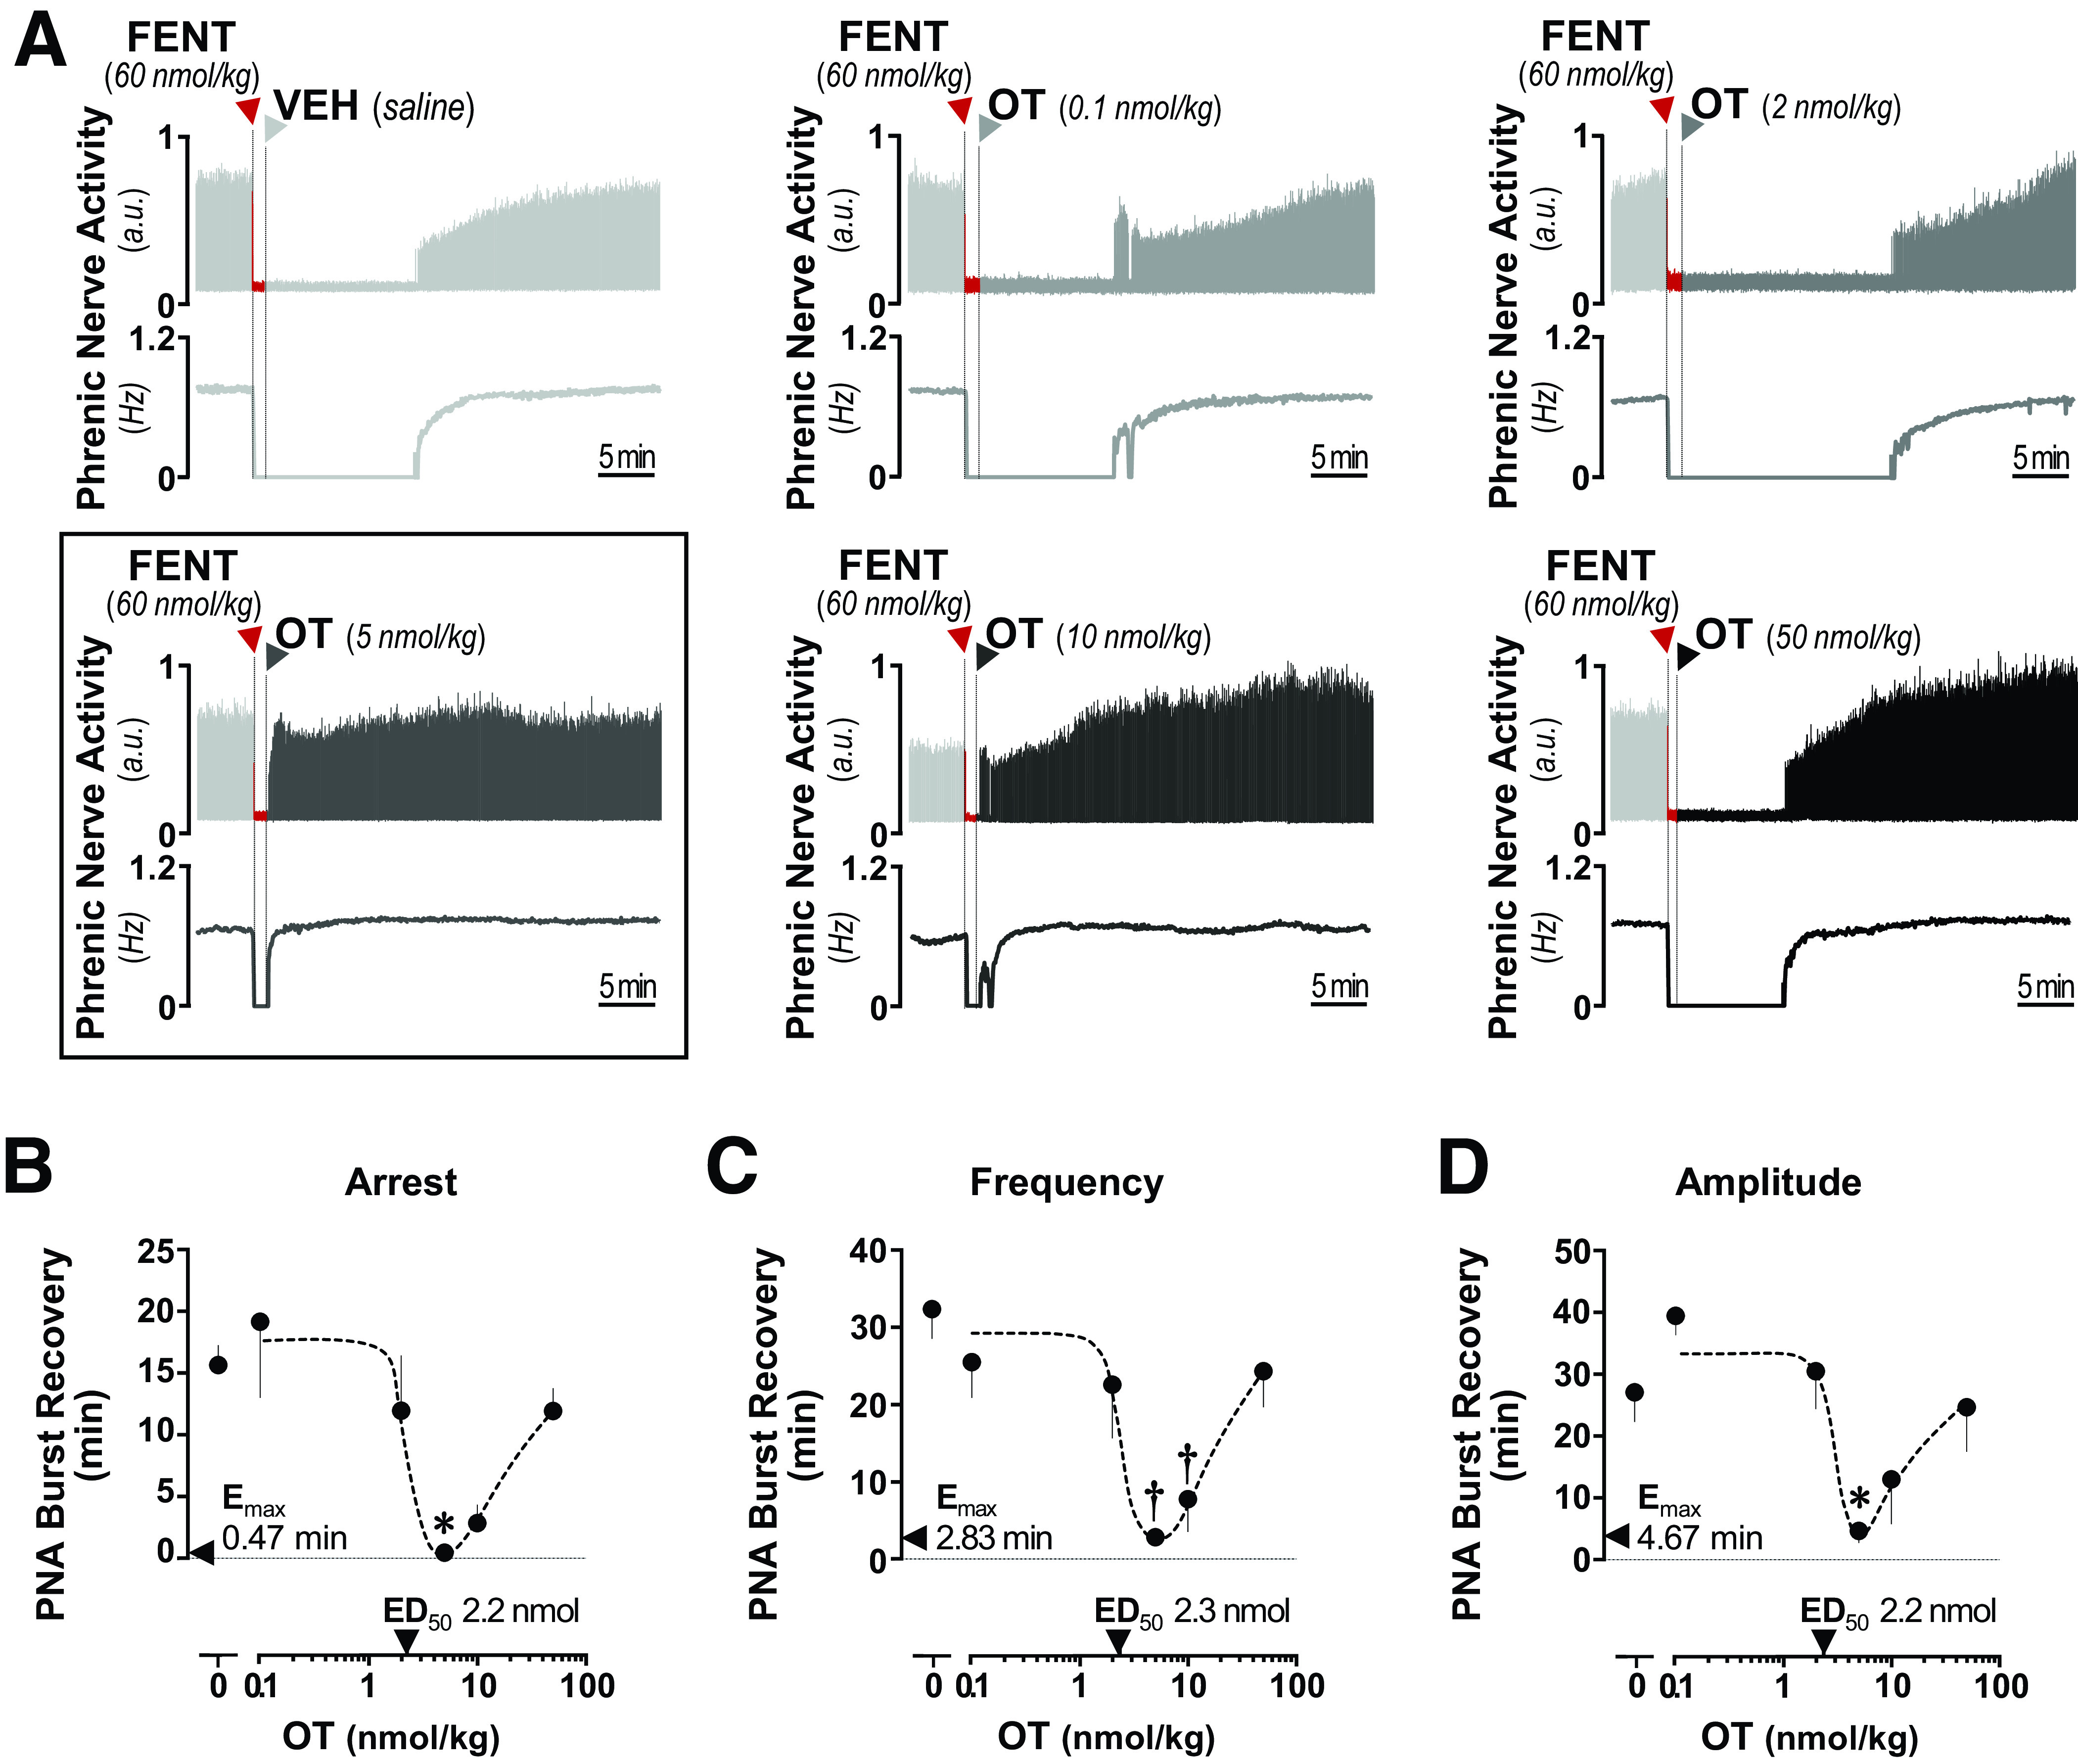
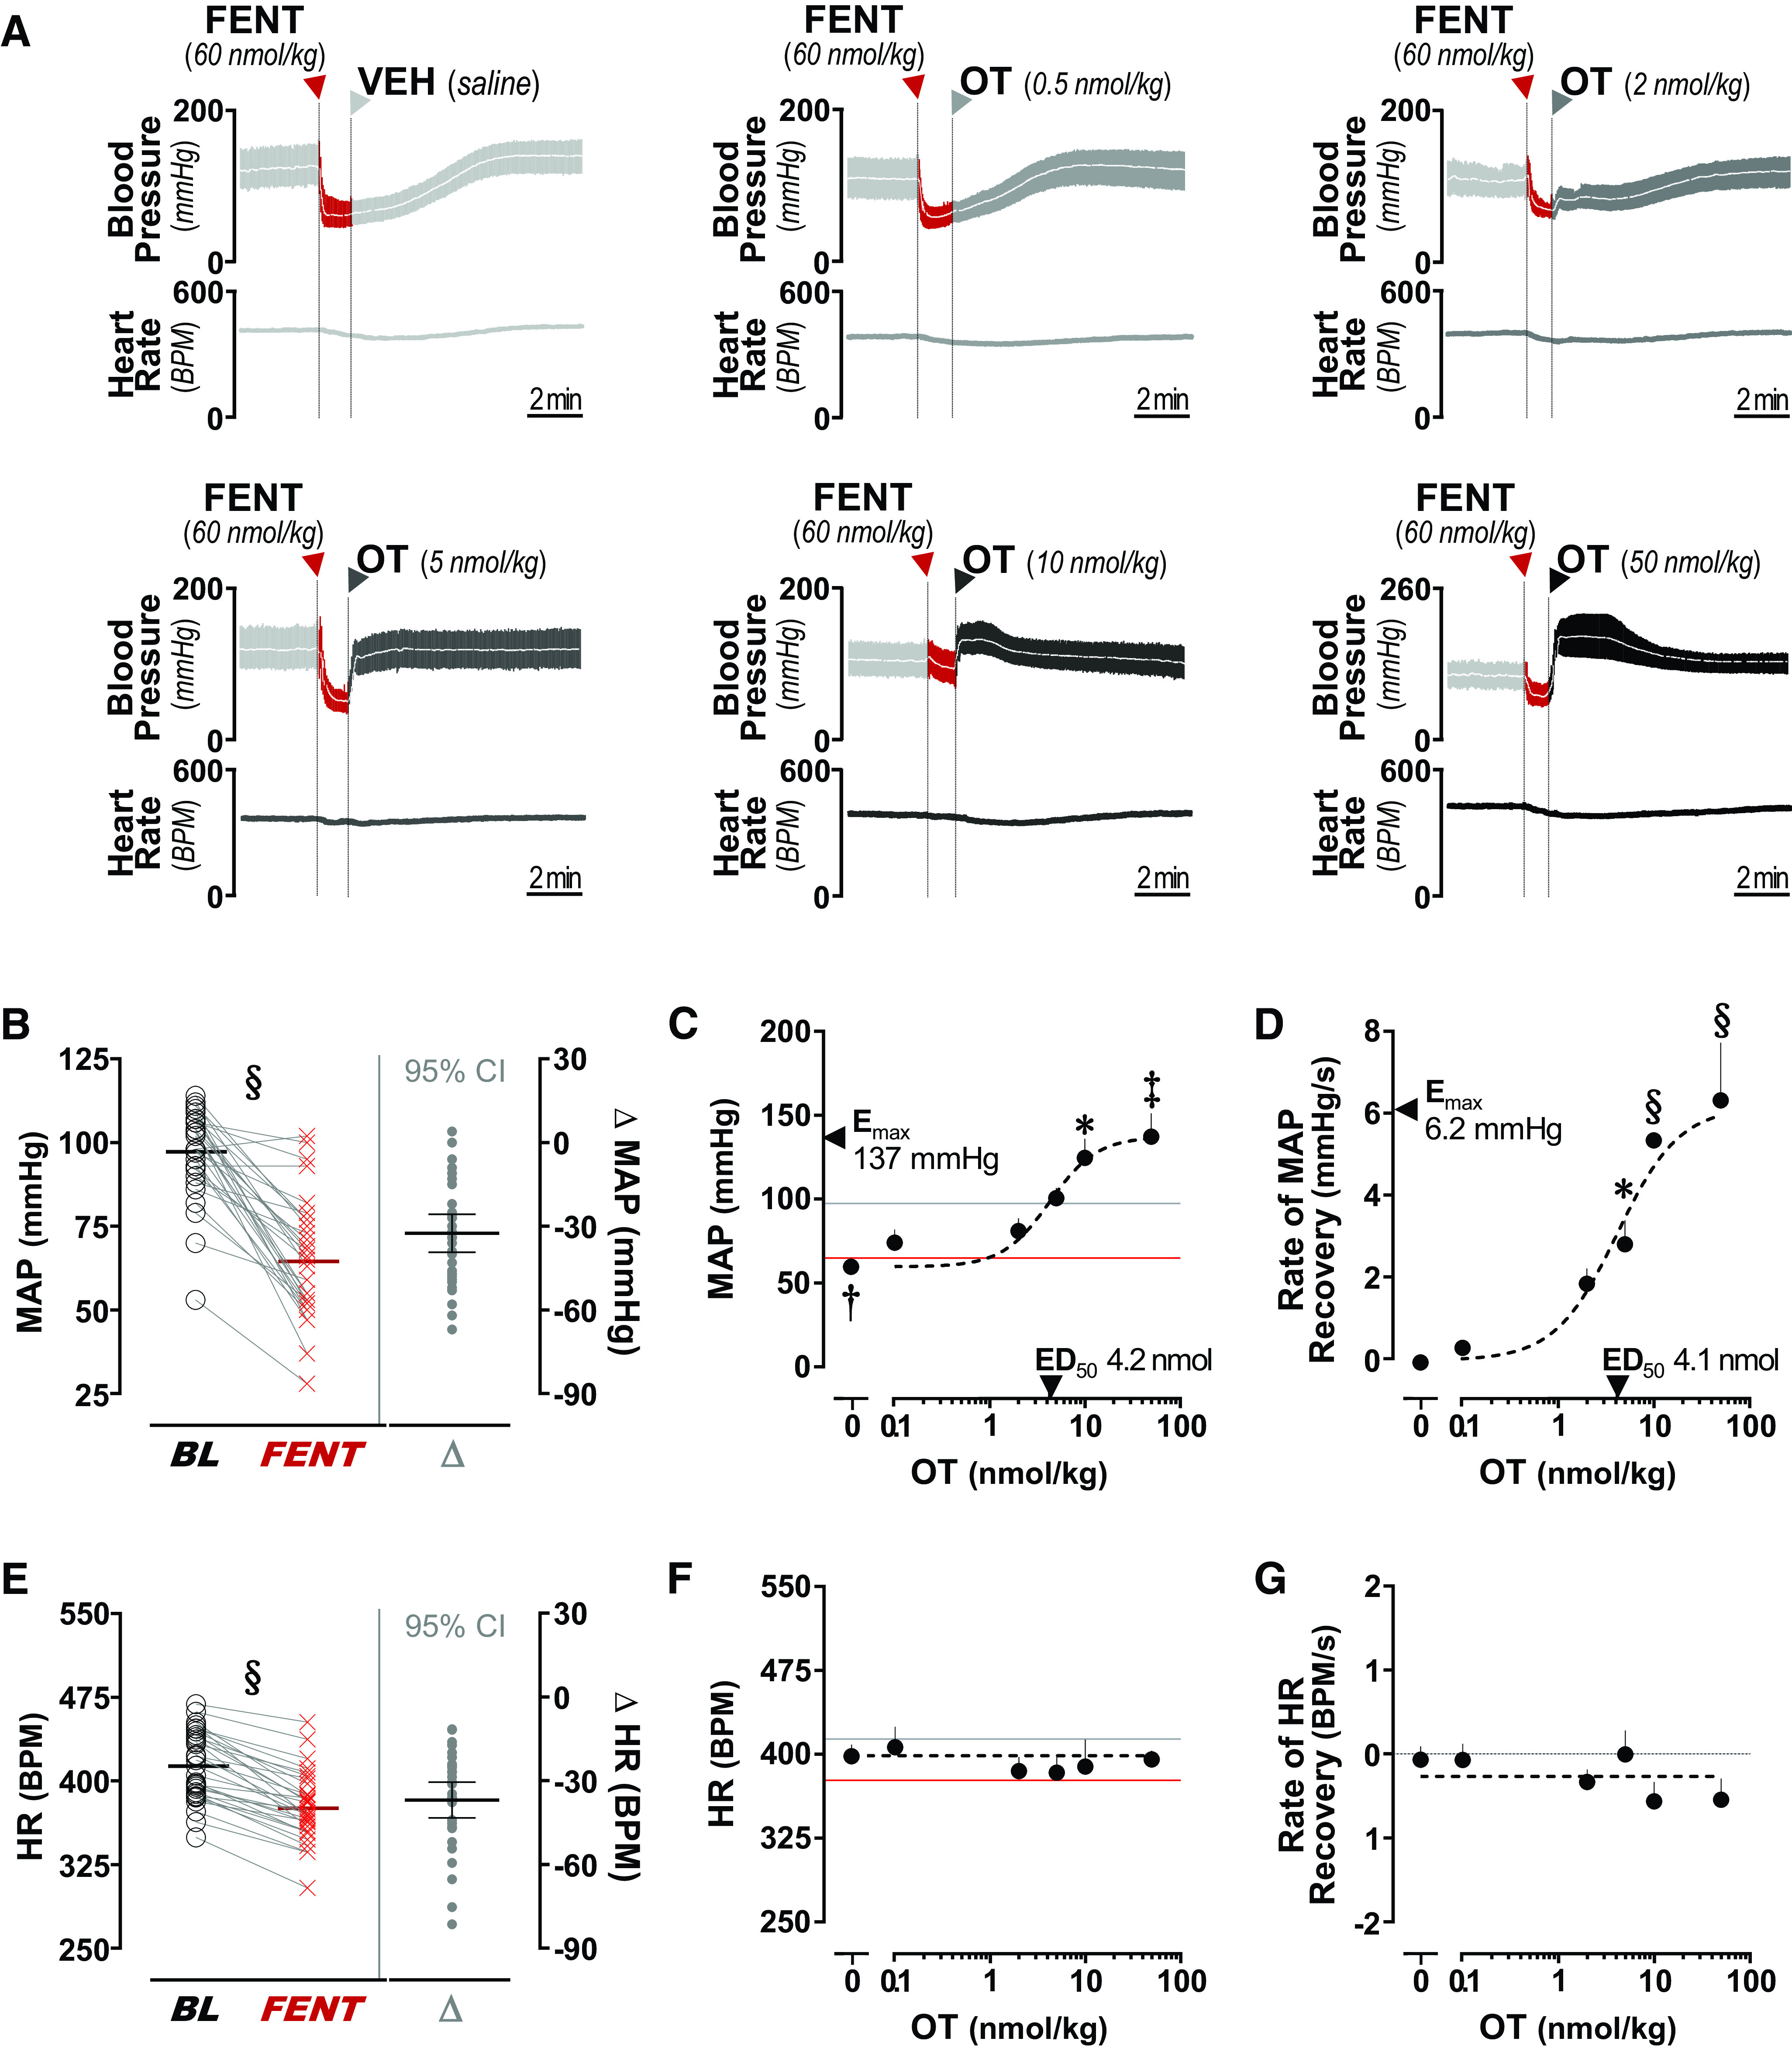
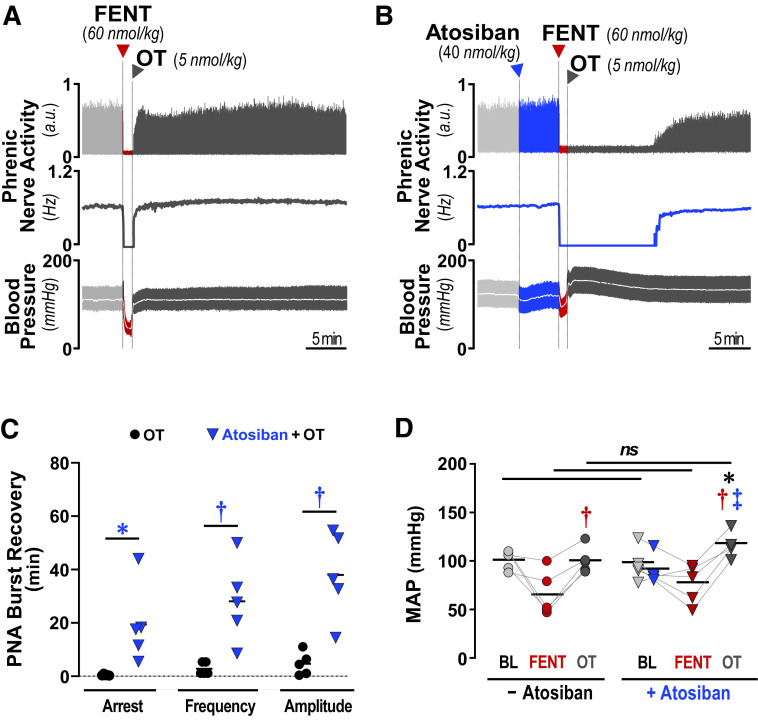
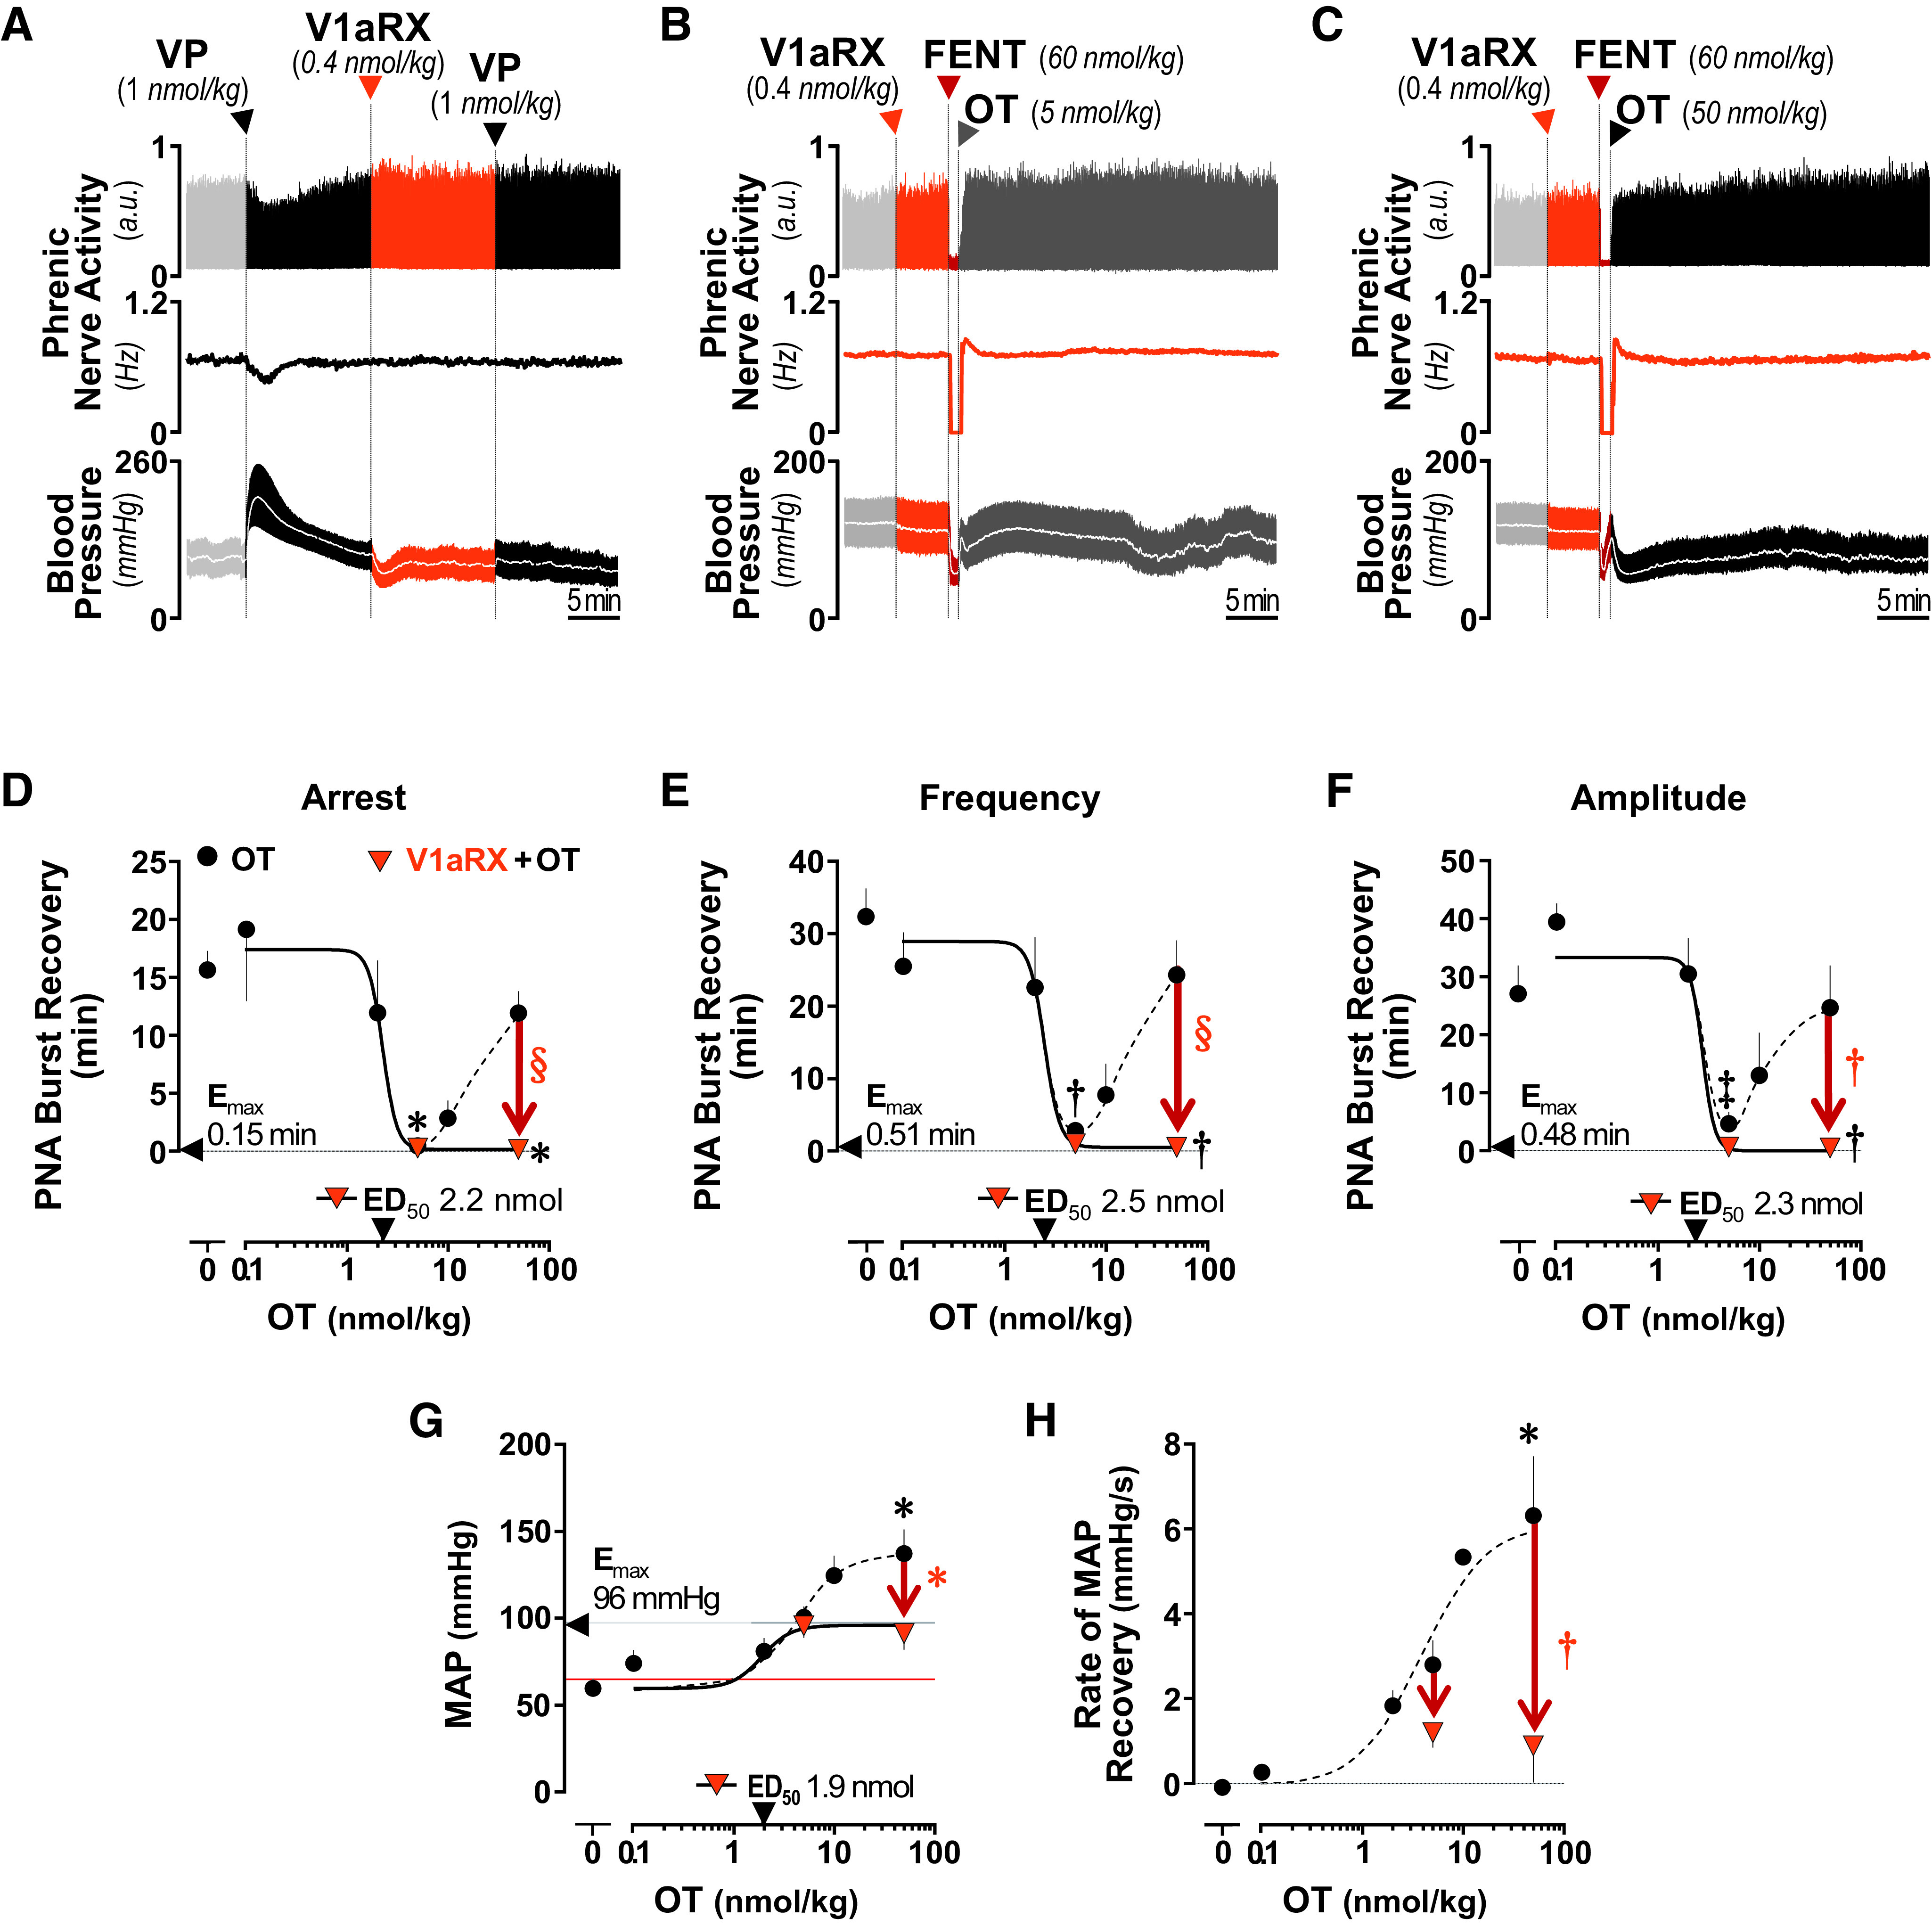
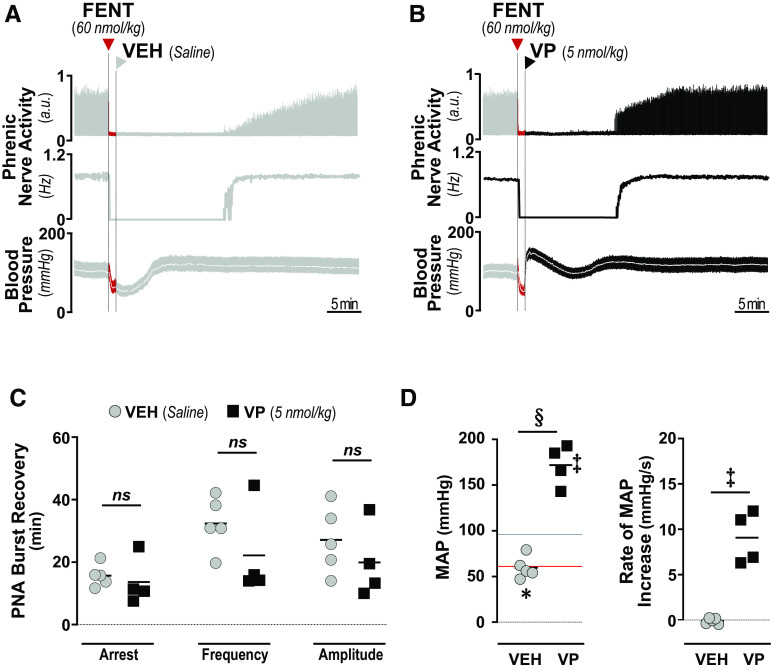
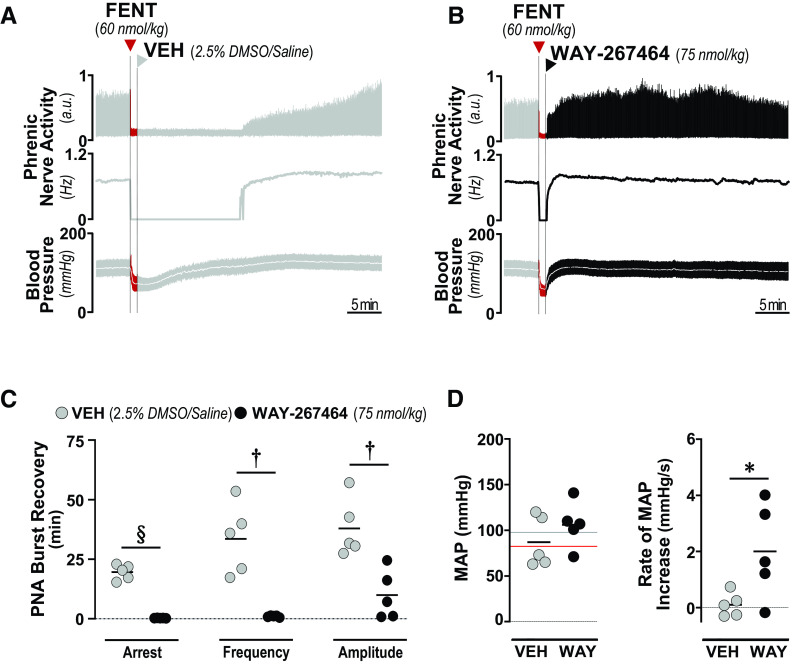
Opioid overdose intervention by naloxone, a high affinity receptor antagonist, reverses opioid-induced respiratory depression (OIRD) and analgesia by displacing opioids. Systemic naloxone stimulates release of the hypothalamic neuropeptide oxytocin, which has analgesic properties and participates in cardiorespiratory homeostasis. To test the hypothesis that oxytocin can reverse OIRD, we assessed the rescue potential of graded doses (0, 0.1, 2, 5, 10, 50 nmol/kg, i.v.) of oxytocin to counter fentanyl (60 nmol/kg, i.v.)-induced depression of neural inspiration indexed by recording phrenic nerve activity (PNA) in anesthetized (urethane/α-chloralose), vagotomized, and artificially ventilated rats. Oxytocin dose-dependently rescued fentanyl OIRD by almost immediately reversing PNA burst arrest (P = 0.0057) and restoring baseline burst frequency (P = 0.0016) and amplitude (P = 0.0025) at low but not high doses, resulting in inverted bell-shaped dose-response curves. Oxytocin receptor antagonism (40 nmol/kg, i.v.) prevented oxytocin reversal of OIRD (arrest: P = 0.0066, frequency: P = 0.0207, amplitude: P = 0.0022). Vasopressin 1A receptor (V1aR) antagonism restored high-dose oxytocin efficacy to rescue OIRD (P = 0.0170 to P < 0.0001), resulting in classic sigmoidal dose-response curves, and prevented (P = 0.0135) transient hypertension from V1aR cross-activation (P = 0.0275). Alone, vasopressin (5 nmol/kg, i.v.) failed to reverse fentanyl respiratory arrest (P = 0.6184). The nonpeptide oxytocin receptor agonist WAY-267464 (75 nmol/kg, i.v.), which has V1aR antagonist properties, quickly reversed fentanyl OIRD (P < 0.0001), with rapid recovery of PNA frequency (P = 0.0011) and amplitude (P = 0.0044) without adverse hemodynamic consequences (P = 0.9991). Findings indicate that peptide and nonpeptide agonist activation of oxytocin receptors without V1aR cross-activation rescues fentanyl OIRD. Oxytocin receptor agonists could be lifesaving resuscitation agents that enhance rather than interrupt opioid analgesia. SIGNIFICANCE STATEMENT: Oxytocin receptor activation produces analgesia. Here, we demonstrate that activation by the US Food and Drug Administration-approved agonist oxytocin and the nonpeptide partial agonist WAY-267464 can each reverse fentanyl cardiorespiratory depression. Selective targeting of oxytocin receptors for resuscitation from opioid overdose, alone or in combination with an opioid antagonist, could eliminate or attenuate negative side effects associated with traditional opioid receptor antagonism.
Copyright © 2021 by The American Society for Pharmacology and Experimental Therapeutics.
Figures
Similar articles
-
Intermittent hypercapnic hypoxia induces respiratory hypersensitivity to fentanyl accompanied by tonic respiratory depression by endogenous opioids.J Physiol. 2020 Aug;598(15):3239-3257. doi: 10.1113/JP280021. Epub 2020 Jun 14. J Physiol. 2020. PMID: 32415789 Free PMC article.
-
Peripheral opioid receptor antagonism alleviates fentanyl-induced cardiorespiratory depression and is devoid of aversive behavior.Elife. 2025 Apr 1;13:RP104469. doi: 10.7554/eLife.104469. Elife. 2025. PMID: 40167443 Free PMC article.
-
Activating α4β2 Nicotinic Acetylcholine Receptors Alleviates Fentanyl-induced Respiratory Depression in Rats.Anesthesiology. 2019 Jun;130(6):1017-1031. doi: 10.1097/ALN.0000000000002676. Anesthesiology. 2019. PMID: 31008764
-
Non-analgesic effects of opioids: opioid-induced respiratory depression.Curr Pharm Des. 2012;18(37):5994-6004. doi: 10.2174/138161212803582469. Curr Pharm Des. 2012. PMID: 22747535 Review.
-
Opioid-induced respiratory depression: clinical aspects and pathophysiology of the respiratory network effects.Am J Physiol Lung Cell Mol Physiol. 2025 Feb 1;328(2):L267-L289. doi: 10.1152/ajplung.00314.2024. Epub 2024 Dec 27. Am J Physiol Lung Cell Mol Physiol. 2025. PMID: 39726397 Review.
Cited by
-
Impact of Magnesium on Oxytocin Receptor Function.Pharmaceutics. 2022 May 21;14(5):1105. doi: 10.3390/pharmaceutics14051105. Pharmaceutics. 2022. PMID: 35631690 Free PMC article.
-
Neural Functions of Hypothalamic Oxytocin and its Regulation.ASN Neuro. 2022 Jan-Dec;14:17590914221100706. doi: 10.1177/17590914221100706. ASN Neuro. 2022. PMID: 35593066 Free PMC article. Review.
-
Structure-Based Design of Glycosylated Oxytocin Analogues with Improved Selectivity and Antinociceptive Activity.ACS Med Chem Lett. 2023 Jan 24;14(2):163-170. doi: 10.1021/acsmedchemlett.2c00455. eCollection 2023 Feb 9. ACS Med Chem Lett. 2023. PMID: 36793431 Free PMC article.
-
Vasopressin and Breathing: Review of Evidence for Respiratory Effects of the Antidiuretic Hormone.Front Physiol. 2021 Oct 26;12:744177. doi: 10.3389/fphys.2021.744177. eCollection 2021. Front Physiol. 2021. PMID: 34867449 Free PMC article. Review.
-
Non-Opioid Peptides Targeting Opioid Effects.Int J Mol Sci. 2021 Dec 19;22(24):13619. doi: 10.3390/ijms222413619. Int J Mol Sci. 2021. PMID: 34948415 Free PMC article. Review.
References
-
- Altura BM, Altura BT (1984) Actions of vasopressin, oxytocin, and synthetic analogs on vascular smooth muscle. Fed Proc 43:80–86. - PubMed
-
- American Society of Addiction Medicine (2020) The ASAM National Practice Guideline for the Treatment of Opioid Use Disorder: 2020 focused update. J Addict Med 14(2S, Suppl 1):1–91. - PubMed
-
- Atkinson RL, Suratt PM, Wilhoit SC, Recant L (1985) Naloxone improves sleep apnea in obese humans. Int J Obes 9:233–239. - PubMed
-
- Bicknell RJ, Zhao BG, Chapman C, Heavens RP, Sirinathsinghji DJ (1988) Opioid inhibition of secretion from oxytocin and vasopressin nerve terminals following selective depletion of neurohypophysial catecholamines. Neurosci Lett 93:281–286. - PubMed
MeSH terms
Substances
Grants and funding
LinkOut - more resources
Full Text Sources
Other Literature Sources
Medical
