. 2021 May 14;12(5):488.
doi: 10.1038/s41419-021-03774-w.

The endoribonuclease N4BP1 prevents psoriasis by controlling both keratinocytes proliferation and neutrophil infiltration

Affiliations

The endoribonuclease N4BP1 prevents psoriasis by controlling both keratinocytes proliferation and neutrophil infiltration

Chenliang Gou et al. Cell Death Dis. .

Abstract

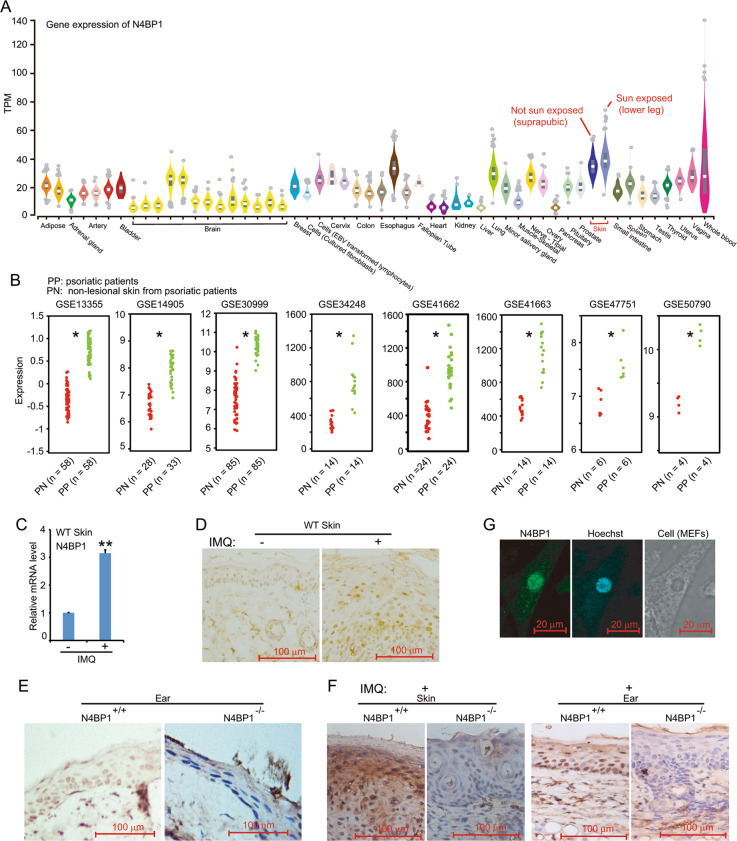
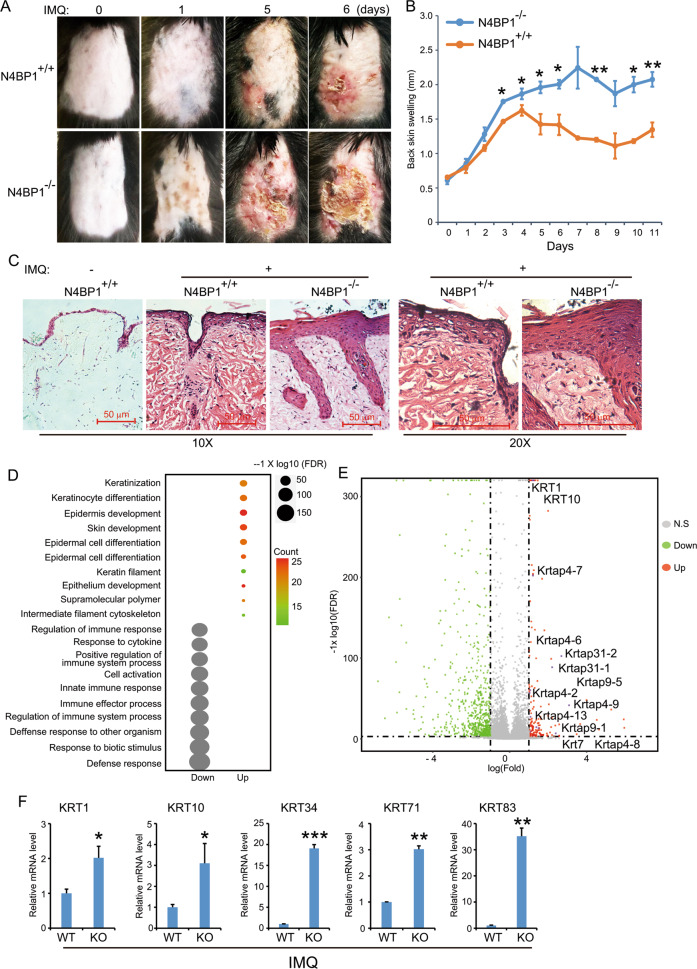
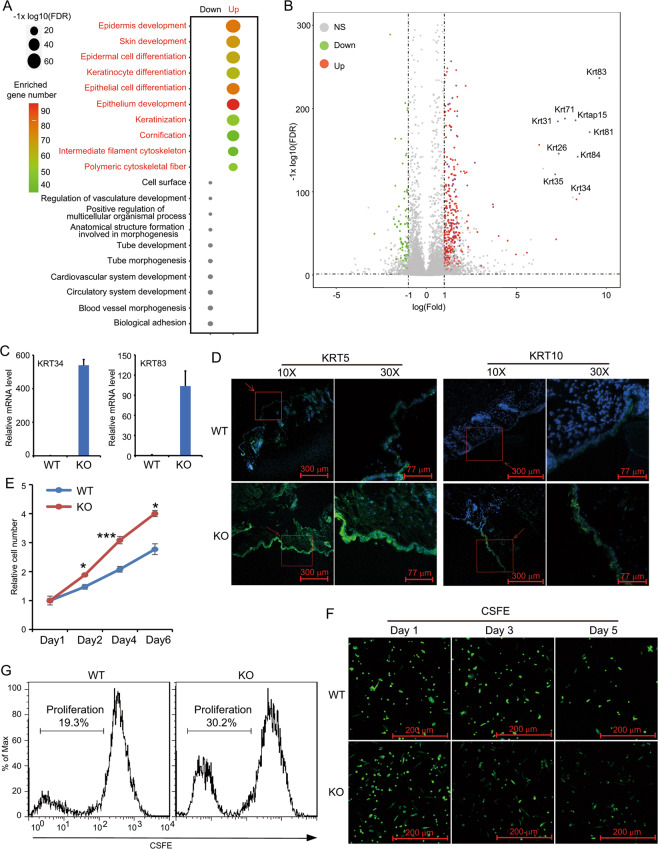
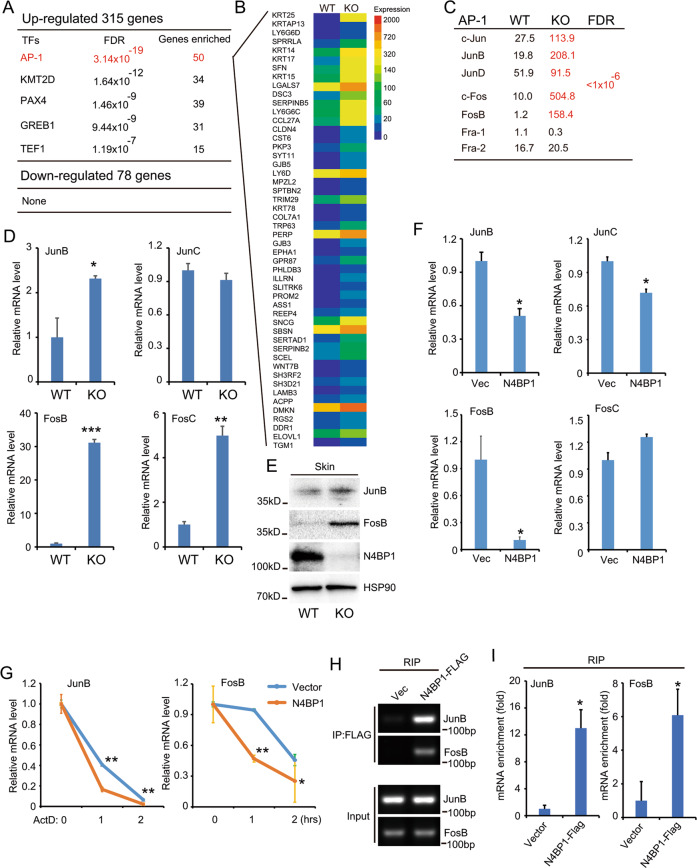
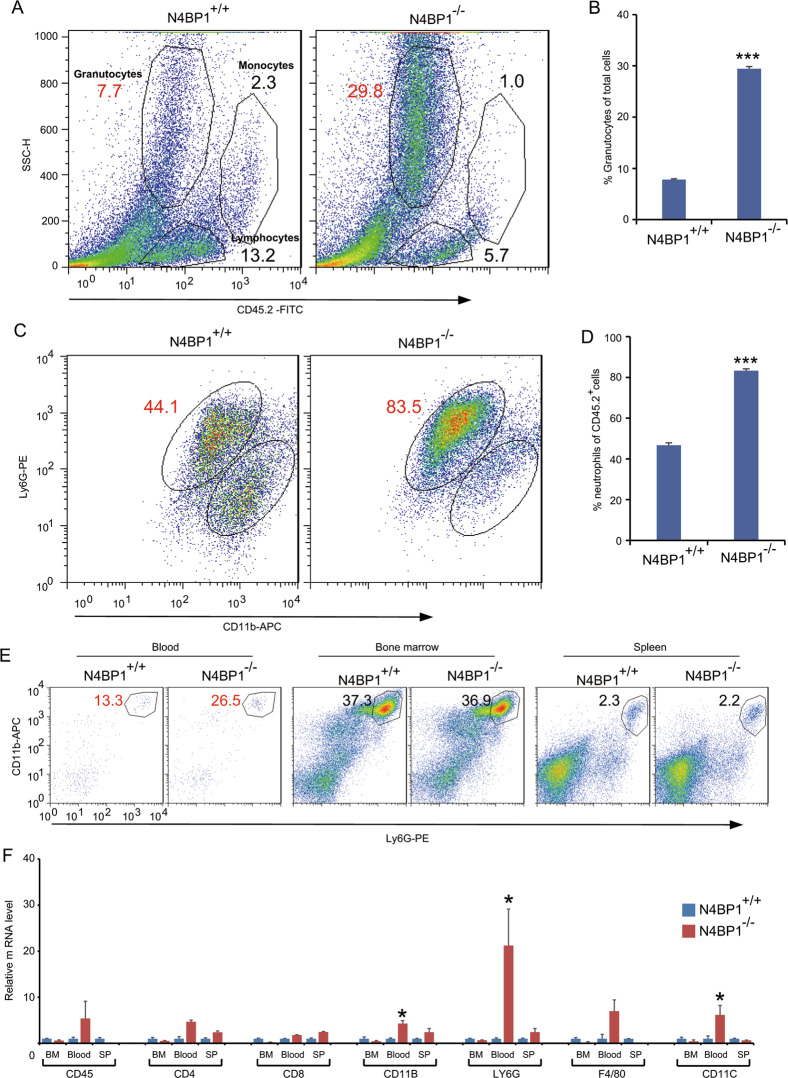
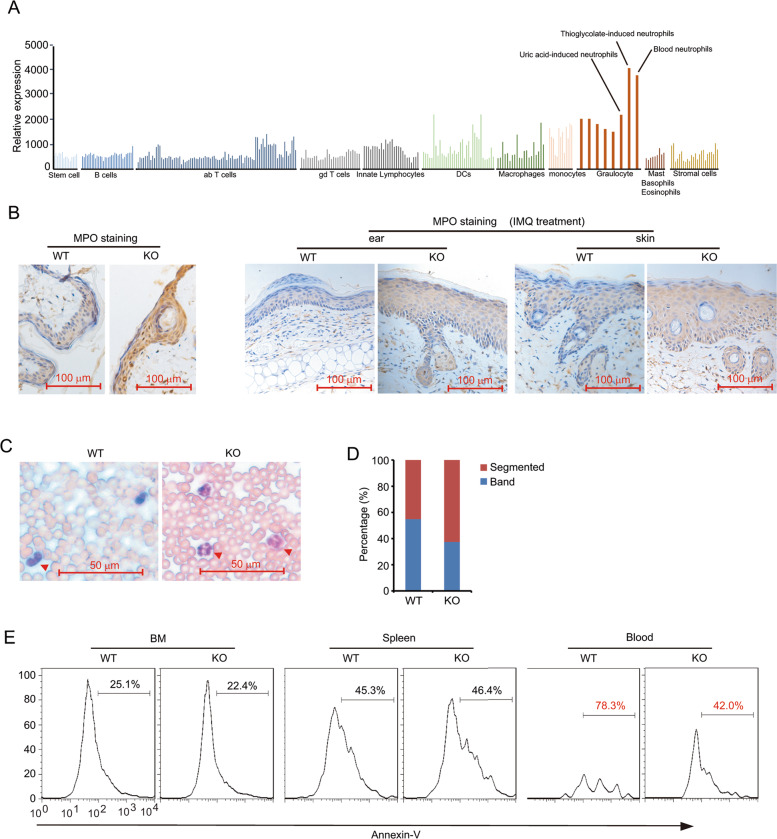
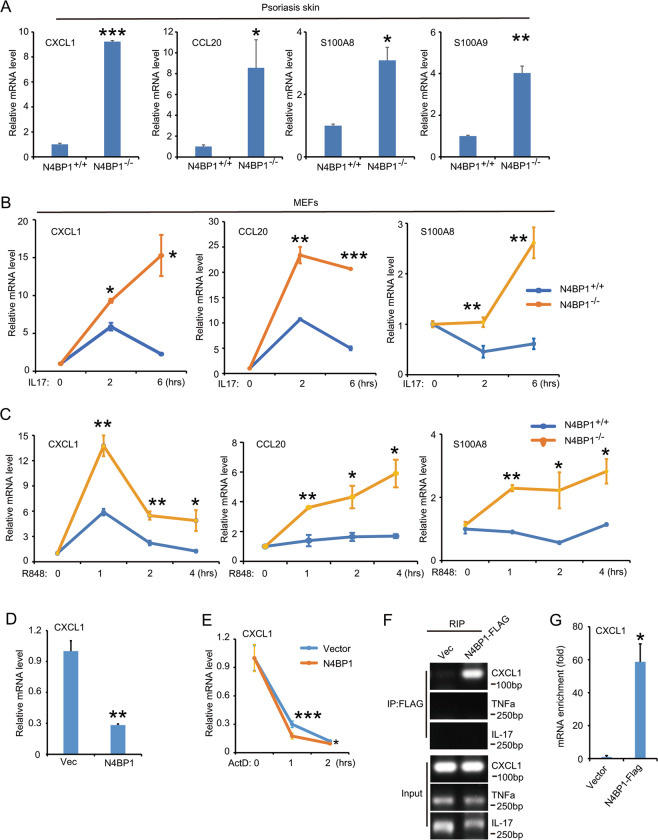
Psoriasis is a common chronic skin disease, characterized by abnormal interplay between hyperproliferative epidermal keratinocytes and self-reactive immune cells with not fully addressed molecular mechanism. N4BP1 (NEDD4-binding protein 1) is considered as an immune regulator for a long time but its physiological role is not determined yet. Here, we found that the expression of N4BP1 in skin was highest among all 54 tested tissues, and its expression was further upregulated in psoriatic skin. N4BP1-deficient mice exhibited normal grossly, but developed severe and prolonged IMQ-induced psoriasis-like disease comparing to controls. N4BP1 mainly expressed in keratinocytes and located on nucleus. Up- but not downregulated genes in N4BP1-deficient skin were specifically enriched in keratinocyte proliferation and differentiation. The proliferation of N4BP1-deficient primary keratinocytes was faster compared to that of controls. The upregulated genes upon ablation of N4BP1 were highly enriched in targets of AP-1 transcription factor. Knocking out N4BP1 resulted in upregulation of JunB and FosB, and conversely, overexpression of N4BP1 greatly reduced their expression. Furthermore, N4BP1 binds with JunB and FosB encoding mRNAs and greatly reduces their stability. In addition, with a high expression in neutrophils, N4BP1 limits survival of neutrophils in blood and infiltration of neutrophils in psoriatic skin by targeting CXCL1, CCL20, and S100A8. These findings demonstrate that N4BP1 controls the proper function of keratinocytes and neutrophils by negatively regulating JunB, FosB, and CXCL1, respectively, and that is critical for psoriasis prevention.


Conflict of interest statement

The authors declare no competing interests.

Figures

Fig. 1
Fig. 1. The characteristics of N4BP1 in skin and patients with psoriasis.
A The raw data (Version 7) of RNA-seq from Genotype-Tissue Expression (GTEx) program was downloaded and reanalyzed (https://gtexportal.org/home). The relative expression of N4BP1 in 54 human tissues was present. B The raw data of RNA array were downloaded from following GEO datasets (GSE13355, GSE14905, GSE30999, GSE34248, GSE41662, GSE41663, GSE47751, and GSE50790). Both RNA array and RNA-seq data were reanalyzed. The expression of N4BP1 in lesioned and non-lesioned skin from each psoriatic patient was demonstrated as each dot. C The expression of N4BP1 in normal and IMQ-induced psoriatic skin from back of mice was examined by real-time RT-PCR. D The expression of N4BP1 in normal and IMQ-induced psoriatic skin from back of mice was examined by immunohistochemistry. E The expression of N4BP1 was examined by immunohistochemistry using anti-N4BP1 antibodies in N4BP1 wild-type and knockout mice from ear skin. F The expression of N4BP1 in IMQ-induced psoriatic skin from back and ear was examined by immunohistochemistry in N4BP1 wild-type and knockout mice. G The intracellular distribution of N4BP1 was determined by immunofluorescence in mouse embryonic fibroblasts (MEFs). The images (D, E, F, G) show representative data from one of three independent experiments. Data (C) from one of three experiments are shown. *P < 0.05; **P < 0.01.
Fig. 2
Fig. 2. N4BP1-deficient mice develop severe and prolonged IMQ-induced psoriasis-like disease.
A Representative photos of IMQ-induced psoriatic skin of N4BP1 wild-type and knockout mice. B Thickness of back skin from lesioned location of N4BP1 wild-type and knockout mice. C Hematoxylin and eosin staining of representative skin sections from indicated each group. D The most profoundly up- or downregulated genes in IMQ-treated N4BP1 knockout mice were subjected to analyze the enrichment of GO biological process by using online GSEA (geneset enrichment analysis) program. The enriched GO biological processes was shown. E Volcano plot was used to present the results of RNA-seq from IMQ-treated back skin between N4BP1 wild-type and knockout mice. The most-upregulated genes encoding keratins and keratin-associated proteins were labeled. F The upregulated genes encoding keratins including KRT1, KRT10, KRT34, KRT71, and KRT83 were further examined in IMQ-treated skin from N4BP1 wild-type and knockout mice by real-time RT-PCR analysis. The images show representative data from one of three independent experiments. The images (A, C) show representative data from one of three independent experiments. Data (B, F) from one of three experiments are shown. Statistical differences between groups were determined by the Student’s t-test. *P < 0.05; **P < 0.01; ***P < 0.001.
Fig. 3
Fig. 3. N4BP1 regulates keratinocytes proliferation and differentiation.
A The most differentially expressed genes between N4BP1 wild-type and knockout skin were subjected to analyze the enrichment of GO biological process using online GSEA (geneset enrichment analysis) program. Both down- and upregulated genes from the enriched GO biological processes were shown. B Volcano plot was used to present the results of RNA-seq between N4BP1 wild-type and knockout back skin. The most-upregulated genes encoding keratins and keratin-associated proteins were shown. C The u-regulated genes encoding keratins including KRT34 and KRT83 were further examined in skin from N4BP1 wild-type and knockout mice by RT-PCR. D Immunofluorescence analysis of KRT5 and KRT10 in N4BP1 wild-type and knockout skin. E The cell number of keratinocytes isolated from N4BP1 wild-type and knockout was determined by CCK8 assay. F The isolated keratinocytes from N4BP1 wild-type and knockout mice skin were labeled with CFSE fluorescence and further cultured in indicated dates. The fluorescence was captured by fluorescence microscopy. G The CFSE labeled N4BP1 wild-type and knockout keratinocytes were cultured in vitro for 5 days. The fluorescence was examined by FACS. The images (D, F, G) show representative data from one of three independent experiments. Data (C, E) from one of three experiments are shown. Statistical differences between groups were determined by the Student’s t-test. *P < 0.05; **P < 0.01; ***P < 0.001.
Fig. 4
Fig. 4. N4BP1 negatively regulates JUNB and FOSB.
A The most up- and downregulated genes between N4BP1 wild-type and knockout mice skin were subjected to all transcription factor targets analysis (https://www.gsea-msigdb.org/). Among 315 most-upregulated genes, 50 genes are targets of AP-1 transcription factor. B The list of 50 targets of AP-1 and their expression change between N4BP1 wild-type and knockout mice skin. C The expression of AP-1 family (c-Jun, JunB, JunD, c-Fos, FosB, Fra-1, and Fra-2) in N4BP1 wild-type and knockout mice skin was examined by RNA-seq. D The mRNA level of JunB, JunC, FosB, and FosC was determined by real-time RT-PCR in N4BP1 wild-type and knockout mice skin. E The protein level of JunB and FosB was examined by Western analysis in N4BP1 wild-type and knockout mice skin. F The mRNA level of JunB, JunC, FosB, and FosC was determined by real-time RT-PCR in N4BP1 stable overexpressed HeLa cells. G The control and N4BP1 stable expressed HeLa cells were treated with actinomycin (20 uM) for indicated time and the mRNA of JunB and FosB were examined by real-time RT-PCR. H The RNA immunoprecipitation was performed using anti-FLAG antibodies in FLAG-N4BP1 stable overexpressed cells and their controls. The presence of RNA was determined by RT-PCR. I The RNA immunoprecipitation was performed by anti-FLAG antibodies in FLAG-N4BP1 stable overexpressed cells and their controls. The level of RNA was determined by real-time RT-PCR and normalized to the amount of input. The images (E, H) show representative data from one of three independent experiments. Data (D, F, G, I) from one of three experiments are shown. Statistical differences between groups were determined by the Student’s t-test. *P < 0.05; **P < 0.01; ***P < 0.001.
Fig. 5
Fig. 5. Increased neutrophil recruitment in N4BP1-deficient mice.
A Cells were isolated from N4BP1 wild-type and knockout skin treated with IMQ. Cells were stained by CD45.2-FITC and analyzed by FACS. Shown are representative plots from one of three independent experiments. B The quantification of Granulocytes from A. C Cells were isolated from N4BP1 wild-type and knockout skin treated with IMQ. Cells were stained by CD45.2-FITC, LY6G-PE, and CD11B-APC antibodies, and analyzed by FACS. Shown are representative plots from one of three independent experiments. D The quantification of neutrophils from C. E Cells were isolated from N4BP1 wild-type and knockout mice blood and stained by CD45.2-FITC, LY6G-PE, and CD11B-APC antibodies then analyzed by FACS. F The total RNA from bone marrow, blood, and spleen of N4BP1 wild-type and knockout mice were extracted. The mRNA levels of genes including CD45, CD4, CD8, CD11B, LY6G, F4/80, and CD11C were determined by real-time RT-PCR. The images (A, C, E) show representative data from one of three independent experiments. Data (F) from one of three experiments are shown. Statistical differences between groups were determined by the Student’s t-test. *P < 0.05; **P < 0.01; ***P < 0.001.
Fig. 6
Fig. 6. N4BP1 controls neutrophil maturation.
A The expression level of immune cells was loaded from the immunological genome project (www.immgen.org). The figure was regenerated and reorganized. N4BP1 shows highest expression in neutrophil among all immune cell subtypes. B MPO staining in N4BP1 wild-type and knockout mice skin with or without IMQ treatment. C Giemsa stain is used to examine the neutrophil of the blood smear from N4BP1 wild-type and knockout mice blood. D The percentage of segmented and band neutrophil in the blood smear from N4BP1 wild-type and knockout mice blood. E Cells from bone marrow, spleen, and blood were isolated and cultured in vitro for 24 h. Then these cells were stained by CD45.2, LY6G, and Annexin-V antibodies. The percentage of Annexin-V-positive neutrophils were analyzed by FACS. The images (B, C, E) show representative data from one of three independent experiments.
Fig. 7
Fig. 7. N4BP1 negatively regulates CXCL1 CCL20, S100A8, and S100A9.
A The mRNA level of CXCL1, CCL20, S100A8, and S100A9 was determined in psoriatic skin from N4BP1 wild-type and knockout mice. B MEFs were isolated from N4BP1 wild-type and knockout mice and treated with IL-17 (20 ug/ml) for indicated hours. The mRNA level of CXCL1, CCL20, and S100A8 was determined by real-time RT-PCR. C The N4BP1 wild-type and knockout MEFs were treated with R848 (10 uM) for indicated hours. The mRNA level of CXCL1, CCL20, and S100A8 was determined by real-time RT-PCR. D The mRNA level of CXCL1 was determined by real-time RT-PCR in N4BP1 stable overexpressed HeLa cells. E The control and N4BP1 stable expressed HeLa cells were treated with actinomycin (20 uM) for indicated time and the mRNA of CXCL1 were examined by real-time RT-PCR. F The RNA immunoprecipitation was performed using anti-FLAG antibodies in FLAG-N4BP1 stable overexpressed cells and their control cells. The presence of RNA (CXCL1, TNFa, and IL-17) was determined by RT-PCR. G The RNA immunoprecipitation was performed using anti-FLAG antibodies in FLAG-N4BP1 stable overexpressed cells and their control cells. The level of RNA was determined by real-time RT-PCR and normalized to the amount of input. The images (F) show representative data from one of three independent experiments. Data (A, B, C, D, E, G) from one of three experiments are shown. Statistical differences between groups were determined by the Student’s t-test. *P < 0.05; **P < 0.01; ***P < 0.001.

References

    1. Nestle FO, Kaplan DH, Barker J. Psoriasis. N. Engl. J. Med. 2009;361:496–509. doi: 10.1056/NEJMra0804595. - DOI - PubMed
    1. Rendon A, Schakel K. Psoriasis pathogenesis and treatment. Int. J. Mol. Sci. 2019;20:1475. doi: 10.3390/ijms20061475. - DOI - PMC - PubMed
    1. Billi AC, Gudjonsson JE, Voorhees JJ. Psoriasis: past, present, and future. J. Invest. Dermatol. 2019;139:e133–e142. doi: 10.1016/j.jid.2019.08.437. - DOI - PMC - PubMed
    1. Boehncke WH, Brembilla NC. Unmet needs in the field of psoriasis: pathogenesis and treatment. Clin. Rev. Allergy Immunol. 2018;55:295–311. doi: 10.1007/s12016-017-8634-3. - DOI - PubMed
    1. Furue M, Furue K, Tsuji G, Nakahara T. Interleukin-17A and keratinocytes in psoriasis. Int. J. Mol. Sci. 2020;21:1275. doi: 10.3390/ijms21041275. - DOI - PMC - PubMed

Publication types