. 2021 May 14;12(1):2826.
doi: 10.1038/s41467-021-22724-w.

Molecular mechanisms of ion conduction and ion selectivity in TMEM16 lipid scramblases

Affiliations

Molecular mechanisms of ion conduction and ion selectivity in TMEM16 lipid scramblases

Andrei Y Kostritskii et al. Nat Commun. .

Abstract

TMEM16 lipid scramblases transport lipids and also operate as ion channels with highly variable ion selectivities and various physiological functions. However, their molecular mechanisms of ion conduction and selectivity remain largely unknown. Using computational electrophysiology simulations at atomistic resolution, we identified the main ion-conductive state of TMEM16 lipid scramblases, in which an ion permeation pathway is lined by lipid headgroups that directly interact with permeating ions in a voltage polarity-dependent manner. We found that lipid headgroups modulate the ion-permeability state and regulate ion selectivity to varying degrees in different scramblase isoforms, depending on the amino-acid composition of the pores. Our work has defined the structural basis of ion conduction and selectivity in TMEM16 lipid scramblases and uncovered the mechanisms responsible for the direct effects of membrane lipids on the conduction properties of ion channels.


Conflict of interest statement

The authors declare no competing interests.

Figures

Fig. 1
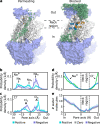
Fig. 1. nhTMEM16 assumes the main ion-conductive state in the fully open conformation.
a Dimeric structure of the nhTMEM16 lipid scramblase, with helices lining the subunit cavity shown in cyan. b, c Fully open (b) and intermediate (c) conformations of the subunit cavity (represented by the 4WIS and 6QMA structures, respectively), together with schematics of the corresponding ion conduction models. Transmembrane domains (TM) 4 and 6 bordering the subunit cavity are indicated. Ions are shown as green and blue spheres and lipids are represented by orange headgroups and black tails. d Dependence of the percentage of conductive protomers in simulations of intermediate or fully open structures of nhTMEM16 on the mean-conductance threshold used to distinguish conductive and nonconductive states. The inset shows the mean conductance calculated globally as ratio between number of permeation events and the simulation time since a first permeation event. ni = 16, nfo = 39 independent protomers, p = 0.03. e Instantaneous conductance of nhTMEM16 in the intermediate (i) and fully open (fo) conformations. ni = 16, nfo = 39 independent protomers, p = 0.02. Median values are labeled. f Pore hydration (number of water molecules in the extracellular part of the subunit cavity) was calculated separately for conductive and nonconductive (no permeations) nhTMEM16 protomers and protomers in the absence of voltage (no voltage). Intermediate: nnv = 4, nnp = 23, nc = 16 independent protomers, pnv,np = 0.006, pnv,c = 0.002, pnp,c = 0.00003; Fully open: nnv = 8, nnp = 1, nc = 39 independent protomers, pnv,c = 0.002. df Each data point represents an independent protomer, and boxplots are defined as follows: the middle line is the median, the lower and upper hinges correspond to the first and third quartiles, whiskers show the 5th and 95th percentiles. Significance was evaluated with the Mann–Whitney test, one-sided: *p < 0.05, **p < 0.01, ****p < 0.0001.
Fig. 2
Fig. 2. Structured within the subunit cavity, lipid headgroups demonstrate voltage polarity-dependent arrangement.
a, b Snapshots showing the upward orientation of lipid headgroups at positive voltages (a) and downward orientation at negative voltages (b), along with enlargements of the cavity region. Headgroups within the cavity and key residues that stabilize their arrangement are highlighted (phosphorus, nitrogen, oxygen, and carbon atoms are shown in orange, blue, red, and white, respectively). The transmembrane part of the protein is shown in white. c Local probability density distribution of POPC phosphorus atoms along the subunit cavity. Localization sites (pc and pe) are labeled. d Distribution of angle between a lipid headgroup and the outward membrane normal, where 0 and 180 indicate upright and downright orientations, respectively. e Local probability density distribution of POPC nitrogen atoms along the subunit cavity. Localization sites (nc and ne) are labeled. ce Distributions were calculated with respect to the pore center. Average distributions across independent protomer simulations are shown, with error bars and shaded areas representing the standard error of mean. Data were derived from n = 8, n = 19, and n = 21 independent protomers at zero, positive, and negative voltages, respectively.
Fig. 3
Fig. 3. Ion-permeation pathway and neck region of the proteolipidic pore.
a Snapshots showing the trajectories of permeating (left) and blocked (right) Cl ions visiting the nhTMEM16 pore region in a representative system with the protein at a negative voltage. Each green sphere represents a particular position of a Cl ion in a single frame of the simulation. The neck region (indicated by dashed lines) is visited only by permeating ions. Contoured at 20σ, meshes represent the density of the four phosphorus (orange) and nitrogen (blue) atoms of POPC located nearest to the pore center. The localization sites of headgroup moieties (nc, pc, ne, and pe) within the cavity are indicated. b, c Probability density distributions of permeating Na+ (b) and Cl (c) ions along the pore. Ion-localization sites (Nai, Nav, Nae, Clv, Cle) are indicated. In b data were derived from n = 18 and n = 13 independent protomers at positive and negative voltages, respectively. In c data were derived from n = 17 and n = 22 independent protomers at positive and negative voltages, respectively. d Probability density distributions of blocked Cl and Na+ ions along the pore. Data were derived from n = 44 independent protomers. e Hydration profile of the pore, represented by the number of water molecules in 1 Å sections along the pore axis. Data were derived from n = 8, n = 19, and n = 21 independent protomers at zero, positive, and negative voltages, respectively. be Error bars represent the standard error of mean.
Fig. 4
Fig. 4. Lipid headgroups control the permeability state of the pore.
a The minimum in-plane distance between the ion permeation pathway and the nitrogen or phosphorus atoms of POPC headgroups was measured at the indicated headgroup localization sites of the open (o) and closed (c) states of the pore in the fully open conformation. The central (pc and nc) and extracellular (pe and ne) sites were used for the analysis of the efflux (left) and influx (right), respectively. Each data point represents an independent protomer, and boxplots are defined as follows: the middle line is the median, the lower and upper hinges correspond to the first and third quartiles, whiskers show the 5th and 95th percentiles. Significance was evaluated with the Mann–Whitney test, one-sided: p > 0.05 (n.s.), *p < 0.05, ***p < 0.001. Number of data points and p values (no, nc, p): top row—(13, 16, 0.034), (17, 18, 0.00003), (12, 18, 0.5), (9, 17, 0.0009); and bottom row—(13, 17, 0.01), (20, 19, 0.00004), (11, 13, 0.3), (12, 15, 0.07). b Schematic representation of the efflux of fully hydrated (water oxygens shown in red) Cl ions (green) through the pore in the open state and of the blockage of permeation by lipid headgroups (orange and blue) in the central part of the pore. TM5 transmembrane domain 5.
Fig. 5
Fig. 5. Ion selectivity of nhTMEM16 depends on voltage polarity, membrane lipid composition, and salt concentration.
ac The number of nhTMEM16 protomers in a certain selectivity class in a pure POPC membrane (a) and a POPC:POPS (1:1) membrane at either 250 mM NaCl (b) or 1 M NaCl (c) is shown for positive (left) and negative (right) voltages. A protomer was considered to be nonselective if its permeability ratio was <2 (gray), moderately selective if it was 2–10 (pale green and pale blue), and selective if it was ≥10 (green and blue). Results are shown only for protomers that had undergone at least five ion permeation events by the end of the simulation.
Fig. 6
Fig. 6. Structure and properties of the TMEM16K proteolipidic pore.
a, b Snapshots showing the arrangement of lipid headgroups within the subunit cavity of TMEM16K at positive (a) and negative (b) voltages. Lipid headgroups within the cavity and the key residues coordinating them are highlighted, with phosphorus, nitrogen, oxygen, and carbon atoms shown in orange, blue, red, and white, respectively. The part of the protein within the hydrophobic core of the membrane is shown in white. c, d Local probability density distributions of the phosphorus (c) and nitrogen (d) atoms of POPC along the subunit cavity. Localization sites (n0, p1, n1, p2, n2, p3, n3, p4, n4, and n5) are labeled. e Distribution of angles between a lipid headgroup and the outward membrane normal, where 0 and 180 indicate the upright and downright orientations, respectively. f Hydration profile of the pore, represented by the number of water molecules in 1-Å sections along the pore axis. cf Data were derived from n = 4, n = 14, and n = 14 independent protomers at zero, positive, and negative voltages, respectively. g Probability density distributions of blocked Cl and Na+ ions along the pore. Data were derived from n = 28 independent protomers. cg The distributions were calculated relative to the pore center. The average distributions over the independent protomer simulations are shown, with error bars and shaded areas representing the standard error of mean.
Fig. 7
Fig. 7. Structural determinants of TMEM16K cation selectivity.
a Percentages of simulated protomers that demonstrate various levels of ion selectivity in nhTMEM16 and TMEM16K simulations. Data on ion selectivity for both positive and negative voltages were combined. b Alignment of nhTMEM16 and TMEM16K sequences at the regions forming the intracellular (TM3 and TM6) and extracellular (TM4 and TM7) entrances of the pore and containing negatively and positively charged residues highlighted in red and blue, respectively. TM transmembrane domain. c Snapshots showing the distribution of charged residues within the subunit cavities of nhTMEM16 and TMEM16K. Oxygen and nitrogen atoms of the side chains are colored red and blue, respectively.

Similar articles

Cited by

References

    1. Caputo A, et al. TMEM16A, a membrane protein associated with calcium-dependent chloride channel activity. Science. 2008;322:590–594. doi: 10.1126/science.1163518. - DOI - PubMed
    1. Schroeder BC, Cheng T, Jan YN, Jan LY. Expression cloning of TMEM16A as a calcium-activated chloride channel subunit. Cell. 2008;134:1019–1029. doi: 10.1016/j.cell.2008.09.003. - DOI - PMC - PubMed
    1. Yang YD, et al. TMEM16A confers receptor-activated calcium-dependent chloride conductance. Nature. 2008;455:1210–1215. doi: 10.1038/nature07313. - DOI - PubMed
    1. Pedemonte N, Galietta LJV. Structure and function of TMEM16 proteins (anoctamins) Physiol. Rev. 2014;94:419–459. doi: 10.1152/physrev.00039.2011. - DOI - PubMed
    1. Yang H, et al. TMEM16F forms a Ca2+ -activated cation channel required for lipid scrambling in platelets during blood coagulation. Cell. 2012;151:111–122. doi: 10.1016/j.cell.2012.07.036. - DOI - PMC - PubMed

Publication types

MeSH terms

Supplementary concepts

LinkOut - more resources