

bric à brac controls sex pheromone choice by male European corn borer moths
- PMID: 33990556
- PMCID: PMC8121916
- DOI: 10.1038/s41467-021-23026-x
bric à brac controls sex pheromone choice by male European corn borer moths
Abstract
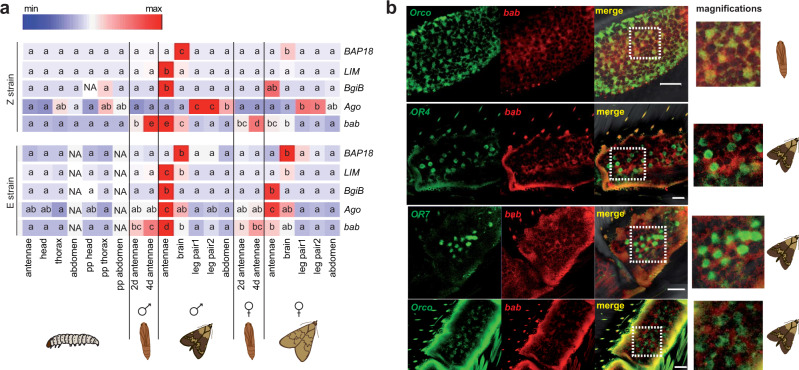
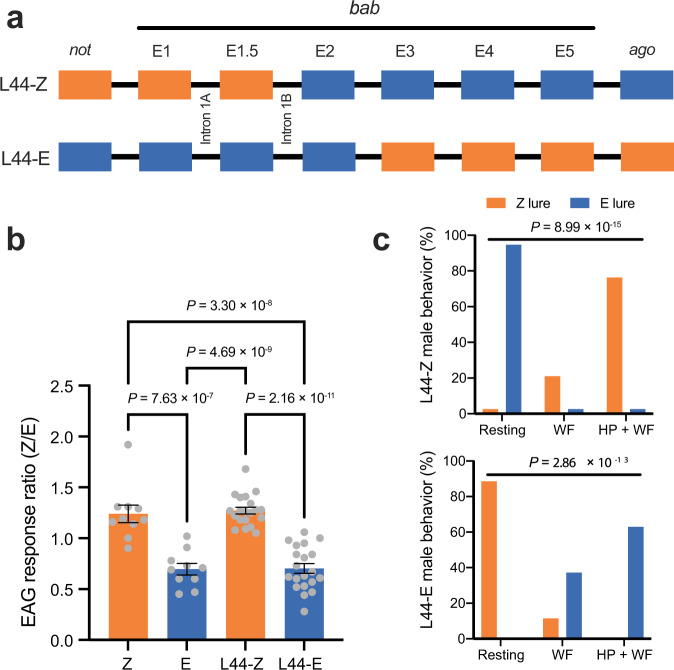
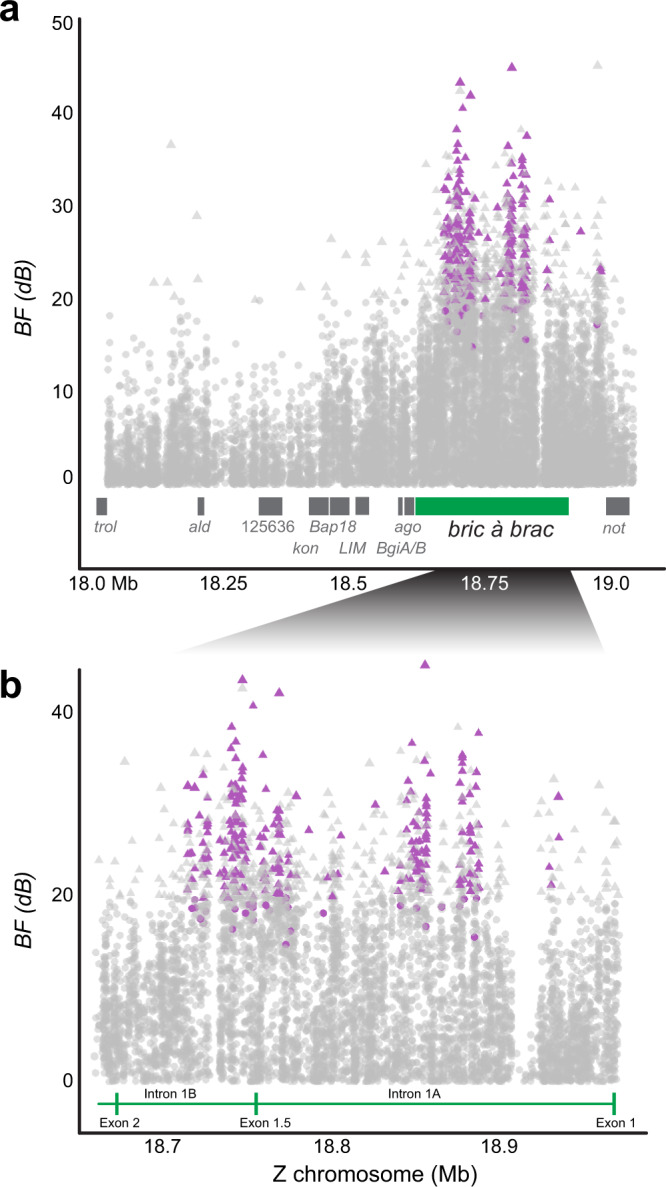
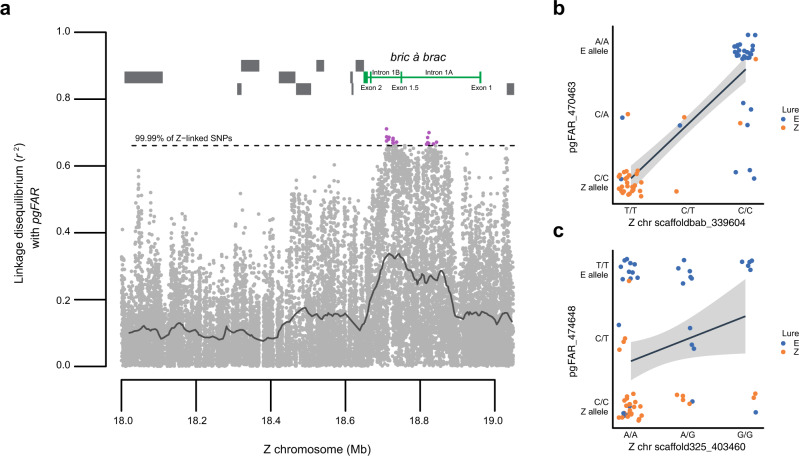
The sex pheromone system of ~160,000 moth species acts as a powerful form of assortative mating whereby females attract conspecific males with a species-specific blend of volatile compounds. Understanding how female pheromone production and male preference coevolve to produce this diversity requires knowledge of the genes underlying change in both traits. In the European corn borer moth, pheromone blend variation is controlled by two alleles of an autosomal fatty-acyl reductase gene expressed in the female pheromone gland (pgFAR). Here we show that asymmetric male preference is controlled by cis-acting variation in a sex-linked transcription factor expressed in the developing male antenna, bric à brac (bab). A genome-wide association study of preference using pheromone-trapped males implicates variation in the 293 kb bab intron 1, rather than the coding sequence. Linkage disequilibrium between bab intron 1 and pgFAR further validates bab as the preference locus, and demonstrates that the two genes interact to contribute to assortative mating. Thus, lack of physical linkage is not a constraint for coevolutionary divergence of female pheromone production and male behavioral response genes, in contrast to what is often predicted by evolutionary theory.
Conflict of interest statement
The authors declare no competing interests.
Figures
Similar articles
-
Functional consequences of sequence variation in the pheromone biosynthetic gene pgFAR for Ostrinia moths.Proc Natl Acad Sci U S A. 2013 Mar 5;110(10):3967-72. doi: 10.1073/pnas.1208706110. Epub 2013 Feb 13. Proc Natl Acad Sci U S A. 2013. PMID: 23407169 Free PMC article.
-
Evolution of multicomponent pheromone signals in small ermine moths involves a single fatty-acyl reductase gene.Proc Natl Acad Sci U S A. 2010 Jun 15;107(24):10955-60. doi: 10.1073/pnas.1000823107. Epub 2010 Jun 1. Proc Natl Acad Sci U S A. 2010. PMID: 20534481 Free PMC article.
-
Genetic isolation between two sympatric host-plant races of the European corn borer, Ostrinia nubilalis Hübner. I. Sex pheromone, moth emergence timing, and parasitism.Evolution. 2003 Feb;57(2):261-73. doi: 10.1111/j.0014-3820.2003.tb00261.x. Evolution. 2003. PMID: 12683523
-
The Genetic Basis of Pheromone Evolution in Moths.Annu Rev Entomol. 2016;61:99-117. doi: 10.1146/annurev-ento-010715-023638. Epub 2015 Nov 4. Annu Rev Entomol. 2016. PMID: 26565898 Review.
-
Mechanism for saltational shifts in pheromone communication systems.Proc Natl Acad Sci U S A. 2002 Oct 15;99(21):13368-70. doi: 10.1073/pnas.222539799. Epub 2002 Oct 8. Proc Natl Acad Sci U S A. 2002. PMID: 12374851 Free PMC article. Review. No abstract available.
Cited by
-
Is beauty beyond the eye of the butterfly?PLoS Biol. 2025 Mar 12;23(3):e3003054. doi: 10.1371/journal.pbio.3003054. eCollection 2025 Mar. PLoS Biol. 2025. PMID: 40073041 Free PMC article.
-
The genome sequence of the European Corn Borer, Ostrinia nubilalis Hübner, 1796.Wellcome Open Res. 2025 Jan 14;10:12. doi: 10.12688/wellcomeopenres.23504.1. eCollection 2025. Wellcome Open Res. 2025. PMID: 40007688 Free PMC article.
-
Rapid brain development and reduced neuromodulator titres correlate with host shifts in Rhagoletis pomonella.R Soc Open Sci. 2022 Sep 7;9(9):220962. doi: 10.1098/rsos.220962. eCollection 2022 Sep. R Soc Open Sci. 2022. PMID: 36117862 Free PMC article.
-
A single point mutation causes one-way alteration of pheromone receptor function in two Heliothis species.iScience. 2021 Aug 16;24(9):102981. doi: 10.1016/j.isci.2021.102981. eCollection 2021 Sep 24. iScience. 2021. PMID: 34485863 Free PMC article.
-
Genetic, developmental, and neural changes underlying the evolution of butterfly mate preference.PLoS Biol. 2025 Mar 11;23(3):e3002989. doi: 10.1371/journal.pbio.3002989. eCollection 2025 Mar. PLoS Biol. 2025. PMID: 40067994 Free PMC article.
References
-
- Rosenthal, G. G. Mate Choice: The Evolution of Sexual Decision Making from Microbes to Humans (Princeton University Press, 2017).
-
- Groot, A. T., Dekker, T. & Heckel, D. G. In AnnualReview of Entomology Vol. 61 (ed Berenbaum, M. R.) 99−+ (Annual Reviews, 2016). - PubMed
Publication types
MeSH terms
Substances
LinkOut - more resources
Full Text Sources
Other Literature Sources
