. 2021 May 14;12(1):2829.
doi: 10.1038/s41467-021-22871-0.

PHC1 maintains pluripotency by organizing genome-wide chromatin interactions of the Nanog locus

Affiliations

PHC1 maintains pluripotency by organizing genome-wide chromatin interactions of the Nanog locus

Li Chen et al. Nat Commun. .

Abstract

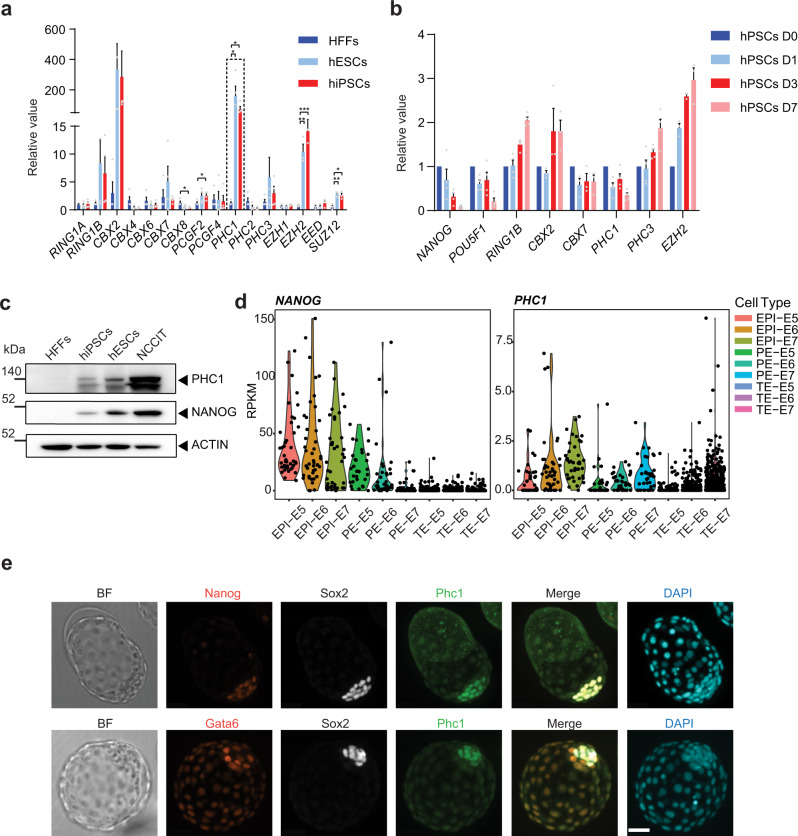
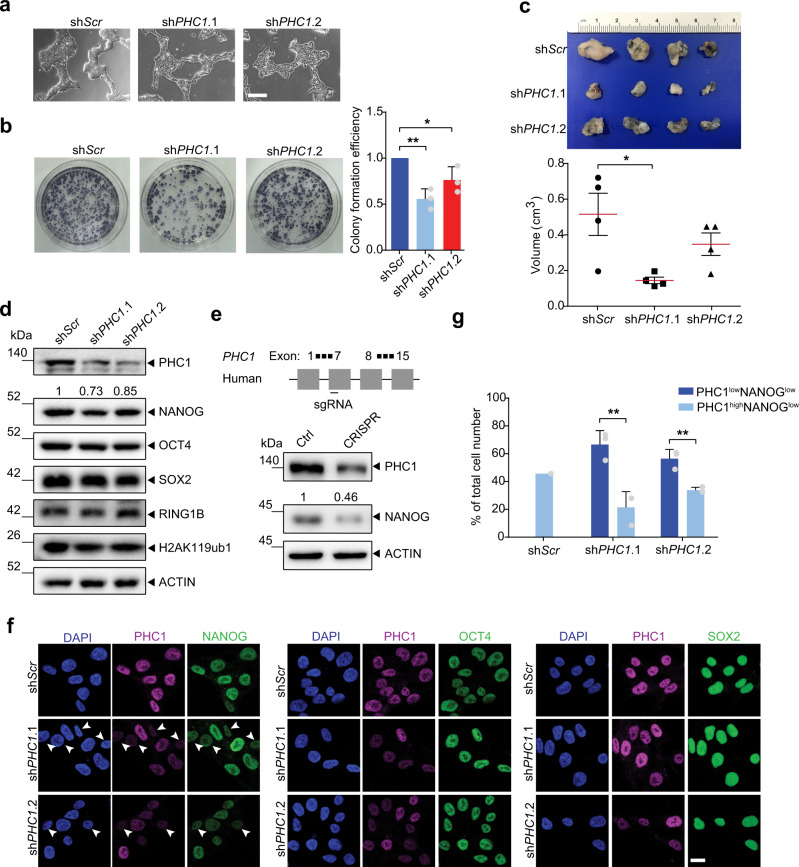
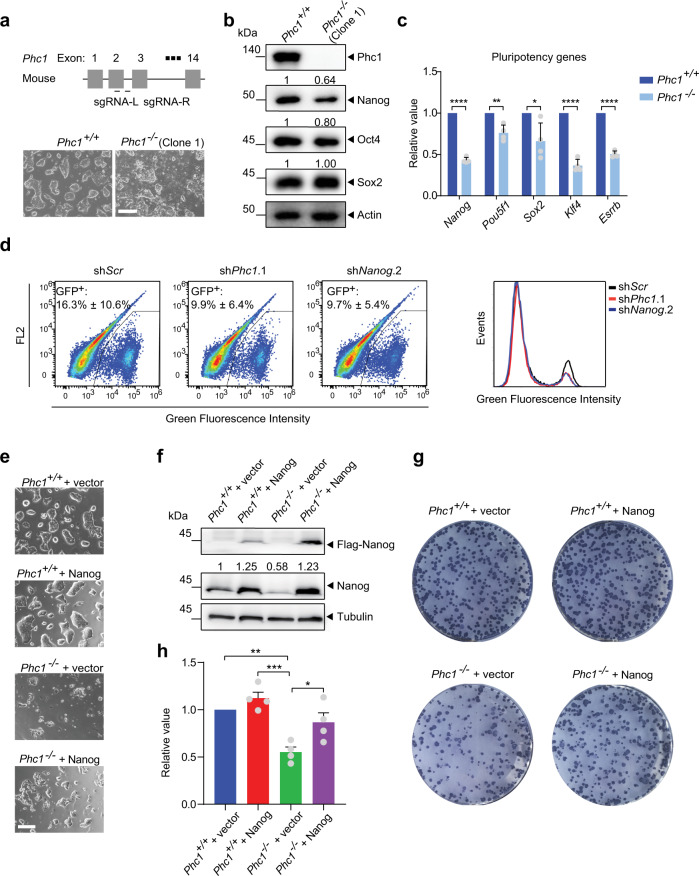
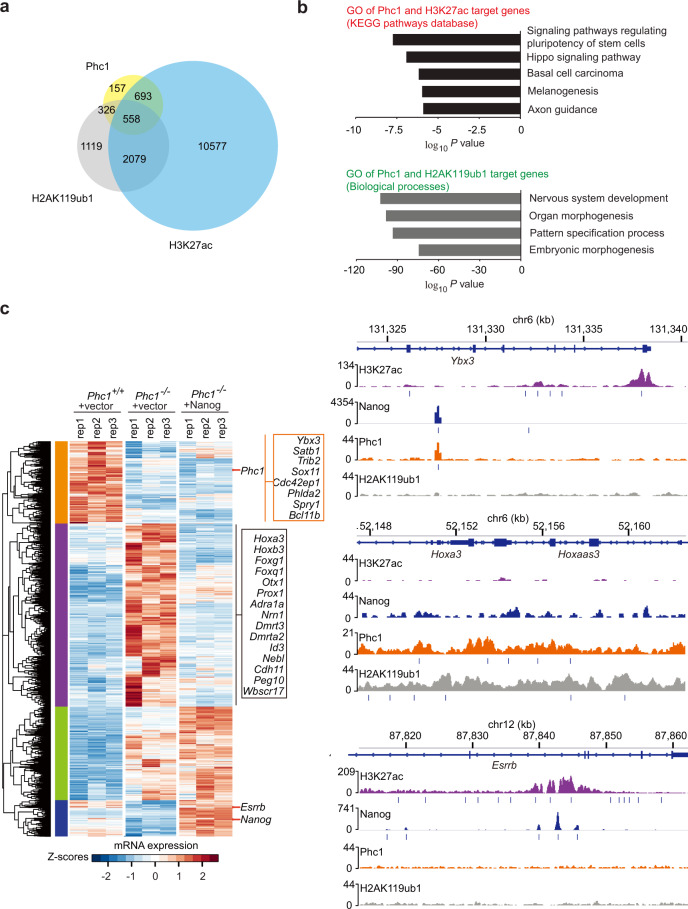
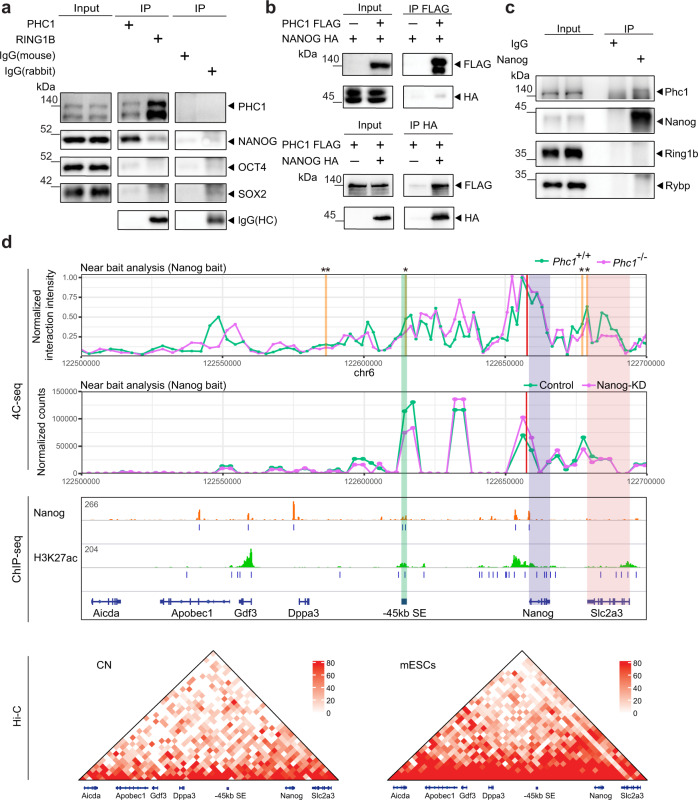
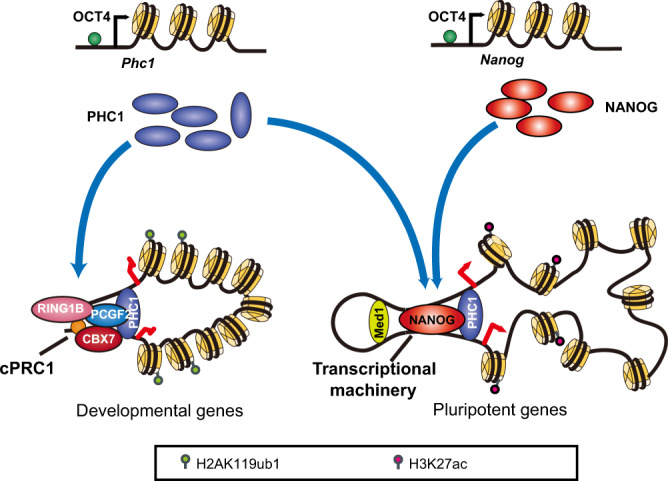
Polycomb group (PcG) proteins maintain cell identity by repressing gene expression during development. Surprisingly, emerging studies have recently reported that a number of PcG proteins directly activate gene expression during cell fate determination process. However, the mechanisms by which they direct gene activation in pluripotency remain poorly understood. Here, we show that Phc1, a subunit of canonical polycomb repressive complex 1 (cPRC1), can exert its function in pluripotency maintenance via a PRC1-independent activation of Nanog. Ablation of Phc1 reduces the expression of Nanog and overexpression of Nanog partially rescues impaired pluripotency caused by Phc1 depletion. We find that Phc1 interacts with Nanog and activates Nanog transcription by stabilizing the genome-wide chromatin interactions of the Nanog locus. This adds to the already known canonical function of PRC1 in pluripotency maintenance via a PRC1-dependent repression of differentiation genes. Overall, our study reveals a function of Phc1 to activate Nanog transcription through regulating chromatin architecture and proposes a paradigm for PcG proteins to maintain pluripotency.


Conflict of interest statement

The authors declare no competing interests.

Figures

Fig. 1
Fig. 1. PHC1 is highly expressed in both human and mouse pluripotent cells.
a PRC1 and PRC2 gene expression was examined by RT-qPCR in HFFs, hESCs, and hiPSCs. ACTIN was used as the house keeping gene and expression was normalized to HFFs. n = 4 independent experiments for PRC1 genes; n = 3 independent experiments for PRC2 genes including EZH1, EZH2, EED, and SUZ12. Error bars represent the s.e.m. Two-tailed unpaired t-tests were used (p = 0.0256 for CBX8, p = 0.0201 for PCGF2, p = 0.0498 for PHC1 in HFFs vs. ESCs, p = 0.0104 for PHC1 in HFFs vs. iPSCs, **p = 0.0022 for EZH2, ***p = 0.0003 for EZH2, **p = 0.0034 for SUZ12, *p = 0.0111 for SUZ12). b Expressions of PRC1 and PRC2 genes and key pluripotency factors POU5F1 and NANOG during embryoid body differentiation (D0–D7) of hPSCs were examined by RT-qPCR. n = 3 independent experiments for CBX2, CBX7, and EZH2; n = 4 independent experiments for the other genes. Error bars represent the s.e.m. c WB analysis of PHC1 and NANOG protein expression in hPSCs and HFFs. d Analysis of the published single-cell RNA-seq data of early human embryos (E5–7) showing expression of NANOG and PHC1 in epiblast (Epi), primitive endoderm (PE), and trophectoderm (TE). e Co-immunostaining of Phc1 with Nanog and Sox2, or Gata6 and Sox2 in mouse E4.5 embryos. Scale bars, 31 μm. Source data are provided as a Source Data file.
Fig. 2
Fig. 2. PHC1 is required for the pluripotency maintenance of hESCs.
a, b Morphology and colony-forming capacity of shScr-, shPHC1.1-, and shPHC1.2-infected hESCs. Scale bars, 600 μm. Cells were stained for alkaline phosphatase activity 14 or 18 days after plating. Bar plot shows mean colony-formation efficiencies normalized to the shScr. Mean ± s.d. of n = 3 independent experiments. Two-tailed unpaired t-tests were used (**p = 0.0022, *p = 0.0458). c Comparison of tumor sizes about 1 month after injection of shScr-, and shPHC1-infected hESCs into NOD/SCID mice. Data are presented as mean ± s.e.m. In each group, 4 NOD/SCID mice were injected. Two-tailed unpaired t-tests were used (*p = 0.0211). d WB analysis of PHC1, NANOG, OCT4, SOX2, RING1B, H2AK119ub1, and ACTIN protein levels in shScr and shPHC1-infected hESCs. e WB analysis of PHC1 and NANOG protein levels in hESCs infected with control and CRISPR-CAS9 vector targeting human PHC1 gene. f Immunofluorescent co-staining of PHC1 with NANOG, OCT4, or SOX2 in shScr- and shPHC1-infected hESCs. Arrowheads showed cells with low PHC1 and NANOG signals. Scale bars, 20 μm. g The ratios of cells exhibiting PHC1highNANOGlow and PHClowNANOGlow signals to the total number of stained cells in (f) were quantified. Mean ± s.d. of n = 3 independent counts for shPHC1.1 and shPHC1.2. Two-tailed unpaired t-tests were used (p = 0.0065 for shPHC1.1, p = 0.0048 for shPHC1.2). Source data are provided as a Source Data file.
Fig. 3
Fig. 3. Phc1 maintains pluripotency of mESCs partly through Nanog.
a Designing sgRNAs targeting the 2nd exon and 3rd intron of mouse Phc1, and the morphology of the Phc1+/+ and Phc1−/− mESCs. Scale bars, 300 μm. b WB analysis of Phc1, Nanog, Oct4, Sox2, and Actin protein levels in the Phc1+/+ and Phc1−/− mESCs. c qPCR analysis of transcript levels of Pou5f1, Sox2 Nanog, and its known direct target genes including Klf4 and Esrrb. Mean ± s.d. of n = 4 independent experiments. Two-tailed t-tests were used (p < 0.0001 for Nanog; p = 0.0023 for Pou5f1; p = 0.0216 for Sox2; p < 0.0001 for Klf4; p < 0.0001 for Esrrb). d Flow cytometry analysis quantifying GFP signal after Phc1 knockdown in a mESC line carrying the Nanog-GFP reporter. Nanog suppression was used as the positive control. Mean ± s.d. of n = 3 independent experiments. e Morphology of Phc1+/+ and Phc1−/− mESCs transfected with an empty or Flag-Nanog vector. Scale bars, 600 μm. f Immunoblotting of Flag, Nanog, and Tubulin in extracts of mESCs in (e). g Alkaline phosphatase staining of mESCs in (e). h Quantification of colony-forming efficiencies of mESCs relative to Phc1+/+ + vector as the control in (e). Mean ± s.e.m. of n = 4 independent experiments. One-way ANOVA test with Bonferroni’s multiple comparison was used (**p = 0.0024, ***p = 0.0003, *p = 0.0319). Source data are provided as a Source Data file.
Fig. 4
Fig. 4. Phc1 maintains pluripotency of mESCs in both PRC1-dependent and PRC1-independent regulation of Nanog.
a Venn diagram analysis of genes bound by Phc1, H2AK119ub1, and H3K27ac in mESCs,. b GO analysis of signaling pathways of Phc1 and H3K27ac target genes and biological functions of genes co-occupied by Phc1 and H2AK119ub1. p values are plotted in –log10. c The Phc1+/+ + vector, Phc1−/− + vector, and Phc1−/− + Nanog mESCs were profiled in triplicate for RNA-seq experiments. Genes that were significantly up- or down-regulated in Phc1−/− + vector compared with the Phc1+/+ + vector cells were clustered across all samples and were shown as heatmaps. Each row represents one gene and each column represents one sample. The Phc1-activated genes that were not changed by Nanog overexpression were shown as orange cluster and that were induced by Nanog were classified as blue cluster. Genes that were repressed by both Phc1 and Nanog were defined as purple cluster. The Phc1-repressed genes but not repressed by Nanog were shown as green cluster. The IGV image showing H3K27ac, Nanog, Phc1, and H2AK119ub1 ChIP-seq binding profiles of representative genes from orange and purple cluster genes,,. Source data are provided as a Source Data file.
Fig. 5
Fig. 5. PHC1 interacts with NANOG and organizes genome-wide chromatin interactions of the Nanog locus.
a Co-immunoprecipitation (Co-IP) from total hESC extracts using antibodies against RING1B and PHC1 followed by immunoblotting of different proteins. b Co-IPs of nuclear extracts from HEK293T cells transfected with PHC1-FLAG and NANOG-HA followed by immunoblotting. c IP of nuclear extracts from mESCs using an antibody against Nanog and immunoblotting of Phc1, Ring1b, Rybp, and Nanog, respectively. d Top panel: Interaction profile showing the normalized interaction intensity (y axis) of regions with the Nanog promoter (anchor) in chr6: 122500000-122700000 of mm9 genome assembly (x axis) in Phc1+/+ (green line) and Phc1−/− (purple line) mESCs. Regions with significant decreases in Phc1−/− than Phc1+/+ mESCs were highlighted and statistical significance was indicated with asterisk. n = 4 independent experiments. Paired single-side t-tests were used (from left to right p values are 0.0090, 0.0234, 0.0379, and 0.0304, respectively). Middle panel: Analysis of the previously published 4C-seq datasets showing interaction profile of genomic regions near the Nanog promoter (empirical anchor) in chr6: 122500000-122700000 of mm9 genome assembly in control (green line) and Nanog KD (purple line) mESCs; H3K27ac and Nanog ChIP-seq binding profiles in the corresponding regions,. Bottom panel: Hi-C interaction matrices of mouse cortical neurons (CNs) and mESCs in chr6: 122500000-122700000 of mm9 genome assembly, respectively. Source data are provided as a Source Data file.
Fig. 6
Fig. 6. Proposed model.
Phc1, similar to Nanog, is transcriptionally activated by Oct4. While PHC1 exerts PRC1-dependent repression of development genes by associating with other cPRC1 subunits such as RING1B, CBX7, and PCGF2, it also interacts with Nanog to regulate chromatin landscape of the Nanog locus and activate pluripotent genes.

Similar articles

Cited by

References

    1. Thomson JA, et al. Embryonic stem cell lines derived from human blastocysts. Science. 1998;282:1145–1147. doi: 10.1126/science.282.5391.1145. - DOI - PubMed
    1. Takahashi K, Yamanaka S. Induction of pluripotent stem cells from mouse embryonic and adult fibroblast cultures by defined factors. Cell. 2006;126:663–676. doi: 10.1016/j.cell.2006.07.024. - DOI - PubMed
    1. Ng HH, Surani MA. The transcriptional and signalling networks of pluripotency. Nat. Cell Biol. 2011;13:490–496. doi: 10.1038/ncb0511-490. - DOI - PubMed
    1. Orkin SH, Hochedlinger K. Chromatin connections to pluripotency and cellular reprogramming. Cell. 2011;145:835–850. doi: 10.1016/j.cell.2011.05.019. - DOI - PMC - PubMed
    1. Young RA. Control of the embryonic stem cell state. Cell. 2011;144:940–954. doi: 10.1016/j.cell.2011.01.032. - DOI - PMC - PubMed

Publication types

MeSH terms