

Epigenome-wide association meta-analysis of DNA methylation with coffee and tea consumption
- PMID: 33990564
- PMCID: PMC8121846
- DOI: 10.1038/s41467-021-22752-6
Epigenome-wide association meta-analysis of DNA methylation with coffee and tea consumption
Abstract
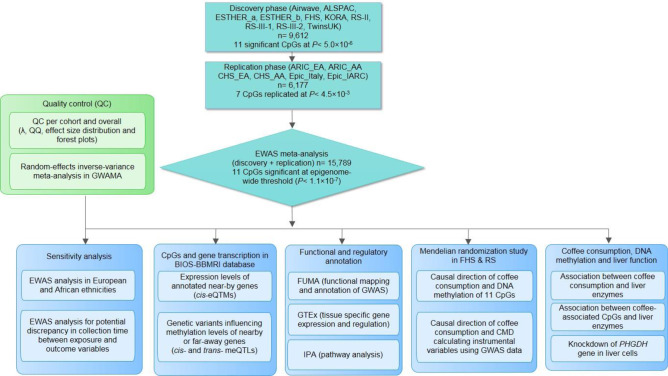
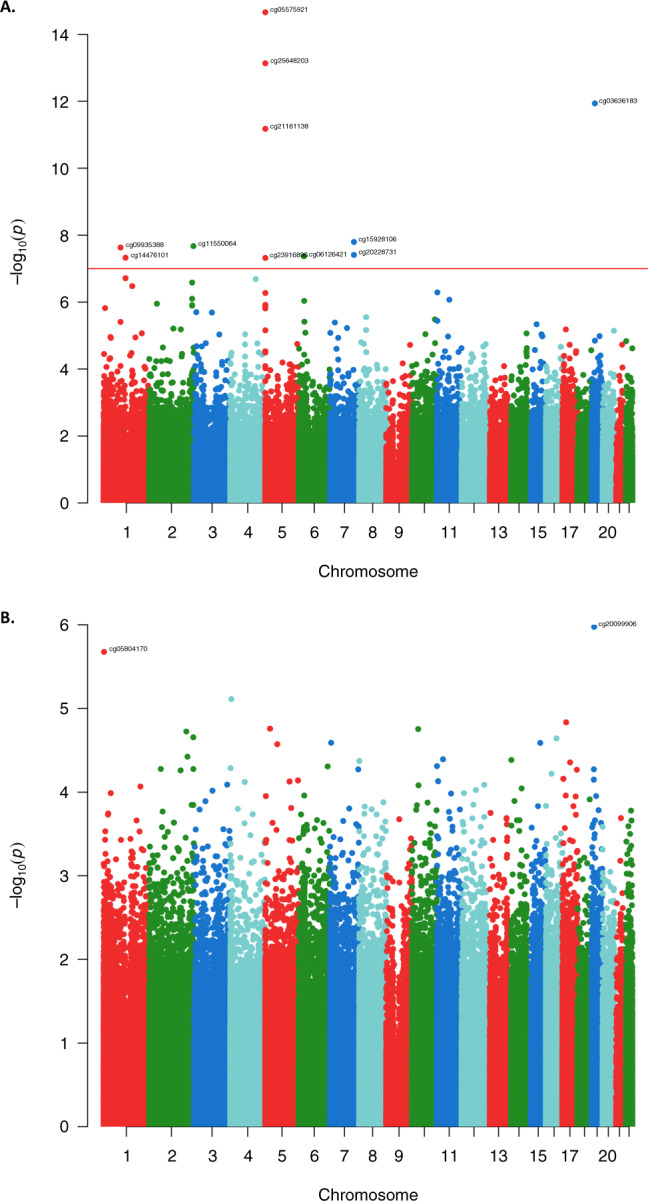
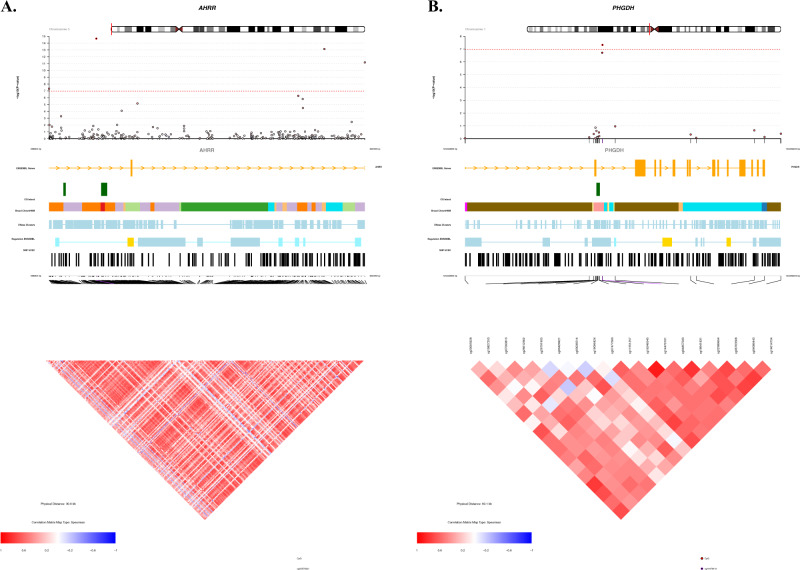
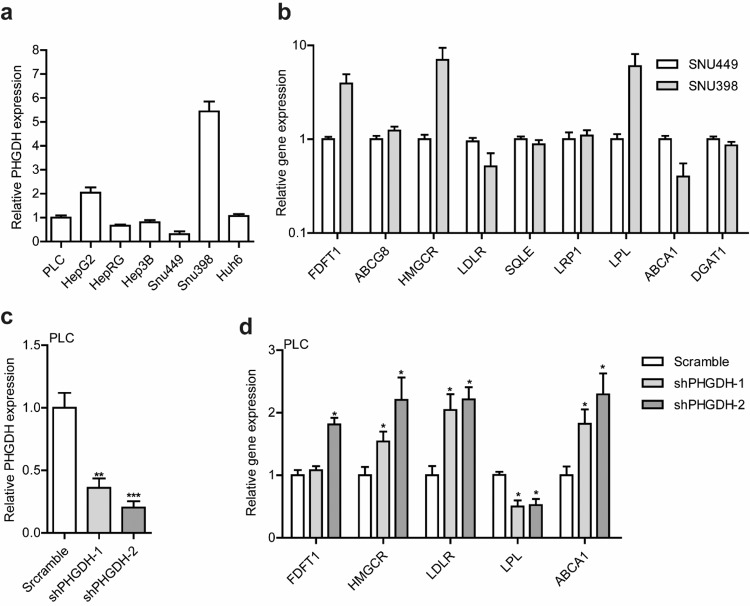
Coffee and tea are extensively consumed beverages worldwide which have received considerable attention regarding health. Intake of these beverages is consistently linked to, among others, reduced risk of diabetes and liver diseases; however, the mechanisms of action remain elusive. Epigenetics is suggested as a mechanism mediating the effects of dietary and lifestyle factors on disease onset. Here we report the results from epigenome-wide association studies (EWAS) on coffee and tea consumption in 15,789 participants of European and African-American ancestries from 15 cohorts. EWAS meta-analysis of coffee consumption reveals 11 CpGs surpassing the epigenome-wide significance threshold (P-value <1.1×10⁻⁷), which annotated to the AHRR, F2RL3, FLJ43663, HDAC4, GFI1 and PHGDH genes. Among them, cg14476101 is significantly associated with expression of the PHGDH and risk of fatty liver disease. Knockdown of PHGDH expression in liver cells shows a correlation with expression levels of genes associated with circulating lipids, suggesting a role of PHGDH in hepatic-lipid metabolism. EWAS meta-analysis on tea consumption reveals no significant association, only two CpGs annotated to CACNA1A and PRDM16 genes show suggestive association (P-value <5.0×10⁻⁶). These findings indicate that coffee-associated changes in DNA methylation levels may explain the mechanism of action of coffee consumption in conferring risk of diseases.
Conflict of interest statement
The authors declare no competing interests.
Figures
References
-
- National Research Council Committee on, D. & Health. 10.17226/1222 (1989).
-
- Bunker ML, McWilliams M. Caffeine content of common beverages. J. Am. Diet. Assoc. 1979;74:28–32. - PubMed
Publication types
MeSH terms
Substances
Grants and funding
- N01HC85080/HL/NHLBI NIH HHS/United States
- BB/S020845/1/BB_/Biotechnology and Biological Sciences Research Council/United Kingdom
- DH_/Department of Health/United Kingdom
- N01HC85082/HL/NHLBI NIH HHS/United States
- N01HC55222/HL/NHLBI NIH HHS/United States
- HHSN268201700002I/HL/NHLBI NIH HHS/United States
- N01HC85086/HL/NHLBI NIH HHS/United States
- N01HC25195/HL/NHLBI NIH HHS/United States
- HHSN268201700003I/HL/NHLBI NIH HHS/United States
- 001/WHO_/World Health Organization/International
- G9815508/MRC_/Medical Research Council/United Kingdom
- 217065/Z/19/Z/WT_/Wellcome Trust/United Kingdom
- MC_PC_19009/MRC_/Medical Research Council/United Kingdom
- MR/R023484/1/MRC_/Medical Research Council/United Kingdom
- R01 AG023629/AG/NIA NIH HHS/United States
- HHSN268201800001C/HL/NHLBI NIH HHS/United States
- U01 HL080295/HL/NHLBI NIH HHS/United States
- UL1 TR001881/TR/NCATS NIH HHS/United States
- R01 HL120393/HL/NHLBI NIH HHS/United States
- HHSN268201200036C/HL/NHLBI NIH HHS/United States
- RC2 HL102419/HL/NHLBI NIH HHS/United States
- R01 NS087541/NS/NINDS NIH HHS/United States
- R01 HL103612/HL/NHLBI NIH HHS/United States
- HHSN268201700001I/HL/NHLBI NIH HHS/United States
- MC_UU_12013_2/MRC_/Medical Research Council/United Kingdom
- HHSN268201700004I/HL/NHLBI NIH HHS/United States
- R01 HL085251/HL/NHLBI NIH HHS/United States
- K22 HL135075/HL/NHLBI NIH HHS/United States
- HHSN268201500001I/HL/NHLBI NIH HHS/United States
- N01HC85079/HL/NHLBI NIH HHS/United States
- N01HC85083/HL/NHLBI NIH HHS/United States
- MC_PC_15018/MRC_/Medical Research Council/United Kingdom
- R01 HL105756/HL/NHLBI NIH HHS/United States
- HHSN268201700005I/HL/NHLBI NIH HHS/United States
- U01 HL130114/HL/NHLBI NIH HHS/United States
- R01 HL087652/HL/NHLBI NIH HHS/United States
- MC_UU_00011/5/MRC_/Medical Research Council/United Kingdom
- HHSN268200800007C/HL/NHLBI NIH HHS/United States
- MR/L01632X/1/MRC_/Medical Research Council/United Kingdom
- N01HC85081/HL/NHLBI NIH HHS/United States
- BB/T019980/1/BB_/Biotechnology and Biological Sciences Research Council/United Kingdom
LinkOut - more resources
Full Text Sources
Other Literature Sources
Medical
Miscellaneous
