. 2021 May 14;12(1):2804.
doi: 10.1038/s41467-021-23071-6.

Mitochondrial ATP fuels ABC transporter-mediated drug efflux in cancer chemoresistance

Affiliations

Mitochondrial ATP fuels ABC transporter-mediated drug efflux in cancer chemoresistance

Emily L Giddings et al. Nat Commun. .

Abstract

Chemotherapy remains the standard of care for most cancers worldwide, however development of chemoresistance due to the presence of the drug-effluxing ATP binding cassette (ABC) transporters remains a significant problem. The development of safe and effective means to overcome chemoresistance is critical for achieving durable remissions in many cancer patients. We have investigated the energetic demands of ABC transporters in the context of the metabolic adaptations of chemoresistant cancer cells. Here we show that ABC transporters use mitochondrial-derived ATP as a source of energy to efflux drugs out of cancer cells. We further demonstrate that the loss of methylation-controlled J protein (MCJ) (also named DnaJC15), an endogenous negative regulator of mitochondrial respiration, in chemoresistant cancer cells boosts their ability to produce ATP from mitochondria and fuel ABC transporters. We have developed MCJ mimetics that can attenuate mitochondrial respiration and safely overcome chemoresistance in vitro and in vivo. Administration of MCJ mimetics in combination with standard chemotherapeutic drugs could therefore become an alternative strategy for treatment of multiple cancers.


Conflict of interest statement

M. Rincon and T. Thornton have a patent application related to this work. K.F. was supported by Mitotherapeutics LLC. M. Rincon is a co-founder and a member of the Scientific Advisory Board of Mitotherapeutix LLC. The other authors declare no competing interests.

Figures
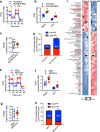
Fig. 1
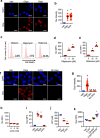
Fig. 1. Chemoresistant cancer cells exhibit increased mitochondrial respiration and ATP production.
a, b OVCAR-8 and NCI/ADR-RES cells were analyzed by Seahorse MitoStress Assay for (a) oxygen consumption rates (OCR) at baseline and in response to sequential injections of oligomycin (O), FCCP (F), and rotenone with antimycin (RA). For b basal OCR and ATP linked (ATP) are shown (NCI/ADR-RES, n =  5; OVCAR-8, n = 6). p = 0.0002, 0.00007. c Baseline extracellular acidification rates (ECAR) of OVCAR-8 and NCI/ADR-RES cells as determined by MitoStress assay analysis. (NCI/ADR-RES, n = 5; OVCAR-8, n = 6), p = 0.842. d Mitochondrial and glycolytic ATP production rates in OVCAR-8 and NCI/ADR-RES cells as determined by Seahorse ATP Production Rate Test. Numbers in the bars represent the % of mito-ATP relative to the total. p = 0.0001 by two-way ANOVA. e OCR of MES and MES/Dox cells were determined as in (a). f Basal OCR and ATP linked (ATP) for MES cells (n = 6) and MES/Dox cells (n = 7) are shown. p = 0.002, p = 0.005. g Baseline ECAR of MES (n =  4) and MES/Dox (n  =  7) cells as determined by MitoStress assay analysis, p = 0.788. h Mitochondrial and glycolytic ATP production rates in MES and MES/Dox cells as determined by Seahorse ATP Production Rate Test. p = 0.0001 by two-way ANOVA. i Relative abundances of metabolic intermediates in OVCAR-8 and NCI/ADR-RES cells as determined by mass spectrometry-based metabolomics. Within each cell type, each colum represents a independent cell preparation (n = 4 for each cell type). Color represents the actual value with intense blue representing the lowest value, and intense red the highest value. Specific metabolites described in the text have been framed in red. Mean ± SEM is provided for all the figures. * denotes p < 0.05 by unpaired t test analysis for each parameter.
Fig. 2
Fig. 2. Mitochondrial respiration, but not glycolysis, is responsible for reduced drug accumulation in chemoresistant cells.
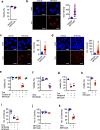
a, b NCI/ADR-RES cells were incubated with or without (Veh) oligomycin (Oligo, 5 μM) or rotenone (Rote, 50 μM) for 2 h followed by incubation with doxorubicin (Dox, 3 μM) for 3 h. Cells were then fixed, stained with DAPI (nuclear dye, blue), and analyzed by confocal microscopy for doxorubicin fluorescence (red). a Representative images. Scale bars represent 20 μm. b Quantification of doxorubicin intensity relative to nuclear area (vehicle n = 12, olligomycin n = 12, rotenone n = 17). p = 0.0001, 0.0001. c Cell death analysis using the Live/Death staining and flow cytometry analysis in cells after the treatments described in (a). Numbers represent the percentage of dead cells. d, e NCI/ADR-RES cells were incubated with increasing concentrations of d oligomycin (p = 0.0001, 0.0001) or e rotenone (p = 0.0006, 0.0001) as indicated for 2 h followed by incubation with doxorubicin (3 μM) as in (a). Cells were then fixed and analyzed for doxorubicin fluorescence by flow cytometry. Median fluorescence intensity (MFI) is shown (n = 3). f, g NCI/ADR-RES cells were incubated with oligomycin (5 μM) or 2-deoxyglucose (2-DG, 50 mM) for 2 h or without glucose (No Gluc) for 24 h followed by incubation with doxorubicin (3 μM) as in (a). Cells were then fixed, stained, and analyzed as in (a, b). f Representative images. Scale bars represent 20 μm. g Quantification of doxorubicin intensity relative to nuclear area (vehicle n = 176, 2-DG n = 75, no glucose n = 46, olligomycin n = 109). p = 0.0001, 0.9918, 0.9999. h NCI/ADR-RES cells were incubated with increasing concentrations of 2-deoxyglucose as indicated for 2 h followed by incubation with doxorubicin as (3 μM) in (a). Cells were then fixed and analyzed as in (e, f) (n = 3). p = 0.3372, 0.0012. i MES/Dox cells were incubated with oligomycin (5 μM), rotenone (50 μM), or 2-deoxyglucose (50 mM) for 2 h followed by incubation with doxorubicin as in (a). Cells were then fixed and analyzed as in (d, e) (n = 3). p = 0.0001, 0.0001, 0.967. j NCI/ADR-RES cells were incubated with oligomycin (5 μM) or 2-deoxyglucose (50 mM) for 5 h and then total ATP levels were determined by Luciferase assay (n = 4). ATP concentration (104 cells) is shown. p = 0.0001, 0.0001. k NCI/ADR-RES cells were incubated with 2-DG (50 mM), CB-839 (5 μM) or both for 2 h followed by incubation with doxorubicin (3 μM), and analyzed for doxorubicin fluorescence by flow cytometry. p = 0.479, 0.1162, 0.0003. Mean ± SEM is provided for all figures. * denotes p < 0.05 by one-way ANOVA and Tukey’s multiple comparisons test. Results are representative of at least two experiments.
Fig. 3
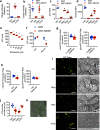
Fig. 3. Mitochondrial respiration provides the energy required for ABC transporter activity.
a NCI/ADR-RES cells were treated with or without (Veh) oligomycin (Oligo, 5 μM) or 2-deoxyglucose (2-DG, 50 mM) for 2 h followed by incubation with calcein (0.25 μM) for 15 min. Cells were then washed, dissolved in DMSO, and calcein fluorescence relative to untreated cells was determined (n = 3). p = 0.0001, 0.977 by one-way ANOVA and Tukey’s multiple comparisons test. b Calcein fluorescence in control (empty plasmid) HEK 293T cells (293T) and ABCB1-expressing HEK 293T cells (293T-ABCB1) was determined as in (a) (293T vehicle n = 3, 293T-ABCB1 vehicle n = 4, 293T-ABCB1 oligomycin n = 4, 293T-2-DG n = 4). p = 0.0001, 0.0001, 0.996 by one-way ANOVA and Tukey’s multiple comparisons test. c 293T and 293T-ABCB1 cells were treated with oligomycin (5 μM), rotenone (50 μM), or 2-deoxyglucose (50 mM) for 2 h followed by incubation with doxorubicin (Dox, 3 μM) for 3 h. Cells were then fixed and analyzed for doxorubicin fluorescence by flow cytometry. Median fluorescence intensity (MFI) is shown (n = 3). p = 0.0001, 0.0001, 0.0001, 0.999 by one-way ANOVA and Tukey’s multiple comparisons test. d ABCG2-expressing cells (293T-ABCG2) cells were treated with oligomycin (5 μM), rotenone (50 μM), or 2-deoxyglucose (50 mM) for 2 h followed by incubation with Hoechst 33342 (100 ng/mL) for 3 h. Control 293T cells transfected with the empty plasmid were used as positive control. Cells were then fixed and analyzed for Hoechst fluorescence by flow cytometry. Median fluorescence intensity (MFI) is shown (n = 3). p = 0.0001, 0.0066, 0.0001, 0.9998 by one-way ANOVA and Tukey’s multiple comparisons test. e NCI/ADR-RES cells (n = 3) were incubated with increasing concentrations of rhodamine (Rho) B as indicated for 5 h and then total ATP levels were determined by Luciferase assay. ATP concentration (104 cells) is shown. p = 0.0001, 0.0001, 0.0001, 0.0001 by one-way ANOVA and Tukey’s multiple comparisons test. f 293T and 293T-ABCB1 cells were incubated with or without rhodamine B (100 μM) for 5 h and then analyzed as in (e) (293T-vehicle n = 4, 293T rhodamine n = 4, 293T-ABCB1-vehiclle n = 4, 293T-ABCB1 rhodamine n = 3). p = 0.9974, 0.0001 by one-way ANOVA and Tukey’s multiple comparisons test. g NCI/ADR-RES cells were transfected with siABCB1 or control siRNA (C-siRNA) and after 36 h they were incubated with calcein (1 μm) for 18 h prior to the Seahorse ATP production assay. Mitochondrial ATP production rate (siControl n = 16, siABCB1 n = 14) and glycolytic ATP production rate (siControl n = 15, siABCB1 n = 16) are shown. p = 0.0003 (left panel), 0.1711 (right panel) by unpaired t test. h NCI/ADR-RES cells were incubated with calcein (1 μm) for 18 h, treated with Valspodar (4 μm) or vehicle for 3 h and assayed for mitochondrial ATP production rate (vehicle n = 9, Valspodar n = 11) and glycolytic ATP production rate (vehicle n = 9, Valspodar n = 11) using the Seahorse ATP prroduction rate assay. p = 0.0001 (left panel), 0.1299 (right panel) by unpaired t test. i NCI/ADR-RES cells were incubated with oligomycin (5 μM), rotenone (50 μM), or 2-deoxyglucose (50 μM) for 2 h, stained with a fluorescent ATP probe (100 μM) for 5 min, and then analyzed by live cell confocal microscopy. ATP probe fluorescence (green) and bright light differential interference contrast (DIC) are shown. Scale bars represent 10 μm. j Quantification of number of ATP-puncta/cell in the images shown in (g) (vehicle n = 4, oligomycin n = 6, rotenone n = 6, 2-DG n = 4). p = 0.0001, 0.0001, 0.4856 by one-way ANOVA and Tukey’s multiple comparisons test. k Live NCI/ADR-RES cells were incubated with anti-ABCB1 Ab (red) prior to the staining with ATP probe as described in (i) and analyzed by live confocal microscopy. Mean ± SEM is provided for all figures. * denotes p < 0.05 by unpaired t test or one-way ANOVA and Tukey’s multiple comparisons test. Results are representative of two experiments.
Fig. 4
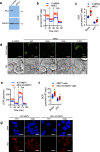
Fig. 4. Loss of MCJ as a mitochondrial brake in cancer cells boosts mitochondrial respiration.
a MCJ (16 kDa) expression in MCF7 cells transfected with a control siRNA (C-siRNA) or an siRNA specific for MCJ (siMCJ) as determined by Western blot analysis. GAPDH (36 kDa) is shown as a loading control. b, c MCF7 cells transfected with C-siRNA or siMCJ were analyzed by Seahorse MitoStress Assay for b oxygen consumption rates (OCR) at baseline and in response to sequential injections of oligomycin (O), FCCP (F), and rotenone with antimycin (RA) and for c basal and ATP linked (ATP) relative to C-siRNA transfected cells (C-siRNA, n = 7; siMCJ, n = 5). p = 0.0008, 0.001. d MCF7 cells transfected with C-siRNA or siMCJ were incubated with or without (Veh) oligomycin (Oligo, 5 μM), rotenone (Rote, 50 μM), or 2-deoxyglucose (2-DG, 50 μM) for 2 h, stained with a fluorescent ATP probe (100 μM) for 5 min, and then analyzed by live cell confocal microscopy. ATP probe fluorescence (green) and bright light differential interference contrast (DIC) are shown. Scale bars represent 10 μm. e, f Cancer cells were freshly isolated from mammary tumors of WT MMTV-PyMT mice (WT MMTV) and MCJ deficient MMTV-PyMT mice (MCJ KO MMTV) and then analyzed for OCR as in (b, c) (WT MMTV, n = 22; MCJ KO MMTV, n = 20). p = 0.0001, 0.0001. g WT MMTV and MCJ KO MMTV cells were incubated with oligomycin (5 μM) for 2 h followed by incubation with doxorubicin (Dox, 3 μM) for 3 h. Cells were then fixed, stained with DAPI (nuclear dye, blue), and analyzed by confocal microscopy for doxorubicin fluorescence (red). Scale bars represent 20 μm. Mean ± SEM is provided for all figures. *denotes p < 0.05 by unpaired t test. Results are representative of two or three experiments.
Fig. 5
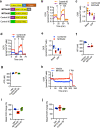
Fig. 5. N-MCJ mimetics attenuate mitochondrial respiration in chemoresistant cancer cells.
a Diagram of N-MCJ mimetics. Top diagrams show full length MCJ (not to scale). N-term, N-terminus; TM, transmembrane domain; C-term, C-terminus; TAT, HIV TAT sequences; N-MCJ, first 20 aa of the MCJ N-terminus; mts, mitochondrial targeting sequence; mpp, mitochondrial penetrating peptide; rev, reversed aa sequence. b, c NCI/ADR-RES cells were treated with MITOx20 (25 μM) or Control-20 (25 μM) for 12 h and the analyzed by Seahorse MitoStress Assay for b oxygen consumption rates (OCR) at baseline and in response to sequential injections of oligomycin (O), FCCP (F), and rotenone with antimycin (RA) and for c basal (Control n = 5, MITOx20 n = 4) and ATP-linked (ATP) (Control n = 5, MITOx20 n = 4) relative to Control-20 treated cells. p = 0.0243, 0.001 by unpaired t test. d, e NCI/ADR-RES cells were treated with MITOx30 (25 μM) or Control-30 (25 μM) for 12 h and then analyzed as in (b, c) (n = 4). p = 0.0005, 0.002 by unpaired t test. f NCI/ADR-RES cells were incubated with or without (Vehicle) MITOx20 (25 μM) or MITOx30 (25 μM) for 5 h and then total ATP levels were determined by Luciferase assay (n = 4). p = 0.0001, 0.0001 by one-way ANOVA and Tukey’s multiple comparisons test. g NCI/ADR-RES cells were incubated with or without (Vehicle) Control-20 (25 μM) or Control-30 (25 μM) for 5 h and then total ATP levels were determined by Luciferase assay (n = 3). p = 0.3635, 0.7322 by one-way ANOVA and Tukey’s multiple comparisons test. h NCI/ADR-RES cells were analyzed for OCR at baseline and in response to sequential injections of MITOx30 (25 μM), FCCP, and rotenone with antimycin. i Basal OCR (p = 0.0001, 0.9681 by one-way ANOVA and Tukey’s multiple comparisons test), j and ECAR (p = 0.7301, 0.4473 by one-way ANOVA and Tukey’s multiple comparisons test) in NCI/ADR-RES cells in response to injection of MITOx30 or Control-30 as determined by MitoStress assay (vehicle n = 8, Control-30 n = 6, MITOx30 n = 8). Mean ± SEM is shown for all figures. * denotes p < 0.05 by unpaired t test or one-way ANOVA and Tukey’s multiple comparisons test. Results are representative of at least two experiments.
Fig. 6
Fig. 6. N-MCJ mimetics sensitize chemoresistant cells to chemotherapy treatment.
a NCI/ADR-RES cells were treated with or without (Vehicle) MITOx20 (5 μM) for 3 d and then surviving cell counts were determined by Trypan blue exclusion. Viability relative to untreated cells is shown (Vehicle n = 4, MITOx20 n = 7). p = 0.02 by unpaired t test. b NCI/ADR-RES cells were incubated with MITOx20 (5 μM) for 2 h followed by incubation with doxorubicin (Dox, 3 μM) for 3 h. Cells were then fixed, stained with DAPI (nuclear dye, blue), and analyzed by confocal microscopy for doxorubicin fluorescence (red). Representative images and quantification of doxorubicin intensity relative to nuclear area are shown (Vehicle n = 44, MITOx20 n = 32). Scale bars represent 20 μm. p = 0.0001 by unpaired t test. c NCI/ADR-RES and d ABCB1-expressing HEK 293T cells were incubated with MITOx30 (5 μM) for 2 h followed by incubation with doxorubicin (3 μM) and analysis as in (b). Representative images and quantification of doxorubicin intensity relative to nuclear area are shown. For c Vehicle n = 138, MITOx30 n = 74. p = 0.0001 by unpaired t test. For d Vehicle n = 106, MITOx30 n = 284. p = 0.0001 by unpaired t test. Scale bars represent 20 μm. e NCI/ADR-RES cells were treated with doxorubicin (3 μM), Control-30 (5 μM), and/or MITOx30 (5 μM) for 3 d and then cell viability was determined as in (a) (n = 4). p = 0.9999, 0.9988, 0.993, 0.0001 by one-way ANOVA and Tukey’s multiple comparisons test. f NCI/ADR-RES cells were treated with doxorubicin (3 μM) and/or MITOx20 (5 μM) for 2 d and then cell viability was determined as in (a) (n = 3). p = 0.8399, 0.0008, 0.0005 by one-way ANOVA and Tukey’s multiple comparisons test. g NCI/ADR-RES cells were treated with doxorubicin (3 μM), verapamil (10 μM), and MITOx30 (5 μM) for 3 d and then cell viability was determined as in (a) (n = 3). p = 0.0001, 0.0001 by one-way ANOVA and Tukey’s multiple comparisons test. h MES/Dox cells were treated with doxorubicin (3 μM) alone or in combination with MITOx30 (5 μM) for 3 d and then cell viability was determined as in (a) (n = 3). p = 0.0004 by unpaired t test. i NCI/ADR-RES cells were treated with doxorubicin (3 μM) in combination with MITOx20 (5 μM) or MITOx30 (5 μM) for 2 d, replated at a low density (500 cells), grown in normal culture medium for 1 wk, and then the number of colonies formed was determined (n = 4). p = 0.0016, 0.0004 by one-way ANOVA and Tukey’s multiple comparisons test. j NCI/ADR-RES cells were treated with MITOx20 (5 μM) or MITOx30 (5 μM) for 2 d and then analyzed for clonogenicity as in (h) (n = 3). p = 0.9266, 0.5766 by one-way ANOVA and Tukey’s multiple comparisons test. k MES/Dox cells were treated with doxorubicin (3 μM) alone or in combination with MITOx30 (5 μM) for 2 d, replated at a low density (400 cells), and then analyzed for clonogenicity as in (h) (n = 4). p = 0.0001 by upaired t test. Mean ± SEM is provided for all figures. * denotes p < 0.05 by unpaired t test or one-way ANOVA and Tukey’s multiple comparisons test. Results are representative of two or three experiments.
Fig. 7
Fig. 7. Reversal of chemotherapy resistance in mouse models of chemoresistant cancer.
a Spot blot analysis of MITOx20, MITOx30, and Control-30 prior to (0 h) or after incubation with serum (3 or 6 h) using an antibody specific for the N-terminus of MCJ. b MCJ-deficient MMTV-PyMT mice were treated with doxorubicin alone (Dox, n = 5), MITOx30 alone (n = 4), or doxorubicin in combination with Control-30 (n = 4), MITOx20 (n = 6), or MITOx30 (n = 5) every other day for 12 d. Change in tumor volume over time during treatment relative to the initial tumor size is shown. p = 0.0001. c NSG mice with NCI/ADR-RES cell xenografts were treated with doxorubicin alone or in combination with MITOx20 or MITOx30 every other day for 8 d (n = 6). Change in tumor volumes over time during treatment relative to the initial tumor size is shown. p = 0.0001. d NSG mice (n = 4 per group) with NCI/ADR-RES cell xenografts were treated with doxorubicin alone or in combination with Control-30 as in (c). For bd repeated measures analysis of variance was used to examine the trajectory of tumor volume over time, and statistical significance for all post hoc tests were subject to Bonferroni correction to control for multiple comparisons. Mean ± SEM provided for all figures.

Similar articles

Cited by

References

    1. Gottesman MM, Lavi O, Hall MD, Gillet JP. Toward a better understanding of the complexity of cancer drug resistance. Annu. Rev. Pharm. Toxicol. 2016;56:85–102. doi: 10.1146/annurev-pharmtox-010715-103111. - DOI - PubMed
    1. Kathawala RJ, Gupta P, Ashby CR, Jr, Chen ZS. The modulation of ABC transporter-mediated multidrug resistance in cancer: a review of the past decade. Drug Resist. Updat. 2015;18:1–17. doi: 10.1016/j.drup.2014.11.002. - DOI - PubMed
    1. Szakacs G, Paterson JK, Ludwig JA, Booth-Genthe C, Gottesman MM. Targeting multidrug resistance in cancer. Nat. Rev. Drug Disco. 2006;5:219–234. doi: 10.1038/nrd1984. - DOI - PubMed
    1. Dean M, Rzhetsky A, Allikmets R. The human ATP-binding cassette (ABC) transporter superfamily. Genome Res. 2001;11:1156–1166. doi: 10.1101/gr.GR-1649R. - DOI - PubMed
    1. Robey RW, et al. Revisiting the role of ABC transporters in multidrug-resistant cancer. Nat. Rev. Cancer. 2018;18:452–464. doi: 10.1038/s41568-018-0005-8. - DOI - PMC - PubMed

Publication types

MeSH terms

LinkOut - more resources