. 2021 May 14;12(1):2849.
doi: 10.1038/s41467-021-23133-9.

NMDAR-dependent long-term depression is associated with increased short term plasticity through autophagy mediated loss of PSD-95

Affiliations

NMDAR-dependent long-term depression is associated with increased short term plasticity through autophagy mediated loss of PSD-95

Benjamin Compans et al. Nat Commun. .

Abstract

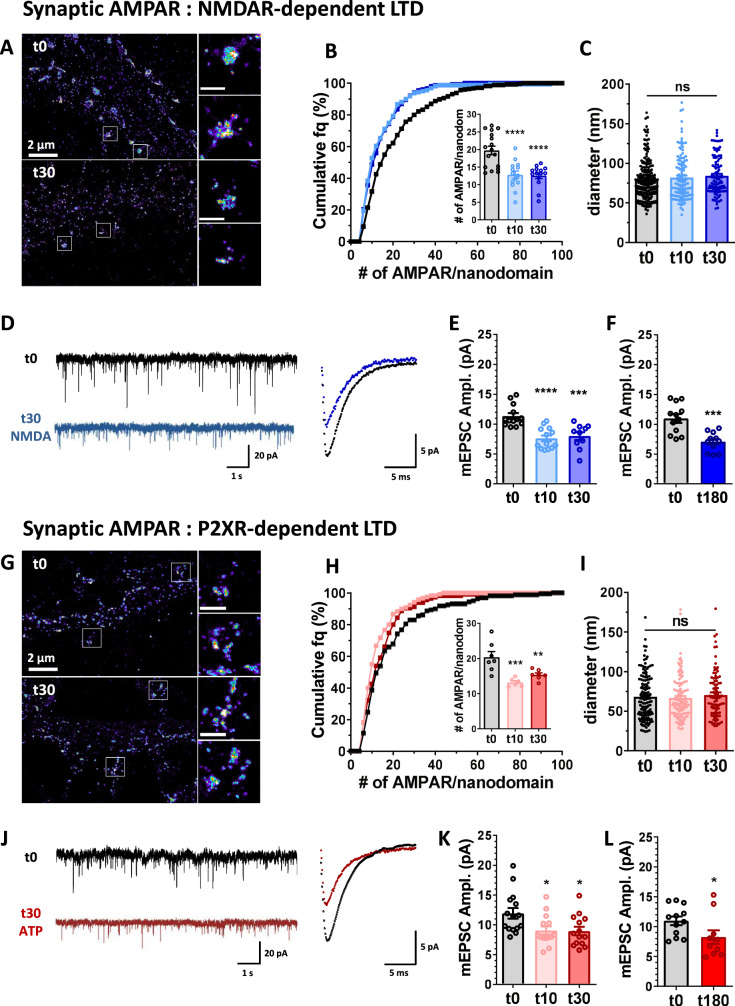
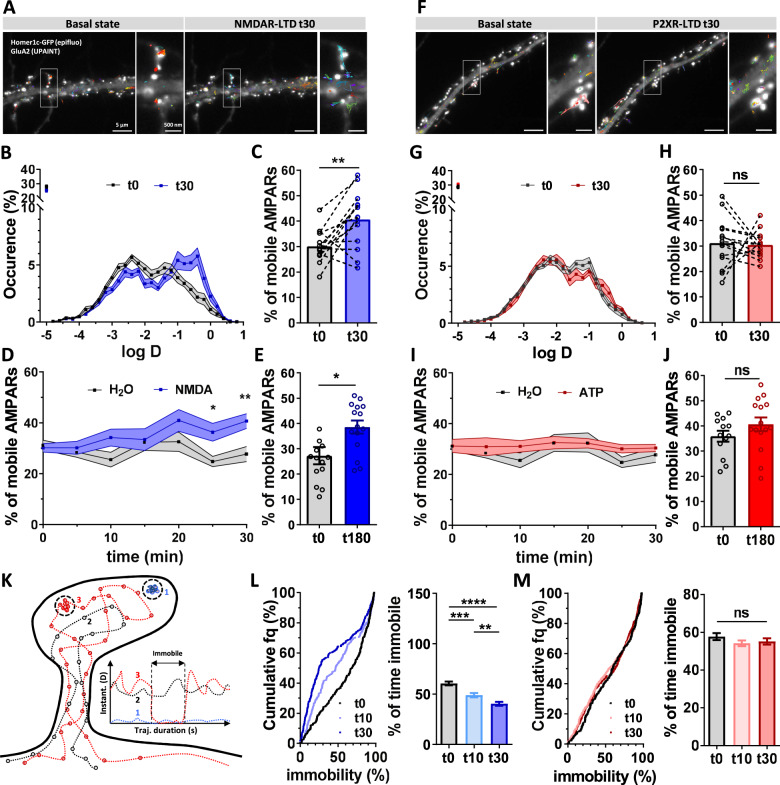
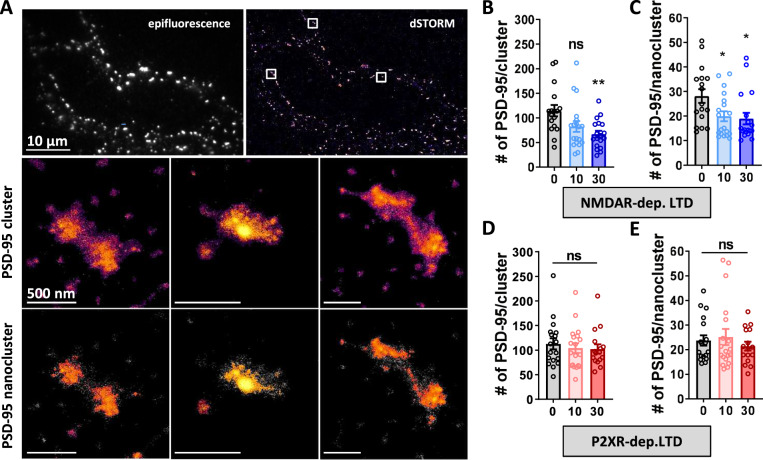
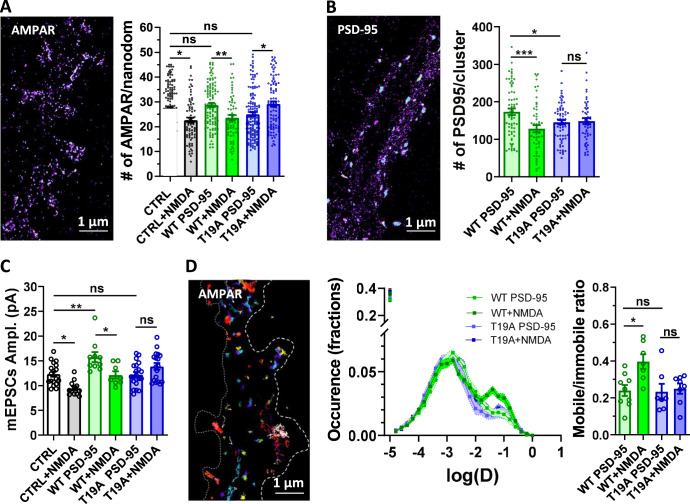
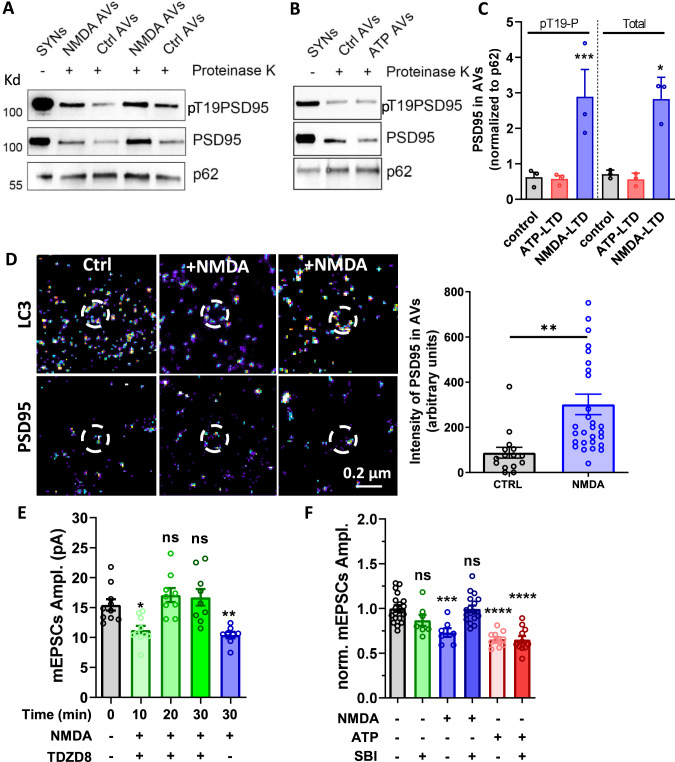
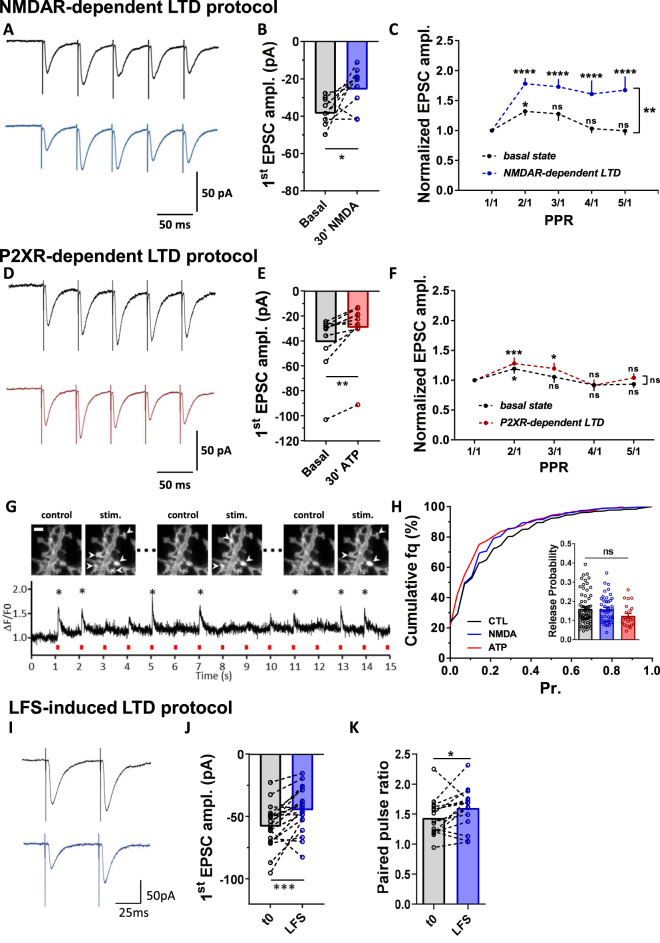
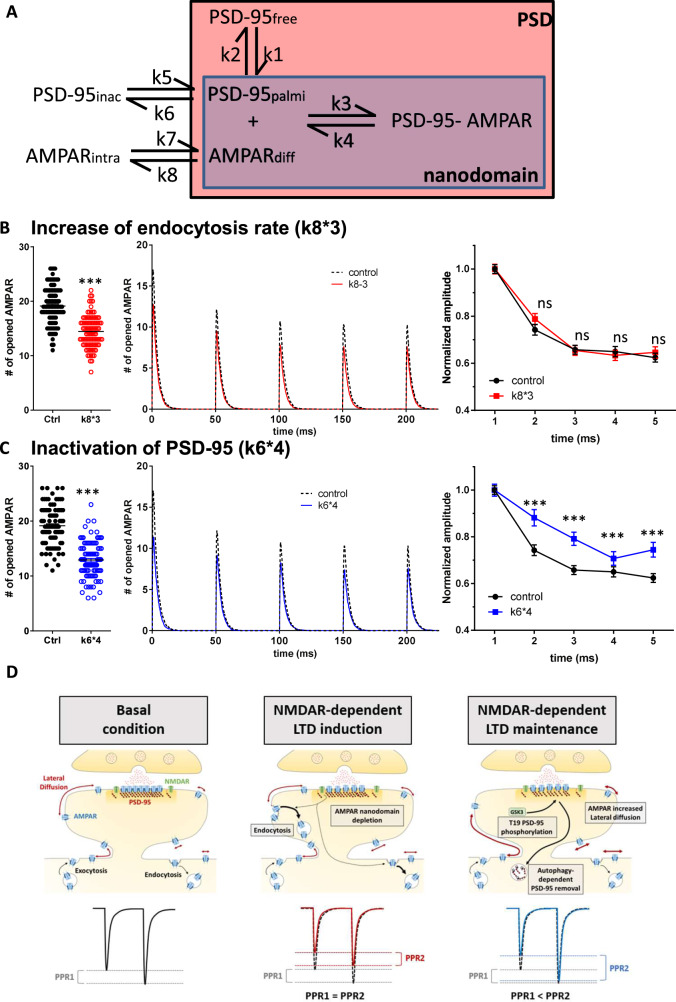
Long-term depression (LTD) of synaptic strength can take multiple forms and contribute to circuit remodeling, memory encoding or erasure. The generic term LTD encompasses various induction pathways, including activation of NMDA, mGlu or P2X receptors. However, the associated specific molecular mechanisms and effects on synaptic physiology are still unclear. We here compare how NMDAR- or P2XR-dependent LTD affect synaptic nanoscale organization and function in rodents. While both LTDs are associated with a loss and reorganization of synaptic AMPARs, only NMDAR-dependent LTD induction triggers a profound reorganization of PSD-95. This modification, which requires the autophagy machinery to remove the T19-phosphorylated form of PSD-95 from synapses, leads to an increase in AMPAR surface mobility. We demonstrate that these post-synaptic changes that occur specifically during NMDAR-dependent LTD result in an increased short-term plasticity improving neuronal responsiveness of depressed synapses. Our results establish that P2XR- and NMDAR-mediated LTD are associated to functionally distinct forms of LTD.


Conflict of interest statement

The authors declare no competing interests.

Figures

Fig. 1
Fig. 1. NMDA and ATP application triggers a rapid and long-lasting nanoscale reorganization of AMPAR at synapses associated to a long-term synaptic current depression.
A Example of super-resolution intensity images of a piece of dendrite obtained using dSTORM technique on live stained neurons for endogenous GluA2 containing AMPARs at basal state (t0) or 30 min (t30) following NMDA application (30 µM, 3 min). Enlarged synapses are shown on the right. B Cumulative distribution of nanodomain AMPAR content (n = 275, 159 and 152 for t0, t10 and t30 respectively), and in the inset, the mean per cell. The number of AMPARs per nanodomain was estimated 0, 10 and 30 min following NMDA treatment as explained in Nair et al. 2013 (mean ± SEM, n = 17, 14 and 14 respectively, one-way ANOVA, p < 0.0001 and Dunnett’s post-test found significant differences between t10 or t30 and t0, p < 0.0001). Nanodomain content is significantly decreased 10 and 30 min following NMDA treatment compared to non-treated cells. C Diameter of AMPAR synaptic nanodomains. Nanodomain sizes were measured by anisotropic Gaussian fitting of pre-segmented clusters obtained on dSTORM images. Nanodomain diameter (mean ± SEM) 0, 10 and 30 min following NMDA treatment are plotted (n = 191, 127 and 100 respectively, one-way ANOVA, p = 0.2487). Nanodomain size is not affected by NMDA application. D Left panel: example of miniature EPSC traces recorded on cultured neurons in basal condition (dark trace) or 30 min after NMDA treatment (blue trace). Right panel: Superposition of a mean trace of AMPAR mEPSC in basal (dark) and 30 min post-NMDA treatment (blue). E and F Average of the mESPC amplitude recorded on neurons 0, 10 or 30 min (E) and 180 min (F) after NMDA treatment. Miniature EPSC amplitudes are significantly depressed 10 and 30 min after NMDA treatment (E, n = 13, 13 and 10 respectively, one-way ANOVA p < 0.0001 and Dunnett’s post-test found significant differences p < 0.0001 and p = 0.0003 between t0 and t10, and t0 and t30 respectively), and this depression stays for at least 3 h (F, n = 12 and 11 respectively, t-test p = 0.0003). G Example of super-resolution intensity images of a piece of dendrite obtained using dSTORM technique on neurons live stained for endogenous GluA2 containing AMPARs at basal state (t0) or 30 min (t30) following ATP (100 µM, 1 min). Enlarged synapses are shown on the right. H Cumulative distribution of nanodomain AMPAR content (n = 158, 120 and 115 for t0, t10 and t30 respectively), and in the inset, the mean per cell. The number of AMPARs per nanodomains was estimated 0, 10 and 30 min following ATP treatment (mean ± SEM, n = 7, 6 and 7 respectively, one-way ANOVA, p = 0.0006 and Dunnett’s post-test found significant differences between t10 or t30 and t0, p = 0.0004 and p = 0.0063 respectively). Nanodomain content is decreased 10 and 30 min following ATP treatment compared to non-treated cells. I Measure of nanodomain diameter is not affected 0, 10 and 30 min following ATP treatment (n = 130, 112 and 91 respectively, one-way ANOVA, p = 0.6391). J Left panel: example of miniature EPSC traces recorded on cultured neurons in basal condition (dark trace) or 30 min after ATP treatment (red trace). Right panel: Superposition of a mean trace of AMPAR mEPSC in basal (dark) and 30 min post-ATP treatment (red). K and L Average of the mESPC amplitudes recorded on neurons 0, 10 or 30 min (K) and 180 min (L) after ATP treatment (100 µM, 1 min). Synaptic transmission (mEPSCs) is significantly depressed 10 and 30 min after ATP treatment (mean ± SEM, K, n = 15, 14 and 14 respectively, one-way ANOVA p = 0.0124 and Dunnett’s post-test found significant differences p = 0.0214 and p = 0.0172 between t0 and t10, and t0 and t30 respectively), and this depression stays for at least 3 h (L, n = 12 and 10 respectively, t-test p = 0.0485). Scale bars (A and G) left images = 2 µm, zoom on synapses (left panels) = 500 nm.
Fig. 2
Fig. 2. NMDAR-dependent LTD but not P2XR-dependent LTD triggers a long-term increase of AMPAR lateral diffusion.
A Epifluorescence image of a dendritic segment expressing eGFP-Homer1c as a synaptic marker and GluA2-containing AMPAR trajectories acquired with uPAINT in basal state (left panel) and 30 min after NMDA treatment (right panel). B Average distribution of the log(D) (mean ± SEM), (D being the diffusion coefficient of endogenous AMPAR) in control condition (black line, n = 14) and 30 min after NMDA treatment (blue line, n = 14). C Average of the mobile fraction per cell, before and 30 min after NMDAR-dependent LTD induction (n = 14 cells, mean ± SEM, paired t-test, p = 0.0042). D Time-lapse (from 0 to 30 min) of GluA2-containing AMPAR mobility following NMDAR-dependent LTD induction (blue line) compared to vehicle application (green line) (mean ± SEM, n = 14 and 10 respectively). A significant increase of GluA2-containing AMPAR occurs 25 min after NMDA application. E Average histograms of the mobile fraction per cell, before and 180 min after NMDAR-dependent LTD induction (n = 14 and 15 cells, mean ± SEM, unpaired t-test, p = 0.0123). GluA2-containing AMPAR increased mobility remains stable for at least 3 h. FJ Similar experiments as from (AE) has been realized with ATP-induced LTD protocol. F Epifluorescence image of a dendritic segment expressing eGFP-Homer1c with acquired trajectories of GluA2-containing AMPAR trajectories in basal state (left panel) and 30 min after ATP treatment (right panel). G Average distribution of the log (D) before (black line, n = 14) and 30 min (red line, n = 14) after ATP treatment (mean ± SEM). H Average of the mobile fraction per cell extracted from (G), (n = 14 cells, mean ± SEM, paired t-test, p = 0.8234). Contrary to NMDA-induced LTD, ATP-induced LTD is not associated with an increase of AMPAR mobility. I Time-lapse (from 0 to 30 min) of AMPAR mobility following P2XR-dependent LTD induction (red line) compared to vehicle application (green line) (mean ± SEM, n = 14 and 10 respectively). J Average histograms of the mobile fraction per cell, before and 180 min after P2XR-dependent LTD induction (n = 13 and 15 cells, mean ± SEM, unpaired t-test, p = 0.1950). No modification of AMPAR mobility is observed all along the 3 h experiments. K Scheme of the various AMPAR trajectory behaviors. AMPAR can be fully immobile (1, blue line), fully mobile (2 dark line) or alternate between mobile and immobile (3, red line). Calculation of the % of immobility all along the trajectory duration give an indication of the avidity of AMPAR for their molecular traps. L Variation of the % of AMPAR mobility per synaptic trajectories after NMDAR treatment (control (black line), 10 min (light blue line) and 30 min (dark blue line)). The left panel represents the cumulative distribution and the right panel the mean ± SEM. (n = 252, 235 and 280 synaptic trajectories respectively, one-way ANOVA p < 0.0001 and Tukey’s post-test found significant differences p = 0.0002 and p < 0.0001 between t0 and t10, and t0 and t30 respectively, and p = 0.0081 between t10 and t30). M Variation of the % of AMPAR mobility per synaptic trajectories during ATP-induced LTD (control (black line), 10 min (light red line) and 30 min (dark red line) following LTD induction). The left panel represents the cumulative distribution and the right panel the mean ± SEM (n = 264, 434 and 326 synaptic trajectories respectively, one-way ANOVA p = 0.3360). Scale bars (A and F): 5 µm, and 500 nm for the zoom image on synapses.
Fig. 3
Fig. 3. PSD-95 nanocluster organization is modified during NMDA- but not ATP-dependent LTD.
A Example of endogenous PSD-95 organization along a dendritic shaft observe with epifluorescence (top left) or obtained with dSTORM (top right), represented with SR-Tesseler software, Scale bars = 10 µm. Middle panels shows a PSD-95 clusters that have an enrichment factor above the average density factor (density color coded from magenta to yellow). Down panels shows PSD-95 nanoclusters within PSD-95 cluster in the middle panels, which corresponds to a PSD-95 structure with a higher density factor than the average PSD-95 cluster’s density. Scale bars for middle and bottom images (PSD-95 clusters and nanoclusters) = 500 nm (B and C) Average number of PSD-95 molecules per cluster (B) and per nanoclusters (C) in basal state, 10 and 30 min after NMDA treatment (mean ± SEM, n = 17, 19 and 18 respectively, one-way ANOVA p = 0.0059 and Dunnett’s post-test found significant between t0 and t30 conditions, p = 0.0033 but not between t0 and t10 conditions, p = 0.0517 for clusters; one-way ANOVA p = 0.0189 and Dunnett’s post-test found significant between t0 and t10 and between t0 and t30 conditions, p = 0.0348 and p = 0.0194 respectively, for nanoclusters). D and E Average number of PSD-95 molecules per cluster (B) and per nanoclusters (C) in basal state, 10 and 30 min after ATP treatment (mean ± SEM, n = 18, 19 and 16 respectively, one-way ANOVA p = 0.7616 and p = 0.5269 for clusters and nanoclusters respectively).
Fig. 4
Fig. 4. PSD-95 Phosphorylation at T19 position is essential for all the NMDAR-dependent molecular reshuffling induced by LTD.
A and B Expression of T19A phospho-null mutant of PSD-95, but not WT PSD-95, suppresses the decrease of GluA2 containing AMPAR (A) and PSD-95 (B) content per nanodomain 30 min following NMDAR-dependent LTD (at left: example of super-resolution intensity images of a piece of dendrite obtained using dSTORM technique). At right, the mean per cell histogram (mean ± SEM, one-way ANOVA, p < 0.0001 and p = 0.0014 respectively and Tukey’s post-test results are realized between each conditions, N = 141, 76, 110, 65, 139, 91 for the measure of AMPAR per nanodomain, and N = 65, 54, 70, 51 for the measure of PSD-95 per cluster). C mEPSC amplitude is significantly decreased 30 min following NMDA treatment when both GFP or WT PSD-95 are expressed, while it is suppressed by T19A PSD-95 expression (mean ± SEM, one-way ANOVA, p < 0.0001 and Tukey’s post-test results are realized between each conditions, N = 18, 12, 10, 8, 21, 18). D Example of trajectories of GluA2-containing receptors with uPAINT technique (left panel) and average distribution of the log(D) (middle panel) when WT (green lines) and T19A (blue lines) mutant PSD-95 are expressed, before (dark lines) and 30 min after (light lines) NMDA treatment. Average of the mobile fraction (Right panel), before and 30 min after NMDA treatment (mean ± SEM, one-way ANOVA, p = 0.009 and Tukey’s post-test results are realized between each conditions, N = 7, 9, 7, 8). WT PSD-95 expressing neurons display an increase of AMPAR mobility following NMDAR-dependent LTD while T19A mutant expression abolished this mobility increase.
Fig. 5
Fig. 5. PSD-95 Phosphorylation at T19 position by GSK3β targets it to autophogosomes.
A and B Western blot analysis of total PSD-95 and T19 phosphorylated PSD-95 in purified synaptosomes and in PK-treated autophagic vesicles (AVs) purified before and after induction of the LTD by NMDA (A) or ATP (B) application. PSD-95 and T19PSD-95 levels were normalized to the levels of p62, an autophagic cargo. C Quantification of normalized T19PSD-95 and PSD-95 levels obtained in (A and B) reveals that both phosphorylated and global form of PSD-95 is over-accumulated in autophagic vesicles after NMDA treatment but not after ATP (mean ± SEM, n = 3, one-way ANOVA, p = 0.0005 for pT19P and p = 0.0180 for the Total. Dunnett’s post-test results are realized between each condition and the control condition. For pT19P, control vs ATP-LTD p = 0.85 and control vs NMDA-LTD p = 0.0008; For Total, control vs ATP-LTD p = 0.996 and control vs NMDA-LTD p = 0.022). D Representative images of Dual-color dSTORM experiments with LC3 labelled with alexa-647 (upper panels) and PSD-95 labeled with alexa-532 (bottom panels). PSD-95 intensity inside the AVs shown a threefold increase following LTD induction by NMDA treatment (Right panel, mean ± SEM, unpaired t-test, p = 0.0022, n = 15 and 29). E Evolution in function of time of the mESPC amplitude after NMDAR-dependent LTD in the presence of TDZD8 (10 µM), an inhibitor of GSK3β. After 10 min, a normal LTD is induced but TDZD8 block the maintenance of the LTD (mean ± SEM, one-way ANOVA, p < 0.0001 and Dunnett’s post-test results are realized between each conditions and the control condition, N = 10, 10, 9, 9, 8). F Average of the mESPC amplitude recorded on WT neurons 0 and 30 min after NMDA or ATP treatment, in the absence or the presence of SBI (a specific blocker of autophagy, 0.5 µm). SBI alone does not impact on mEPSC amplitude, while it fully blocks NMDAR-dependent LTD. At the opposite, ATP-induced LTD is preserved in the presence of SBI (mean ± SEM, one-way ANOVA, p < 0.0001 and Dunnett’s post-test results are realized between each conditions and the control condition, N = 19, 7, 7, 17, 11, 11).
Fig. 6
Fig. 6. NMDAR-dependent LTD is associated to a frequency stimulation facilitation without affecting release probability.
A Representative traces of synaptic EPSCs in response to 5 stimulations at 20 Hz before (dark line) and 30 min after (blue line) NMDAR treatment. B Paired-average amplitude of the first response before and 30 min after treatment (n = 9 cells, mean ± SEM, paired t-test, p = 0.0263). The decrease of the first response demonstrates the efficiency of the LTD protocol. C Average of the 5 EPSC amplitudes, normalized by the first response intensity (n = 9 cells, mean ± SEM, two-way ANOVA. For PPR variation, F(4,32) = 10.36, p < 0.0001, Dunnett’s post-test found significant differences increase of PPR between PPR1/1 and PPR2/1, p = 0.0234 at basal state, and between PPR1/1 and either PPR2/1, PPR3/1, PPR4/1 or PPR5/1, p < 0.0001, 30 min after NMDAR-dependent LTD induction. For basal state vs NMDAR-dependent LTD, F(1,8) = 12.85, p = 0.0071 and Sidak’s post-test found significant difference between the basal state and 30 min after NMDAR-dependent LTD induction for PPR2/1, PPR3/1, PPR4/1 and PPR5/1, p = 0.0011, p = 0.0013, p < 0.0001 and p < 0.0001 respectively). A clear facilitation of the currents appears after induction of a NMDAR-dependent LTD. DF Similar experiments has been realized when LTD is induced by ATP application, with example of traces in (D). The significant decrease of the first response represented in (E) validate the depression of the synaptic response (n = 10 cells, mean ± SEM, paired t-test, p = 0.0012). The average of the 5 responses (F) reveals no facilitation compared to control condition after ATP treatment (n = 10 cells, mean ± SEM, two-way ANOVA. For PPR variation, F(4,36) = 7.73, p < 0.0001, Dunnett’s post-test found significant differences increase of PPR between PPR1/1 and PPR2/1, p = 0.0163 at basal state, and between PPR1/1 and PPR2/1 or PPR3/1, p < 0.0004 and p = 0.0138 for P2XR-dependent LTD. For basal state vs P2XR-dependent LTD, F(1,9) = 1.197, p = 0.03023). G Example of the fluorescence increase at a synapse expressing iGluSnFR construct during a field stimulation. Responding synapses are labelled with an arrow (upper part). At the bottom, example of the ∆F/F signal obtained at a single synapse. Stars indicate when the synapse is considered as stimulated (scale bar = 2 µm). H Cumulative distribution of the release probability per synapse in control condition (black line) or after LTD induction with either NMDA (Blue line) or ATP (red line) treatment. The mean values per recorded dendrites has been represented in the insert with the same color code. None of the conditions affects significantly the release probability (n = 64, 44 and 22 respectively, mean ± SEM, one-way ANOVA, p = 0.1520). I Representative traces of synaptic EPSCs in response to 2 stimulations at 20 Hz before (dark line) and 30 min after (blue line) LFS protocol. J Paired-average amplitude of the first response before and 30 min after treatment (n = 19 cells, paired t-test, p = 0.0009). The decrease of the first response demonstrates the efficiency of the LTD protocol. K Average of the paired-pulse ratio before and 30 min after LFS-induced LTD (n = 15; paired t-test, p = 0.046).
Fig. 7
Fig. 7. In silico simulations confirm that AMPAR untrapping induced both a depression of synaptic currents and an increase of synaptic responsiveness.
A Representation of the main interactions which define the AMPAR organization/ trapping. PSD-95 can diffuse freely, be slowly mobile and confined into nanodomain when palmitoylated, or be inactivated. AMPAR can be endocytosed, freely mobile at the surface or being trapped by palmitoylated PSD-95 into the domain. Two various kinetic rate constant modifications trigger a synaptic depression, (1) an increase of endocytosis rate, mimicking the initial phase of the NMDAR-dependent LTD and the P2XR-dependent LTD (B). (2) A decrease of the total number of PSD through an increase of their inactivation rate (C), mimicking the depletion of PSD-95 observed during NMDAR-dependent LTD. For each condition, we report in the right panel, the number of open AMPARs during the first glutamate release (mean ± SEM), before (dark dots) and after (color dots) modification of the parameter. A significant decrease of AMPAR response similar to the depression experimentally measured is observed in all conditions. Middle panel, the average traces of the equivalent AMPAR current following 5 glutamate releases at 20 Hz. Right panel, the average of the AMPAR equivalent current following the 5 releases (mean ± SEM), normalized by the initial response. 96 independent simulations are realized in each condition. When depletion of synaptic AMPAR is induced by increasing the endocytosis, there is no modification of simulated paired-pulse ratio while PSD-95 inactivation condition triggers a significant increase of PPR. D Schematic summary of the molecular processes responsible of NMDAR-dependent LTD induction and maintenance. From basal state (left panel), NMDAR activation triggers an increase of endocytosis rate, responsible of the initiation of the depression (middle panel). Then the activation of the GSK3β phosphorylates PSD-95 at T19, targeting it to autophagosomes for degradation. This decrease of traps releases AMPAR out of the PSD, increase the amount of mobile receptors and favoring synaptic responsiveness (left panel).

Similar articles

Cited by

References

    1. Borgdorff AJ, Choquet D. Regulation of AMPA receptor lateral movements. Nature. 2002;417:649–653. doi: 10.1038/nature00780. - DOI - PubMed
    1. Tardin C, Cognet L, Bats C, Lounis B, Choquet D. Direct imaging of lateral movements of AMPA receptors inside synapses. EMBO J. 2003;22:4656–4665. doi: 10.1093/emboj/cdg463. - DOI - PMC - PubMed
    1. Ehlers MD, Heine M, Groc L, Lee MC, Choquet D. Diffusional Trapping of GluR1 AMPA Receptors by Input-Specific Synaptic Activity. Neuron. 2007;54:447–460. doi: 10.1016/j.neuron.2007.04.010. - DOI - PMC - PubMed
    1. Makino H, Malinow R. AMPA Receptor Incorporation into Synapses during LTP: the Role of Lateral Movement and Exocytosis. Neuron. 2009;64:381–390. doi: 10.1016/j.neuron.2009.08.035. - DOI - PMC - PubMed
    1. Groc L, Choquet D. Linking glutamate receptor movements and synapse function. Science. 2020;368:1204–1213. doi: 10.1126/science.aay4631. - DOI - PubMed

Publication types

MeSH terms