. 2021 May 14;12(1):2792.
doi: 10.1038/s41467-021-23152-6.

Discovery of first-in-class inhibitors of ASH1L histone methyltransferase with anti-leukemic activity

Affiliations

Discovery of first-in-class inhibitors of ASH1L histone methyltransferase with anti-leukemic activity

David S Rogawski et al. Nat Commun. .

Abstract

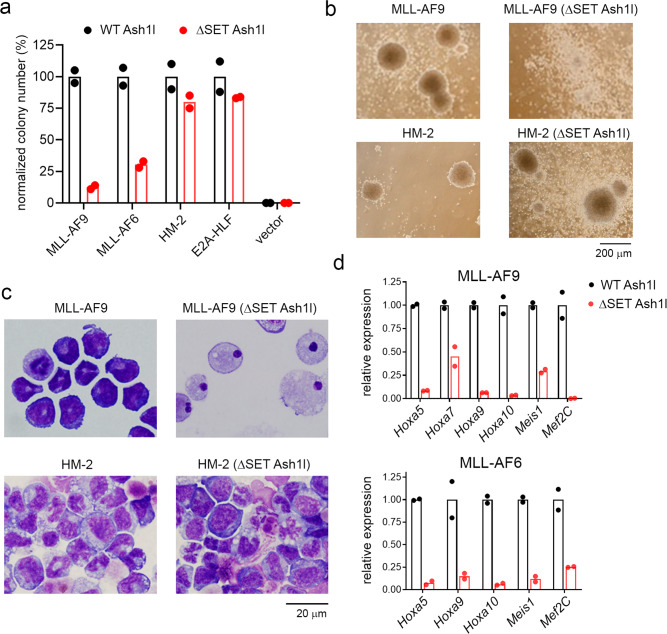
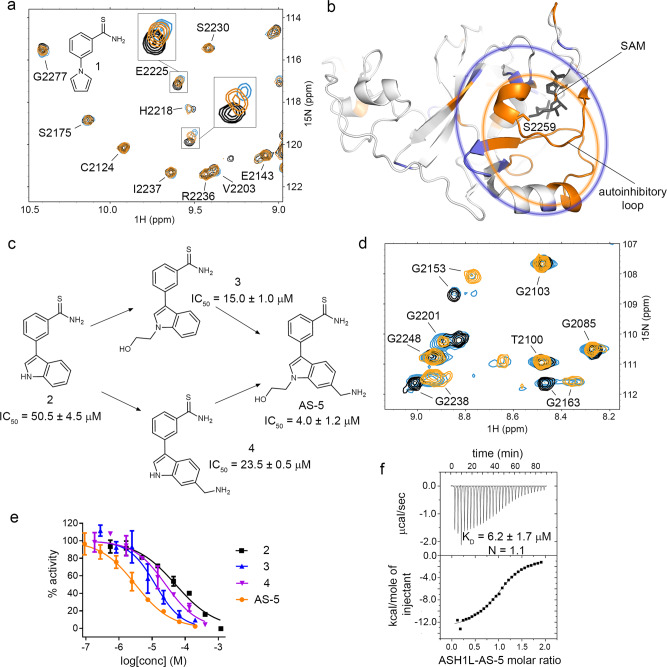
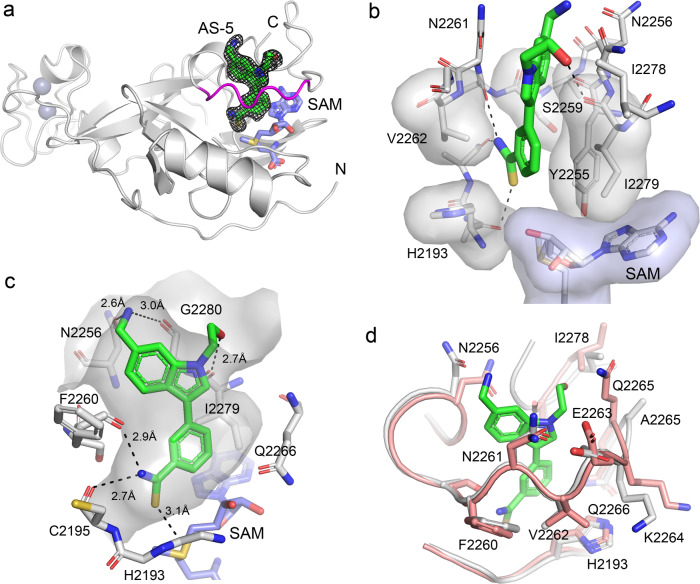
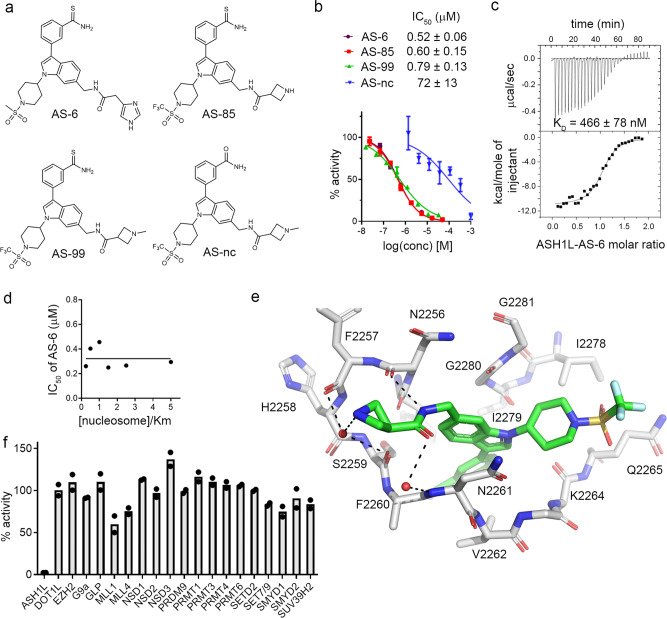
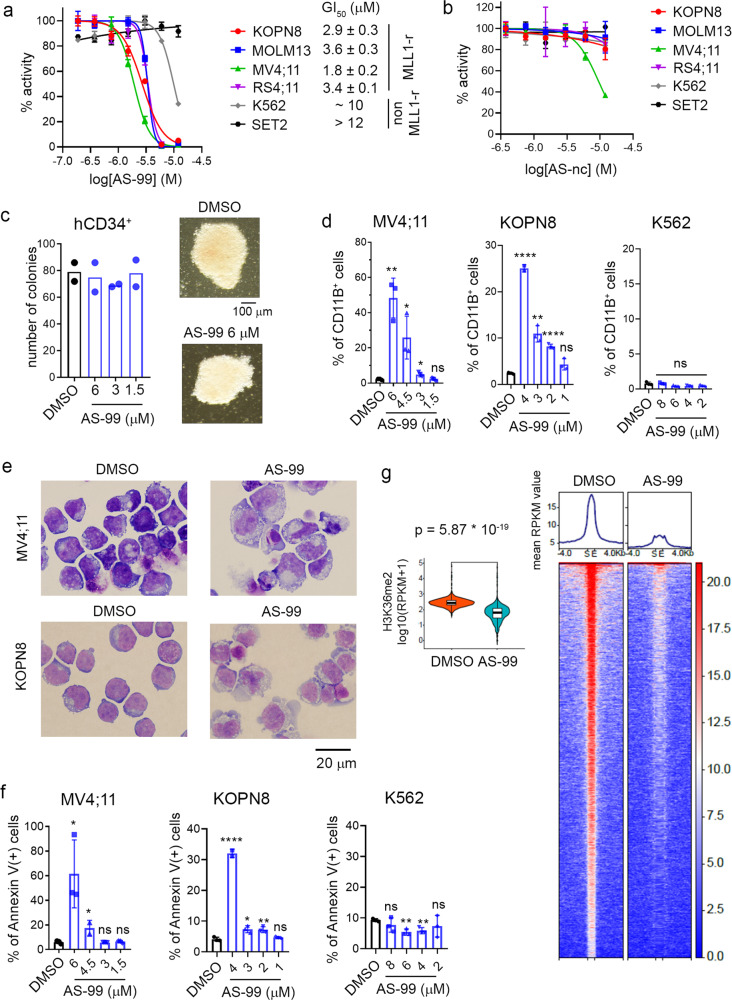
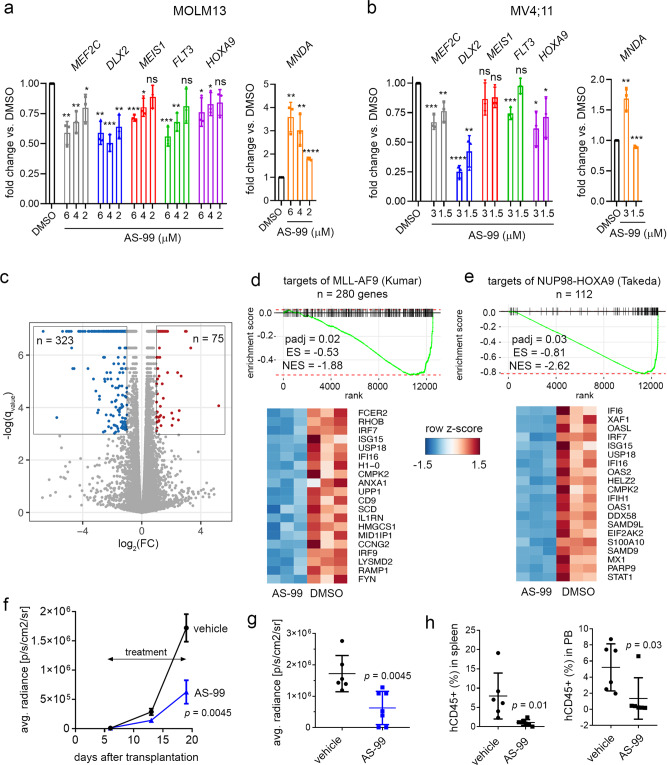
ASH1L histone methyltransferase plays a crucial role in the pathogenesis of different diseases, including acute leukemia. While ASH1L represents an attractive drug target, developing ASH1L inhibitors is challenging, as the catalytic SET domain adapts an inactive conformation with autoinhibitory loop blocking the access to the active site. Here, by applying fragment-based screening followed by medicinal chemistry and a structure-based design, we developed first-in-class small molecule inhibitors of the ASH1L SET domain. The crystal structures of ASH1L-inhibitor complexes reveal compound binding to the autoinhibitory loop region in the SET domain. When tested in MLL leukemia models, our lead compound, AS-99, blocks cell proliferation, induces apoptosis and differentiation, downregulates MLL fusion target genes, and reduces the leukemia burden in vivo. This work validates the ASH1L SET domain as a druggable target and provides a chemical probe to further study the biological functions of ASH1L as well as to develop therapeutic agents.


Conflict of interest statement

J.G., T.C., D.R., H.L., J. D., S.K., H.M., T.P., E.K., M.S., D.B., and J. Z. are co-inventors on patent applications covering ASH1L inhibitors. T.C. and J.G. received prior research support from Kura Oncology Inc. for unrelated project; served as consultants in Kura Oncology and have equity ownership in the company. The remaining authors declare that they have no competing interests with this study.

Figures

Fig. 1
Fig. 1. SET domain of ASH1L is essential for efficient transformation by MLL fusion oncogenes.
a Normalized colony counts from the round four of colony-forming assay performed in mouse bone marrow (BM) progenitor cells derived from the WT or SET Ash1l mice and transduced with MLL-AF9, MLL-AF6, HOXA9/MEIS1 (HM-2), E2A-HLF or vector alone (MSCV). n = 2. b, c Representative pictures of colonies (b) or Wright-Giemsa stained cytospins (c) from the round four of colony assay performed in bone marrow cells derived from WT or SET Ash1l mice and transduced with MLL-AF9 or HOXA9/MEIS1 (HM-2). The experiment was repeated twice with similar results. d Quantitative RT-PCR performed in BM cells derived from WT or SET Ash1l mice and transduced with MLL-AF9 or MLL-AF6. Gene expression was normalized to Gapdh and gene expression changes in SET Ash1l cells were referenced to the corresponding values in the WT Ash1l background. Data represent two independent experiments each performed in duplicates.
Fig. 2
Fig. 2. Development and characterization of ASH1L inhibitors.
a Structure of the fragment hit, compound 1, and its binding to ASH1L SET domain. Superposition of the 1H-15N TROSY-HSQC spectra of 100 µM ASH1L with 5% DMSO (black) with 500 µM (orange) or 1 mM (blue) of compound 1. b Chemical shift perturbations upon binding of 1 to ASH1L mapped on the crystal structure of ASH1L SET domain (PDB code 4YNM). Residues experiencing chemical shift perturbations calculated as HN=(δHN2+δN2) larger than 15 Hz are colored and encircled in violet. Residues unobserved or unassigned are colored and encircled in orange. c Chemical structures and activities for selected ASH1L inhibitors. IC50 values represent mean ± s.d. from two independent experiments. d Superposition of the 1H-15N TROSY-HSQC spectra of 100 µM ASH1L with 5% DMSO (black) and with 500 µM (orange) or 100 µM (blue) of AS-5. e Titration curves from the HMT assay for ASH1L with compounds presented in panel (c) mean ± s.d. Representative curves are shown from two independent experiments, each performed in duplicates. f Binding isotherm from the ITC experiment performed for the binding of AS-5 to ASH1L. Data are mean ± s.d. from two independent experiments. A representative binding isotherm is shown. N represents stoichiometry of binding.
Fig. 3
Fig. 3. Crystal structure of ASH1L SET in complex with AS-5.
a Overall structure of ASH1L-AS-5 complex with 2Fo-Fc electron density map for AS-5 contoured at the 1σ level. Protein is shown as ribbon with autoinhibitory loop in magenta and AS-5 shown in sticks with green carbons. b ASH1L residues involved in hydrophobic contacts with AS-5 shown in sticks and transparent surfaces (gray) and SAM is shown in sticks with the blue surface. Hydrogen bonds and chalcogen bonds are shown as dashed lines. Color-coding: AS-5 carbons (green), protein and SAM carbons (gray), oxygens (red), nitrogen (blue), sulfur (yellow). c Details of internal pocket in ASH1L (shown as semi-transparent surface) and binding mode of AS-5 (shown in sticks with green carbons). Selected residues in the ASH1L binding site are shown as sticks with color coding is as in panel (c). Hydrogen bonds and chalcogen bonds are shown as dashed lines with distances in Å. d Superposition of ASH1L structure (PDB code 4YNM with salmon carbons) on the structure of ASH1L-AS-5 complex (protein with gray carbons and AS-5 with green carbons).
Fig. 4
Fig. 4. Structure-based optimization of ASH1L inhibitors.
a Chemical structures of ASH1L inhibitors developed using structure-based design. b Titration curves and IC50 values from the HMT assay. Data are mean ± s.d. from two independent experiments. c Binding isotherm from the ITC experiment performed for the binding of AS-6 to ASH1L. Data are mean ± s.d. from two independent experiments. A representative binding isotherm is shown. d Mechanistic studies from HMT assay with the IC50 values for AS-6 measured at various nucleosome concentration demonstrating non-competitive inhibition with nucleosome. e Crystal structure of ASH1L-AS-85 complex determined at 1.69 Å resolution. Selected ASH1L residues (gray carbons) and AS-85 (green carbons) are shown in sticks. Hydrogen bonds are shown as dashed lines. f Selectivity of AS-99 tested at 50 µM concentration against a panel of histone methyltransferases. Data represent two independent experiments each performed in duplicates.
Fig. 5
Fig. 5. Cellular activity of ASH1L inhibitor AS-99.
a, Titration curves from the MTT cell viability assay performed after 7 days of treatment of human MLL1 rearranged (MLL1-r) leukemia cell lines (MV4;11, MOLM13, KOPN8, RS4;11) and control leukemia cell lines, non–MLL1-r (K562 and SET2) with AS-99 (a) or AS-nc (b); mean ± SD, n = 4 biological replicates. Representative graphs are shown from 2–3 independent experiments. GI50 values correspond to AS-99 concentrations required to achieve 50% inhibition of cell proliferation. c Colony counts and representative images of colonies from the colony-forming assay performed with normal human hematopoietic CD34+ cells isolated from cord blood treated for 7 days with DMSO or AS-99; mean ± SD, n = 2. The experiment was performed twice. Representative data is shown. d Quantification of CD11B expression in human leukemia cells treated for 7 days with AS-99, detected by flow cytometry; mean ± SD, n = 3 biological replicates. P values (MV4;11: 6 µM: 0.0021, 4.5 µM: 0.026, 3 µM: 0.028, 1.5 µM: 0.73); KOPN8 (4 µM <0.0001, 3 µM: 0.0012, 2 µM: <0.0001, 1 µM: 0.055); K562 (8 µM: 0.78, 6 µM: 0.070, 4 µM: 0.055, 2 µM: 0.081) were calculated using unpaired 2-tailed t test. Two independent experiments were performed for each cell line in triplicates. Representative graphs are shown. Gating strategy is presented in Supplementary Fig. 8c. e Wright-Giemsa–stained cytospins for MV4;11 and KOPN8 cells after 7 days of treatment with DMSO or AS-99: in MV4;11 at 6 µM and in KOPN8 at 4 µM. f Flow cytometry analysis of apoptosis induced by AS-99 in MV4;11, KOPN8, and K562 cells after 7 days of treatment. Mean ± SD, n = 3 biological replicates. P values (MV4;11: 6 µM: 0.026, 4.5 µM: 0.049, 3 µM: 0.65, 1.5 µM: 0.70; KOPN8: 4 µM: < 0.0001, 3 µM: 0.012, 2 µM: 0.010, 1 µM: 0.24; K562: 8 µM: 0.31, 6 µM: 0.004, 4 µM: 0.006, 2 µM: 0.39) were calculated using unpaired 2-tailed t test. Two independent experiments were performed in triplicates. Representative graphs are shown. *P < 0.05; **P < 0.01; ****P < 0.0001; NS not significant. Gating strategy is presented in Supplementary Fig. 8d. g CUT&RUN experiment in MV4;11 cells treated with AS-99 (5.5 µM) or DMSO showing H3K36me2 peaks. The rows show the RPKM (Reads Per Kilobase Million) values on the peaks (normalized to 1 kb) and 4 kb regions flanking the peaks. Peaks were sorted by total normalized signals of DMSO-treated cells within each category. Violin plots show the RPKM values of each peak in DMSO and AS-99 treated cells. The boxes represent 25th (minima) and 75th (maxima) percentile and the lines represent the median. The high and low whisker ends are the largest values within 1.5-times interquartile range above 75th and the smallest value within 1.5-times interquartile range below the 25th percentile, respectively. Mann–Whitney two-sided U test was used for statistical analysis to compare the difference of signals between DMSO- and AS-99-treated cells.
Fig. 6
Fig. 6. AS-99 impairs transcriptional program of MLL fusion proteins and reduces leukemia burden.
a, b Quantitative RT-PCR performed in MOLM13 cells (a) or MV4;11 cells (b) after 7 days of treatment with AS-99. Gene expression was normalized to HPRT1 and referenced to the DMSO treated cells. Representative data from two independent experiments, each performed in triplicates (mean ± SD, n = 3 biological replicates) are shown. P values were calculated using unpaired 2-tailed t test. For gene expression in MOLM13 cells, the P values are as follows: MEF2C: 6 µM: 0.0017, 4 µM: 0.0035, 2 µM: 0.036, DLX2: 6 µM 0.0017, 4 µM: 0.0003, 2 µM: 0.0032, MEIS1: 6 µM: < 0.0001, 4 µM: 0.011, 2 µM: 0.12; FLT3: 6 µM: 0.0007, 4 µM: 0.0018, 2 µM: 0.086; HOXA9: 6 µM: 0.026, 4 µM: 0.038, 2 µM: 0.064; MNDA: 6 µM: 0.0021, 4 µM: 0.0068, 2 µM: <0.0001. For gene expression in MV4;11 cells, the P values are as follows: MEF2C: 3 µM: 0.0007, 1.5 µM: 0.009, DLX2: 3 µM: <0.0001, 1.5 µM: 0.0017, MEIS1: 3 µM: 0.16, 1.5 µM: 0.074, FLT3: 3 µM: 0.0010, 1.5 µM: 0.57, HOXA9: 3 µM: 0.010, 1.5 µM: 0.044, MNDA: 3 µM: 0.0031, 1.5 µM: 0.0004. *P < 0.05; **P < 0.01; ***P < 0.001; ****P < 0.0001; NS not significant. c Results from RNA-seq studies for AS-99 (3 µM) versus DMSO-treated MV4;11 cells. Volcano plot showing q-values for differential expression analysis of each gene versus fold-change (FC) for AS-99 over DMSO-treated cells. Blue dots indicate significantly downregulated genes, red dots indicate significantly upregulated genes (q < 0.05, fold-change > 2). d, e Plots showing enriched gene sets upon treatment of MV4;11 cells with AS-99 or DMSO determined by fgsea for defined targets of MLL-AF9 (d) or targets of NUP98-HOXA9 (e). The top 20 differentially expressed genes from the Leading Edge of the indicated fgsea analysis are shown below each of the enrichment plots. padj = adjusted p value; ES enrichment score, NES normalized enrichment score. fh Effect of AS-99 (30 mg/kg, q.d., i.p.) on leukemia burden in the MV4;11 xenotransplantation murine model. Quantification of bioluminescence signal in mice treated with AS-99 (n = 7 mice) or vehicle (n = 6 mice) at the indicated days. Mean ± SEM (f). Quantification of bioluminescence signal shown for individual mice at the last day of treatment (day 19 post-transplantation). Mean ± SD (g). Flow cytometry quantification of human CD45+ cells in spleen, and blood samples harvested from the mice after last day of treatment with AS-99 (n = 7 mice) or vehicle (n = 6 mice) (h). Mean ± SD. P values were calculated using the unpaired 2-tailed t test. Gating strategy is presented in Supplementary Fig. 11e.

Similar articles

Cited by

References

    1. Dawson MA, Kouzarides T. Cancer epigenetics: from mechanism to therapy. Cell. 2012;150:12–27. doi: 10.1016/j.cell.2012.06.013. - DOI - PubMed
    1. Rogawski DS, Grembecka J, Cierpicki T. H3K36 methyltransferases as cancer drug targets: rationale and perspectives for inhibitor development. Future Med Chem. 2016;8:1589–1607. doi: 10.4155/fmc-2016-0071. - DOI - PMC - PubMed
    1. Wagner EJ, Carpenter PB. Understanding the language of Lys36 methylation at histone H3. Nat. Rev. Mol. Cell Biol. 2012;13:115–126. doi: 10.1038/nrm3274. - DOI - PMC - PubMed
    1. Jones M, et al. Ash1l controls quiescence and self-renewal potential in hematopoietic stem cells. J. Clin. Invest. 2015;125:2007–2020. doi: 10.1172/JCI78124. - DOI - PMC - PubMed
    1. Miyazaki H, et al. Ash1l methylates Lys36 of histone H3 independently of transcriptional elongation to counteract polycomb silencing. PLoS Genet. 2013;9:e1003897. doi: 10.1371/journal.pgen.1003897. - DOI - PMC - PubMed

Publication types

MeSH terms