. 2021 May 14;7(1):45.
doi: 10.1038/s41522-021-00215-6.

Real-time monitoring of ruminal microbiota reveals their roles in dairy goats during subacute ruminal acidosis

Affiliations

Real-time monitoring of ruminal microbiota reveals their roles in dairy goats during subacute ruminal acidosis

Xiaodong Chen et al. NPJ Biofilms Microbiomes. .

Abstract

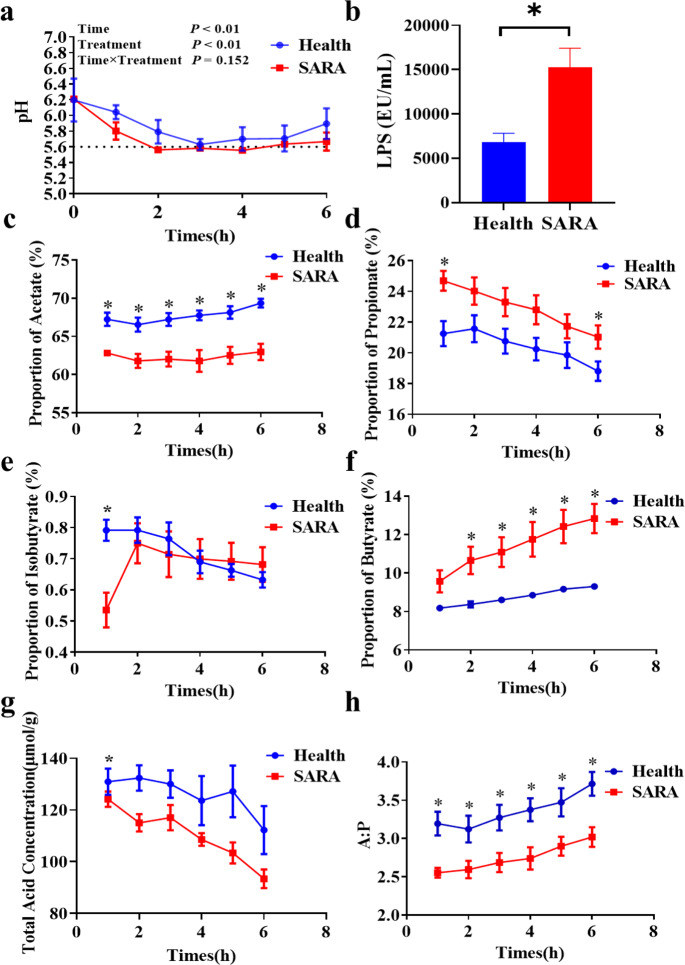
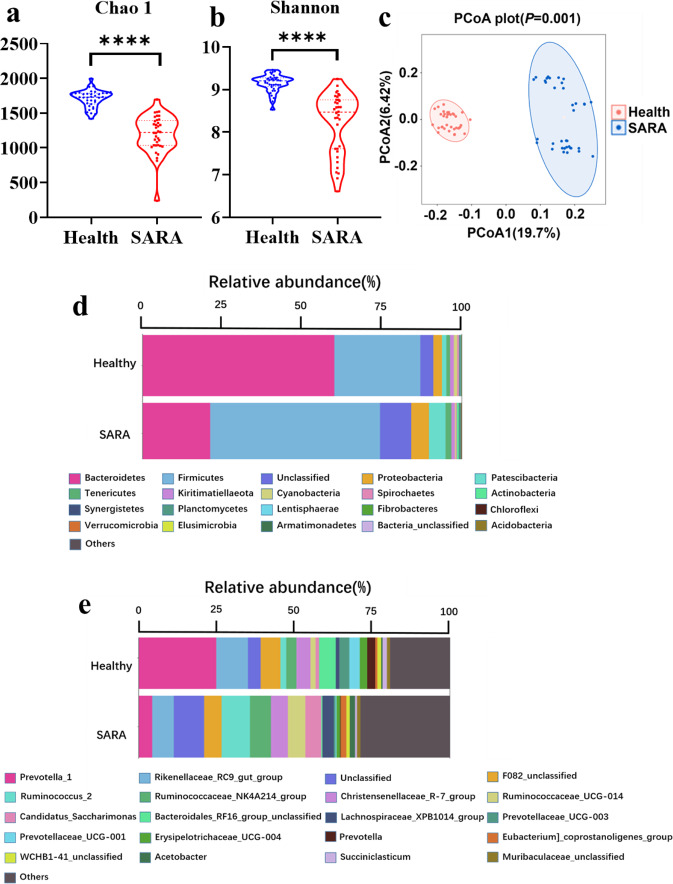
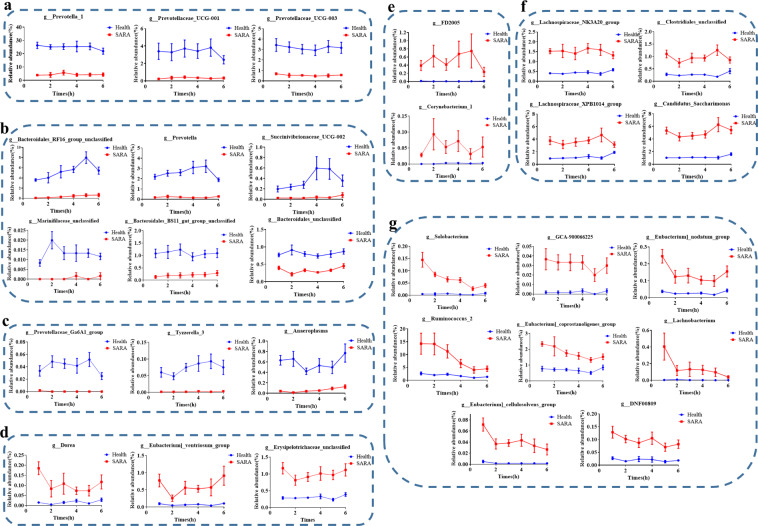
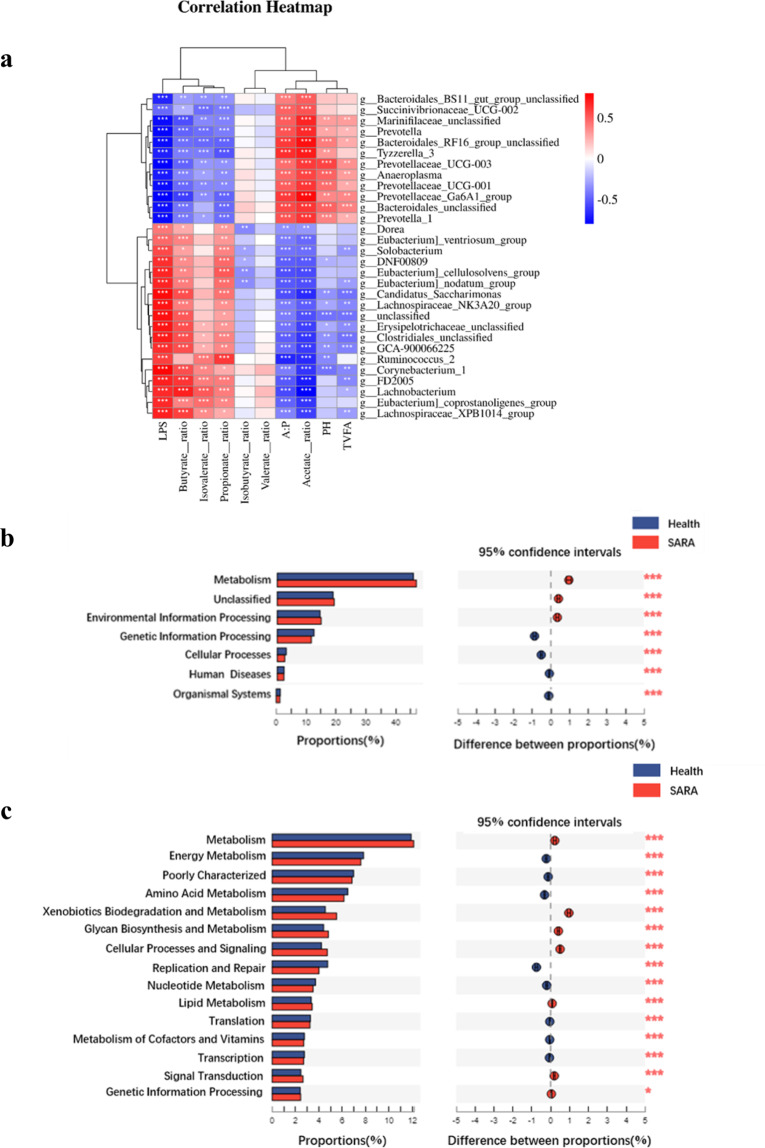
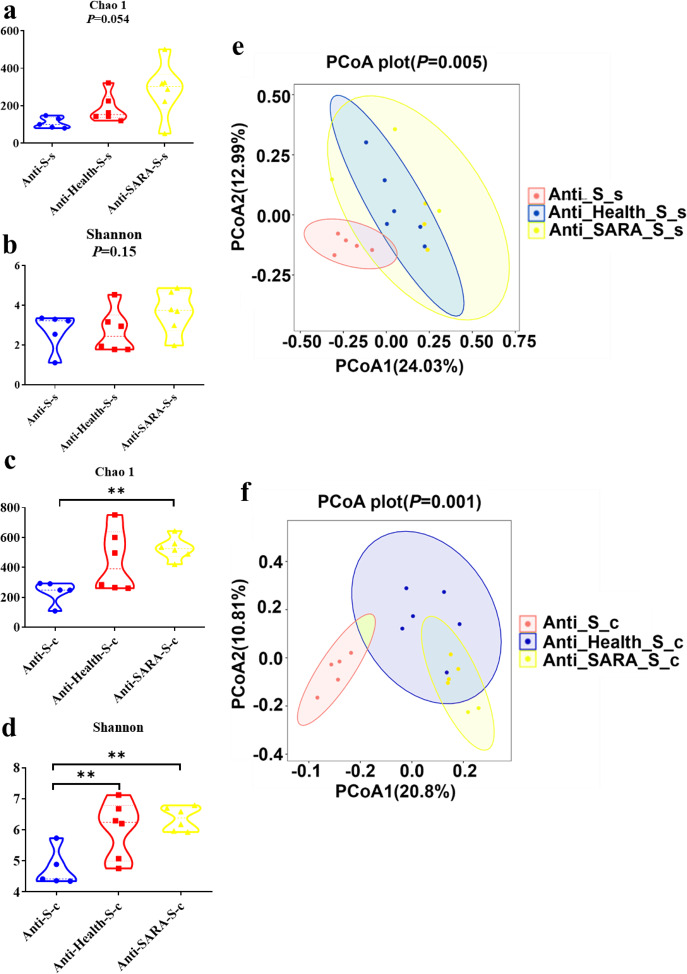
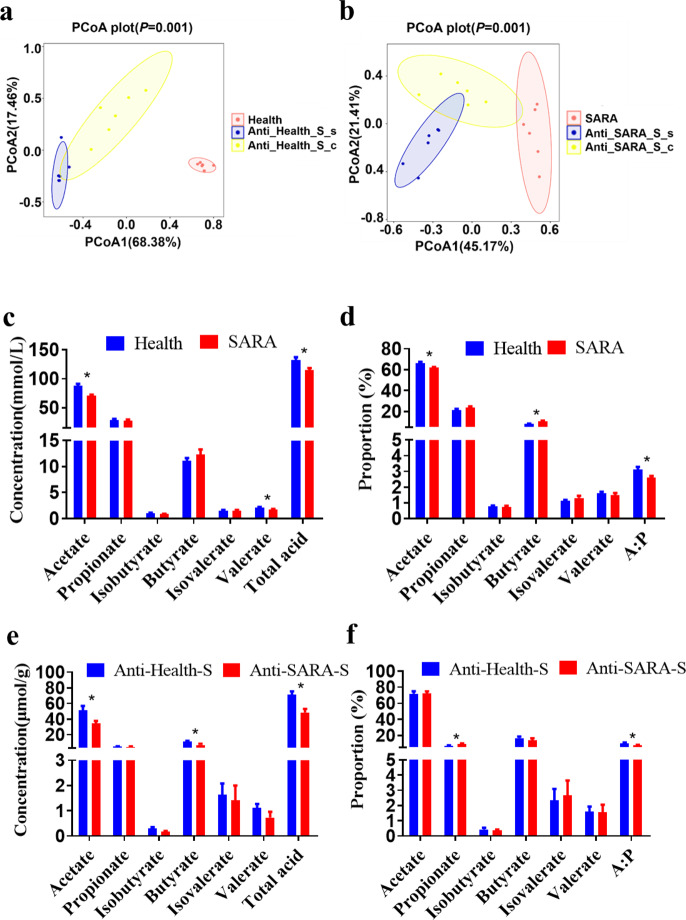
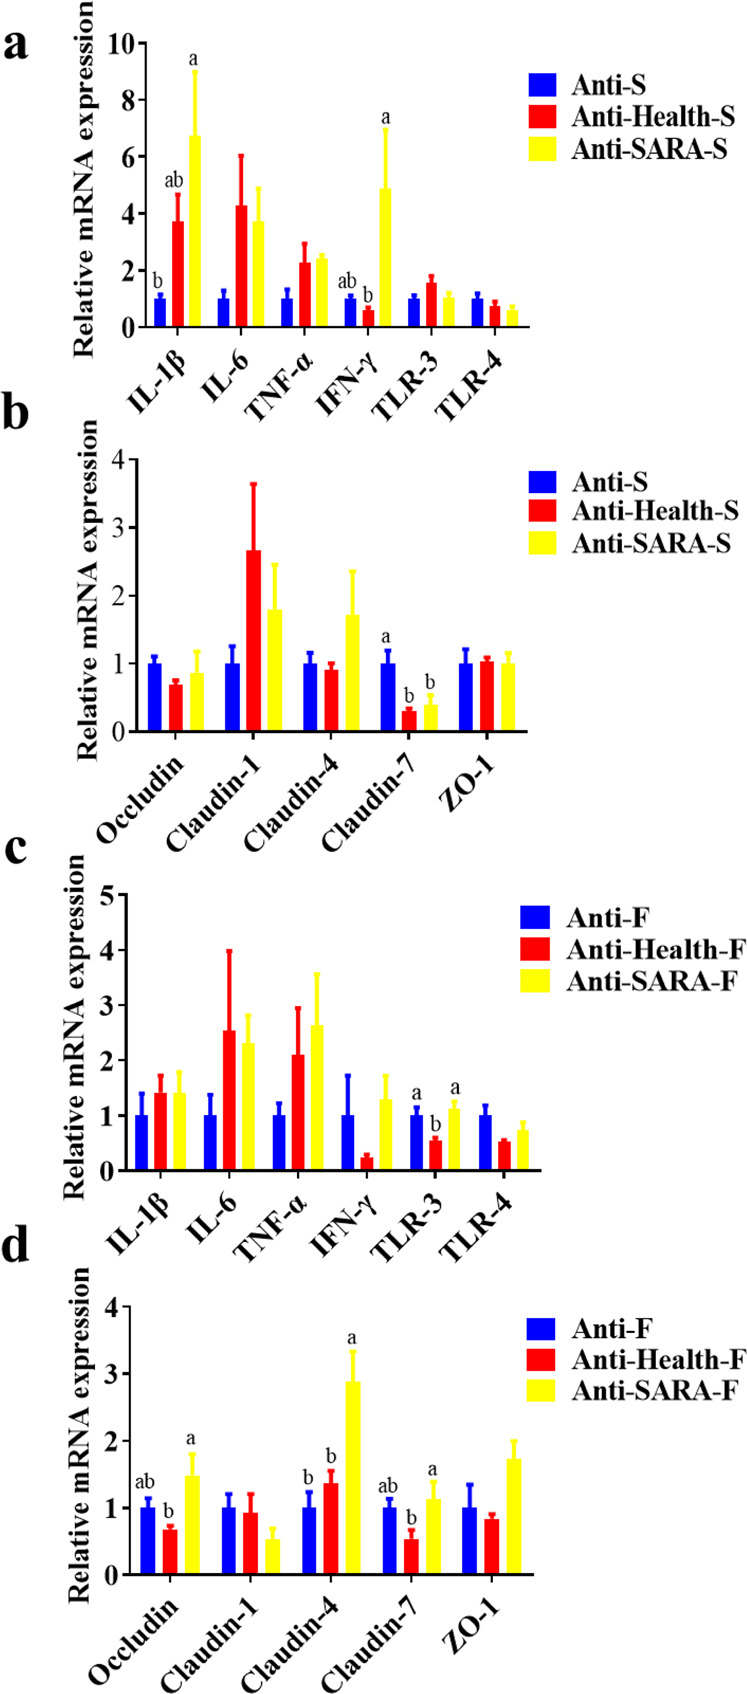
Ruminal microbiota changes frequently with high grain diets and the occurrence of subacute ruminal acidosis (SARA). A grain-induced goat model of SARA, with durations of a significant decrease in the rumen pH value to less than 5.6 and an increase in the rumen lipopolysaccharides concentration, is constructed for real-time monitoring of bacteria alteration. Using 16 S rRNA gene sequencing, significant bacterial differences between goats from the SARA and healthy groups are identified at every hour for six continuous hours after feeding. Moreover, 29 common differential genera between two groups over 6 h after feeding are all related to the altered pH and lipopolysaccharides. Transplanting the microbiota from donor goats with SARA could induce colonic inflammation in antibiotic-pretreated mice. Overall, significant differences in the bacterial community and rumen fermentation pattern between the healthy and SARA dairy goats are real-time monitored, and then tested using ruminal microbe transplantation to antibiotic-treated mice.


Conflict of interest statement

The authors declare no competing interests.

Figures

Fig. 1
Fig. 1. Rumen fermentation in two groups of dairy goat donors.
a Changes in the rumen pH values of two groups of dairy goats 6 ho after feeding. b The difference in the LPS concentration in the rumen of two groups of dairy goats 2 h after feeding. ch The proportions of (c) acetate, (d) propionate, (e) isobutyrate, (f) butyrate, (g) the ratio of acetate to propionate, and (h) the concentration of total volatile fatty acids of rumen fluid in two groups of dairy goats 6 h after feeding. The rumen pH values (a) were analyzed by the One-way Repeated Measures ANOVA procedure (the repeated measures analysis in the general linear model procedure). The other indices (bh) were analyzed using the Students’ t-test. Health: the dairy goats in the healthy group, SARA: the dairy goats in the SARA group. *Indicates the difference is at a significant level with p < 0.05, **indicates the difference is at a significant level with p < 0.01. Error bars on the graphs represent standard error.
Fig. 2
Fig. 2. Rumen microbial composition of two groups of dairy goat donors.
a The Chao 1 index and b the Shannon index of rumen microbiomes from two groups of dairy goat donors. A Mann–Whitney U test was carried out for comparing the two groups a, b. c Principal Coordinate Analysis (PCoA) of rumen microbiomes from two groups of dairy goat donors. The data was statistically analyzed based on ANOSIM analysis. d Average relative abundance of microbiota at the phylum level and e average relative abundance of microbiota at the genus level in SARA and healthy groups; Those bacteria whose relative abundance was less than 1% were classified as others. Health: rumen microorganisms from every hour for 6 consecutive hours after morning feeding of healthy dairy goats, SARA: rumen microorganisms from every hour for 6 consecutive hours after morning feeding of SARA dairy goats. *Indicates the difference is at a significant level with p < 0.05, **indicates the difference is at a significant level with p < 0.01. Error bars on the graphs represent standard error.
Fig. 3
Fig. 3. Dynamic changes in the common rumen differential bacteria (P < 0.05) during 6 h after feeding in donors from the SARA and healthy groups.
a The relative abundance of the bacteria that increased significantly (FDR < 0.05) in the healthy group gradually decreased over time. b The relative abundance of the bacteria that increased significantly (FDR < 0.05) in the healthy group increased first and then decreased over time. c The relative abundance of the bacteria that increased significantly (FDR < 0.05) in the healthy group has unique changing laws over time. d The relative abundance of the bacteria that increased significantly (FDR < 0.05) in the SARA group changed with time and shows a “W” shape. e The relative abundance of the bacteria that increased significantly (FDR < 0.05) in the SARA group changed with time and displays an “M” shape. f The relative abundance of the bacteria that increased significantly (FDR < 0.05) in the SARA group decreased first, then increased and decreased over time. g The relative abundance of the bacteria that increased significantly (FDR < 0.05) in the SARA group gradually decreased over time. The Mann-Whitney U test was used with multiple comparisons adjusted by the Benjamini–Hochberg FDR to rank bacteria that were significantly different in their genus levels. All bacteria listed here were all significantly changed bacteria with FDR < 0.05 between SARA and Healthy groups in all 6 h after morning feeding. Health: the dairy goats from the healthy group, SARA: the dairy goats from the SARA group. Error bars on the graphs represent standard error.
Fig. 4
Fig. 4. Correlation analysis and function prediction.
a The Pearson correlation between the common genus-level differences in the bacteria during 6 h after feeding in donors from the two groups and their rumen fermentation parameters. b Prediction of the differential function of rumen microbes between two groups of dairy goat donors in multiple KEGG (level 1) categories based on PICRUSt 2. c Prediction of the differential function of rumen microbes between two groups of dairy goat donors in multiple KEGG (level 2) categories based on PICRUSt 2. Health: the dairy goats from the healthy group, SARA: the dairy goats of the SARA group. The Mann-Whitney U test was used with multiple comparisons adjusted by the Benjamini–Hochberg FDR to rank pathways that were significantly different in predicted metagenome pathways analysis. *Indicates the difference is at a significant level with p < 0.05, **indicates the difference is at a significant level with p < 0.01.
Fig. 5
Fig. 5. Effects of ruminal microbe transplantation (RMT) on the intestinal microbial composition of antibiotic-treated mice.
a The Chao 1 index and b the Shannon index of the small intestine bacterial community after antibiotic-treated mice RMT. c The Chao 1 index and d the Shannon index of the colonic bacterial community after RMT in antibiotic-treated mice. The data of (ad) were statistically analyzed using the Kruskal-Wallis test with Dunn’s post-hoc test. e Principal Coordinates Analysis of the small intestine bacterial community after RMT in antibiotic-treated mice. f Principal Coordinates Analysis of the colonic bacterial community after RMT in antibiotic-treated mice. The data of (e) and (f) were statistically analyzed based on ANOSIM analysis. Anti: mice taking antibiotics; Health: mice infused by intragastric gavage with rumen fluid from health dairy goats; SARA: mice infused by intragastric gavage with rumen fluid from SARA dairy goats; S: high starch diet for mice; s: small intestine of mice; and c: mice colon. *Indicates the difference is at a significant level with p < 0.05, **indicates the difference is at a significant level with p < 0.01.
Fig. 6
Fig. 6. The intestinal microbial composition and intestinal fermentation parameters alterations of antibiotic-treated mice were identified after ruminal microbe transplantation (RMT).
a Principal coordinate analysis of mouse (infused by intragastric gavage with rumen fluid from healthy dairy goats) intestinal bacterial community and donor (healthy dairy goats) rumen bacterial community based on the weighted UniFrac distance. b Principal Coordinate Analysis of mouse (infused by intragastric gavage with rumen fluid from SARA dairy goats) intestinal bacterial community and donor (SARA dairy goats) rumen bacterial community based on the weighted UniFrac distance. The data of (a) and (b) were statistically analyzed based on the ANOSIM analysis. c The concentration and d relative proportion of VFA in the rumen of healthy and SARA donors. e The concentration and f relative proportion of VFA in colons from mice given a high starch diet after RMT in antibiotic-treated mice. The data for (cf) were analyzed using the Students’ t-test, and expressed as the means with the standard error. Anti: mice taking antibiotics; Health: mice infused by intragastric gavage with rumen fluid from healthy dairy goats; SARA: mice infused by intragastric gavage with rumen fluid from SARA dairy goats; S: high starch diet for mice; s: small intestine of mice; and c: mice colon. *Indicates the difference is at a significant level with p < 0.05, **indicates the difference is at a significant level with p < 0.01. Error bars on the graphs represent standard error.
Fig. 7
Fig. 7. Effects of ruminal microbe transplantation (RMT) on colon inflammation and intestinal epithelial permeability of antibiotic-treated mice.
a The relative mRNA expression of cytokines and b tight junction proteins in the colon epithelia in antibiotic-treated mice receiving a high starch diet after RMT. c The relative mRNA expression of cytokines and d tight junction proteins in the colon epithelia of antibiotic-treated mice fed with a high fibre diet after RMT. The data were analyzed using the ANOVA test. If a significant treatment effect was observed by ANOVA, the significant difference between treatments was identified by Duncan’s multiple comparisons test. Anti: mice taking antibiotics; Health: mice infused by intragastric gavage with rumen fluid from healthy dairy goats; SARA: mice infused by intragastric gavage with rumen fluid from SARA dairy goats; S: high starch diet for mice; F: high fibre diet for mice. a-b Mean values within an index with the same superscript letters indicated no significant difference (P < 0.05). Error bars on the graphs represent standard error.

References

    1. Sekirov I, Russell SL, Antunes LCM, Finlay BB. Gut microbiota in health and disease. Physiol. Rev. 2010;90:859–904. doi: 10.1152/physrev.00045.2009. - DOI - PubMed
    1. Backhed F, et al. The gut microbiota as an environmental factor that regulates fat storage. Proc. Natl Acad. Sci. USA. 2004;101:15718–15723. doi: 10.1073/pnas.0407076101. - DOI - PMC - PubMed
    1. Ma N, He T, Johnston LJ, Ma X. Host–microbiome interactions: the aryl hydrocarbon receptor as a critical node in tryptophan metabolites to brain signaling. Gut Microbes. 2020;11:1203–1219. doi: 10.1080/19490976.2020.1758008. - DOI - PMC - PubMed
    1. Holmes E, Li JV, Marchesi JR, Nicholson JK. Gut microbiota composition and activity in relation to host metabolic phenotype and disease risk. Cell Metab. 2012;16:559–564. doi: 10.1016/j.cmet.2012.10.007. - DOI - PubMed
    1. Hooda S, et al. 454 Pyrosequencing reveals a shift in fecal microbiota of healthy adult men consuming polydextrose or soluble corn fiber. J. Nutr. 2012;142:1259–1265. doi: 10.3945/jn.112.158766. - DOI - PubMed

Publication types

LinkOut - more resources