Phytochemicals from Ajwa dates pulp extract induce apoptosis in human triple-negative breast cancer by inhibiting AKT/mTOR pathway and modulating Bcl-2 family proteins
- PMID: 33990623
- PMCID: PMC8121835
- DOI: 10.1038/s41598-021-89420-z
Phytochemicals from Ajwa dates pulp extract induce apoptosis in human triple-negative breast cancer by inhibiting AKT/mTOR pathway and modulating Bcl-2 family proteins
Abstract
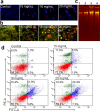
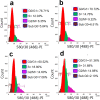
Ajwa dates (Phoenix dactylifera L.) have been described in traditional and alternative medicine to provide several health benefits, but their mechanism of apoptosis induction against human triple-negative breast cancer MDA-MB-231 cells remains to be investigated. In this study, we analyzed the phytoconstituents in ethanolic Ajwa Dates Pulp Extract (ADPE) by liquid chromatography-mass spectrometry (LC-MS) and investigated anticancer effects against MDA-MB-231 cells. LC-MS analysis revealed that ADPE contained phytocomponents belonging to classes such as carbohydrates, phenolics, flavonoids and terpenoids. MTT assay demonstrated statistically significant dose- and time-dependent inhibition of MDA-MB-231 cells with IC50 values of 17.45 and 16.67 mg/mL at 24 and 48 h, respectively. Hoechst 33342 dye and DNA fragmentation data showed apoptotic cell death while AO/PI and Annexin V-FITC data revealed cells in late apoptosis at higher doses of ADPE. More importantly, ADPE prompted reactive oxygen species (ROS) induced alterations in mitochondrial membrane potential (MMP) in ADPE treated MDA-MB-231 cells. Cell cycle analysis demonstrated that ADPE induced cell arrest in S and G2/M checkpoints. ADPE upregulated the p53, Bax and cleaved caspase-3, thereby leading to the downregulation of Bcl-2 and AKT/mTOR pathway. ADPE did not show any significant toxicity on normal human peripheral blood mononuclear cells which suggests its safe application to biological systems under study. Thus, ADPE has the potential to be used as an adjunct to the mainline of treatment against breast cancer.
Conflict of interest statement
The authors declare no competing interests.
Figures


Similar articles
-
Ajwa Date (Phoenix dactylifera L.) Extract Inhibits Human Breast Adenocarcinoma (MCF7) Cells In Vitro by Inducing Apoptosis and Cell Cycle Arrest.PLoS One. 2016 Jul 21;11(7):e0158963. doi: 10.1371/journal.pone.0158963. eCollection 2016. PLoS One. 2016. PMID: 27441372 Free PMC article.
-
Anticancer potential of Phoenix dactylifera L. seed extract in human cancer cells and pro-apoptotic effects mediated through caspase-3 dependent pathway in human breast cancer MDA-MB-231 cells: an in vitro and in silico investigation.BMC Complement Med Ther. 2022 Mar 15;22(1):68. doi: 10.1186/s12906-022-03533-0. BMC Complement Med Ther. 2022. PMID: 35291987 Free PMC article.
-
PDB-1 from Potentilla discolor Bunge induces apoptosis and autophagy by downregulating the PI3K/Akt/mTOR signaling pathway in A549 cells.Biomed Pharmacother. 2020 Sep;129:110378. doi: 10.1016/j.biopha.2020.110378. Epub 2020 Jun 13. Biomed Pharmacother. 2020. PMID: 32544818
-
The Anticancer Effects and Therapeutic Potential of Kaempferol in Triple-Negative Breast Cancer.Nutrients. 2024 Jul 23;16(15):2392. doi: 10.3390/nu16152392. Nutrients. 2024. PMID: 39125273 Free PMC article. Review.
-
Molecular Targets of Plant-based Alkaloids and Polyphenolics in Liver and Breast Cancer- An Insight into Anticancer Drug Development.Anticancer Agents Med Chem. 2025;25(5):295-312. doi: 10.2174/0118715206302216240628072554. Anticancer Agents Med Chem. 2025. PMID: 38963106 Review.
Cited by
-
Chemical, biological and in silico assessment of date (P. dactylifera L.) fruits grown in Ha'il region.Front Chem. 2023 Mar 3;11:1138057. doi: 10.3389/fchem.2023.1138057. eCollection 2023. Front Chem. 2023. PMID: 36936534 Free PMC article.
-
Phytochemical profiling and cytotoxic potential of Arnebia nobilis root extracts against hepatocellular carcinoma using in-vitro and in-silico approaches.Sci Rep. 2023 Jul 14;13(1):11376. doi: 10.1038/s41598-023-38517-8. Sci Rep. 2023. PMID: 37452082 Free PMC article.
-
Exploring the ROS-mediated anti-cancer potential in human triple-negative breast cancer by garlic bulb extract: A source of therapeutically active compounds.J Tradit Complement Med. 2024 Apr 11;14(6):644-655. doi: 10.1016/j.jtcme.2024.04.003. eCollection 2024 Nov. J Tradit Complement Med. 2024. PMID: 39850602 Free PMC article.
-
siRNA and targeted delivery systems in breast cancer therapy.Clin Transl Oncol. 2023 May;25(5):1167-1188. doi: 10.1007/s12094-022-03043-y. Epub 2022 Dec 23. Clin Transl Oncol. 2023. PMID: 36562927 Review.
-
Antimicrobial peptide moricin induces ROS mediated caspase-dependent apoptosis in human triple-negative breast cancer via suppression of notch pathway.Cancer Cell Int. 2023 Jun 21;23(1):121. doi: 10.1186/s12935-023-02958-y. Cancer Cell Int. 2023. PMID: 37344820 Free PMC article.
References
-
- Fitzmaurice C, Allen C, Barber RM, Barregard L, Bhutta ZA, Brenner H, Dicker DJ, Chimed-Orchir O, Dandona R, Dandona L, Fleming T. Global, regional, and national cancer incidence, mortality, years of life lost, years lived with disability, and disability-adjusted life-years for 32 cancer groups, 1990 to 2015: a systematic analysis for the global burden of disease study. JAMA Oncol. 2017;3(4):524–548. doi: 10.1001/jamaoncol.2016.5688. - DOI - PMC - PubMed
-
- https://seer.cancer.gov/statfacts/html/breast.html/ (Access on March 05, 2020).
-
- https://www.oncostem.com/blog/alarming-facts-about-breast-cancer-in-india/ (Access on March 10, 2020).
MeSH terms
Substances
LinkOut - more resources
Full Text Sources
Other Literature Sources
Research Materials
Miscellaneous

