Comparative Study
. 2021 May 14;11(1):10327.
doi: 10.1038/s41598-021-89710-6.

Comparison of gene expression and biotransformation activity of HepaRG cells under static and dynamic culture conditions

Affiliations
Comparative Study

Comparison of gene expression and biotransformation activity of HepaRG cells under static and dynamic culture conditions

Loes P M Duivenvoorde et al. Sci Rep. .

Abstract

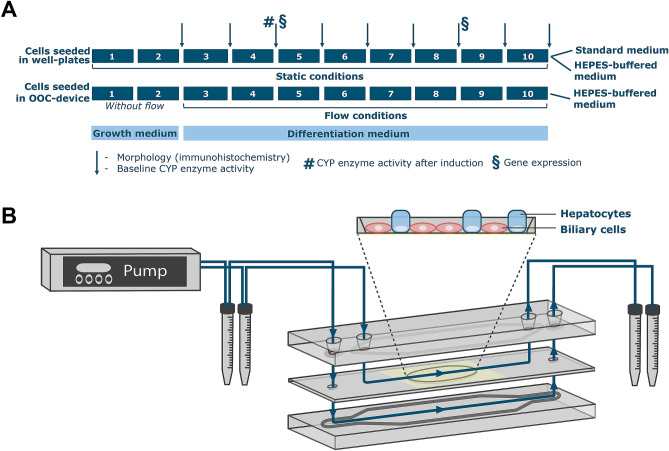
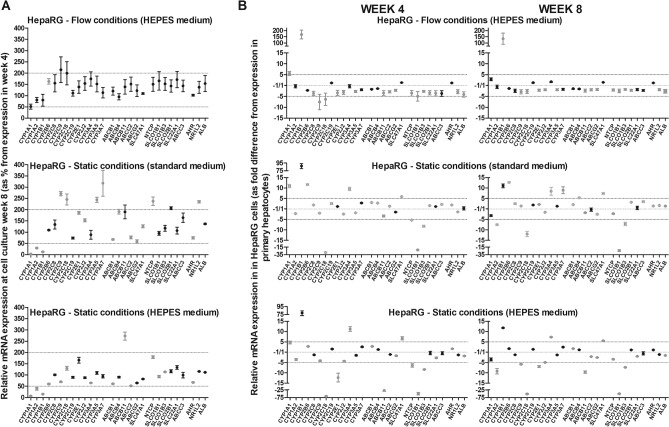
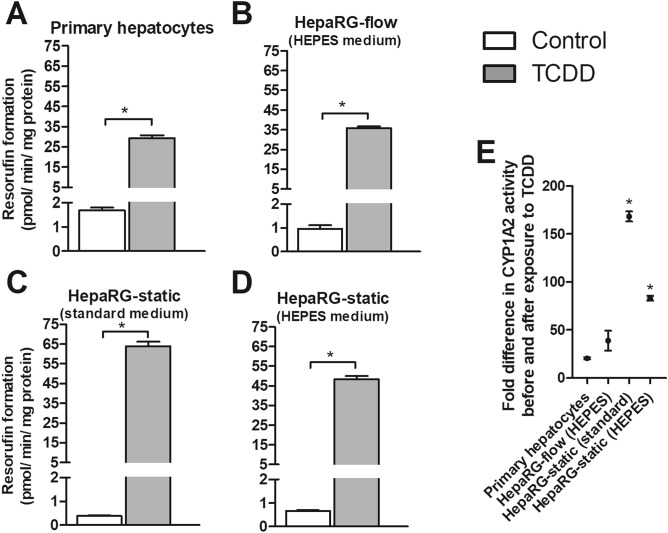
Flow conditions have been shown to be important in improving longevity and functionality of primary hepatocytes, but the impact of flow on HepaRG cells is largely unknown. We studied the expression of genes encoding CYP enzymes and transporter proteins and CYP1 and CYP3A4 activity during 8 weeks of culture in HepaRG cells cultured under static conditions (conventional 24-/96-well plate culture with common bicarbonate/CO2 buffering) and under flow conditions in an organ-on-chip (OOC) device. Since the OOC-device is a closed system, bicarbonate/CO2 buffering was not possible, requiring application of another buffering agent, such as HEPES. In order to disentangle the effects of HEPES from the effects of flow, we also applied HEPES-supplemented medium in static cultures and studied gene expression and CYP activity. We found that cells cultured under flow conditions in the OOC-device, as well as cells cultured under static conditions with HEPES-supplemented medium, showed more stable gene expression levels. Furthermore, only cells cultured in the OOC-device showed relatively high baseline CYP1 activity, and their gene expression levels of selected CYPs and transporters were most similar to gene expression levels in human primary hepatocytes. However, there was a decrease in baseline CYP3A4 activity under flow conditions compared to HepaRG cells cultured under static conditions. Altogether, the present study shows that HepaRG cells cultured in the OOC-device were more stable than in static cultures, being a promising in vitro model to study hepatoxicity of chemicals upon chronic exposure.


Conflict of interest statement

The authors declare no competing interests.

Figures

Figure 1
Figure 1
(A). Schematic overview of the experimental study design (in weeks). The first 2 weeks after seeding, HepaRG cells were cultured in growth medium (proliferation phase). Afterwards, cells were cultured in differentiation medium for the remaining 8 weeks of the experiment. Cells have been reported to be fully differentiated at the end of cell culture week 4. Arrows indicate when basal CYP enzyme activity was determined and confocal images were made, § when gene expression was measured, and # when CYP activity was induced with TCDD and rifampicin. (B) Design of the OOC-device. The chip consists of three glass layers that are pressed together in a chip holder. The silicone gaskets on the upper and lower slide (that are shown in dark grey) form the leak-free boundaries of the apical and basolateral compartment. The blue arrows indicate the flow in and out of the chip. The yellow oval in the middle layer represents the porous membrane on which the cells are grown.
Figure 2
Figure 2
HepaRG cell density as measured as the amount of DNA (A) and protein (B) per cm2 growth area in the OOC-devices (flow conditions; white bars) and in 96-well plates (static conditions; standard medium (light grey bars) and with HEPES medium (dark grey bars)). Differences between weeks within one condition were analyzed with a Kruskal–Wallis test. ns not significant, *P < 0.05.
Figure 3
Figure 3
Stability of gene expression (A) of the selected genes over a period of 4 weeks of cells grown in the OOC-device (flow conditions) and in 24-well plates (static conditions). Expression at week 8 is given as a percentage of the expression at week 4 (mean ± SEM; n = 3). Symbols in grey are significantly different between week 4 and 8 (unpaired Student’s t-test; P < 0.05). Comparison of gene expression in HepaRG cells grown in the OOC-device (flow conditions) and in 24-well plates (static conditions) at week 4 and 8 and in human primary hepatocytes (B). Gene expression in HepaRG cells is presented as the fold difference compared to the expression in primary hepatocytes (mean ± SEM; n = 3). Symbols in grey are significantly different between HepaRG cells and primary hepatocytes (One-way ANOVA and Bonferroni post-hoc; P < 0.05).
Figure 4
Figure 4
Baseline CYP1 (A) and CYP3A4 (B) activity in HepaRG cells cultured under flow (OOC device) and static conditions (96-well plates) from week 2 to 10, and in human primary hepatocytes (mean ± SEM; n = 3–6). aSignificantly different from primary hepatocytes. *Significantly different from HepaRG static culture with standard medium (comparison within the same week, not assessed for primary hepatocytes). One-way ANOVA and Bonferroni post-hoc tests were used for statistical analyses (P < 0.05). Activity was normalized to cell density using protein content data as measured in the cell lysate from the corresponding well/OOC-device. Results of normalization based on DNA content gave similar outcomes (see Suppl. Figure 4).
Figure 5
Figure 5
CYP1 activity of primary hepatocytes (A) and HepaRG cells (BD) before (white bars) and after (grey bars) 48 h exposure to TCDD. HepaRG cells were grown in 24-well plates (static) or in the OOC device (flow) and exposed to TCDD at week 4. *Significant difference with the control (AD, unpaired Student's t-test; P < 0.05) or with the primary hepatocytes (E, One-way ANOVA and Bonferroni; P < 0.05). Activity was normalized to cell density using protein content data as measured in the cell lysate from the corresponding well/OOC device.
Figure 6
Figure 6
CYP3A4 activity of primary hepatocytes (A) and HepaRG cells (BD) before (white bars) and after (grey bars) 48 h exposure to rifampicin. HepaRG cells were grown in 24-well plates (static) or in the OOC device (flow) and exposed to rifampicin at week 4. *Significant difference with the control (AD, unpaired Student's t-test; P < 0.05). Activity was normalized to cell density using protein content data as measured in the cell lysate from the corresponding well/OOC-device.

Similar articles

Cited by

References

    1. Gripon P, Rumin S, Urban S, Le Seyec J, Glaise D, Cannie I, et al. Infection of a human hepatoma cell line by hepatitis B virus. Proc. Natl. Acad. Sci. USA. 2002;99(24):15655–15660. doi: 10.1073/pnas.232137699. - DOI - PMC - PubMed
    1. Aninat C, Piton A, Glaise D, Le Charpentier T, Langouet S, Morel F, et al. Expression of cytochromes P450, conjugating enzymes and nuclear receptors in human hepatoma HepaRG cells. Drug Metab. Dispos. 2006;34(1):75–83. doi: 10.1124/dmd.105.006759. - DOI - PubMed
    1. Hart SN, Li Y, Nakamoto K, Subileau EA, Steen D, Zhong XB. A comparison of whole genome gene expression profiles of HepaRG cells and HepG2 cells to primary human hepatocytes and human liver tissues. Drug Metab. Dispos. 2010;38(6):988–994. doi: 10.1124/dmd.109.031831. - DOI - PMC - PubMed
    1. Kanebratt KP, Andersson TB. Evaluation of HepaRG cells as an in vitro model for human drug metabolism studies. Drug Metab. Dispos. 2008;36(7):1444–1452. doi: 10.1124/dmd.107.020016. - DOI - PubMed
    1. Rogue A, Lambert C, Spire C, Claude N, Guillouzo A. Interindividual variability in gene expression profiles in human hepatocytes and comparison with HepaRG cells. Drug Metab. Dispos. 2012;40(1):151–158. doi: 10.1124/dmd.111.042028. - DOI - PubMed

Publication types

MeSH terms

LinkOut - more resources