. 2021 May 14;4(1):82.
doi: 10.1038/s41746-021-00447-y.

Differential effects of the blood pressure state on pulse rate variability and heart rate variability in critically ill patients

Affiliations

Differential effects of the blood pressure state on pulse rate variability and heart rate variability in critically ill patients

Elisa Mejía-Mejía et al. NPJ Digit Med. .

Abstract

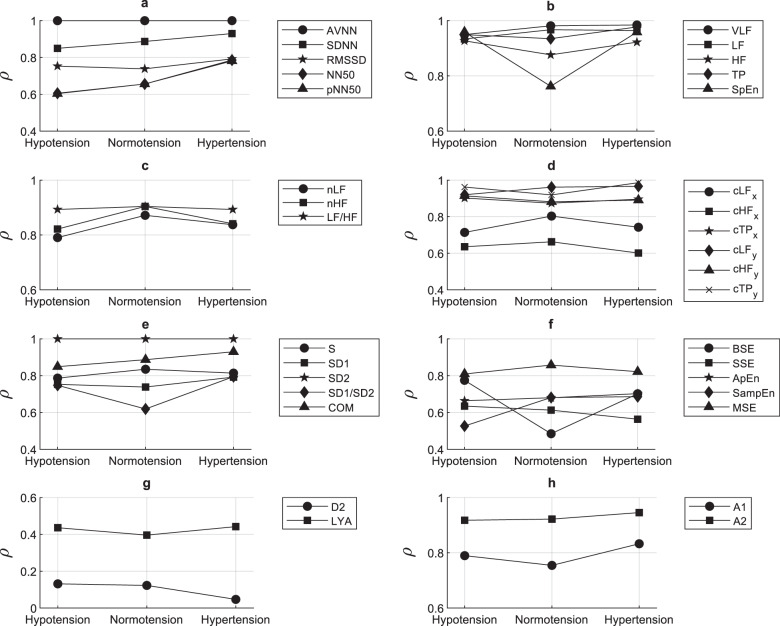
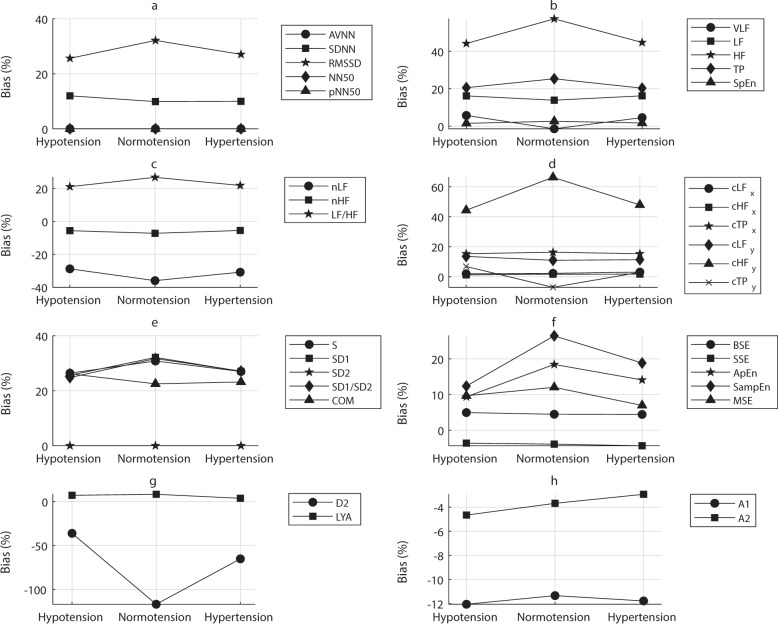
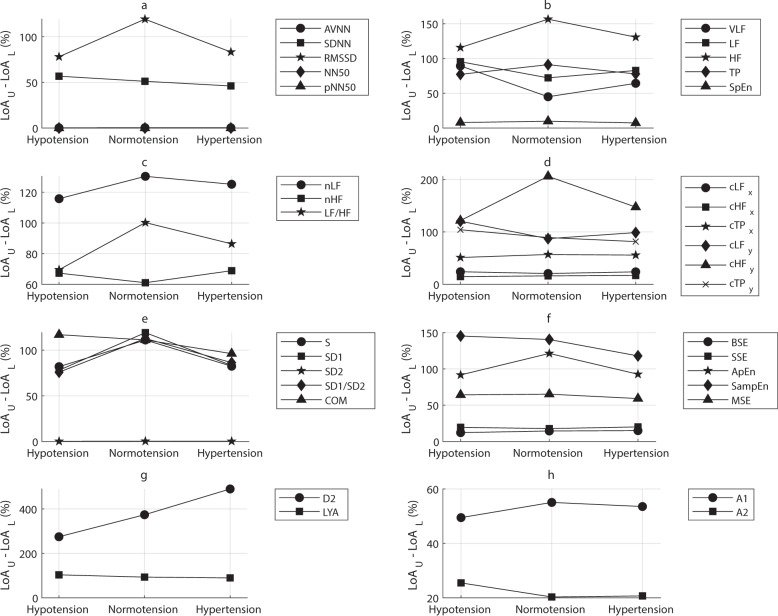
Heart rate variability (HRV) utilizes the electrocardiogram (ECG) and has been widely studied as a non-invasive indicator of cardiac autonomic activity. Pulse rate variability (PRV) utilizes photoplethysmography (PPG) and recently has been used as a surrogate for HRV. Several studies have found that PRV is not entirely valid as an estimation of HRV and that several physiological factors, including the pulse transit time (PTT) and blood pressure (BP) changes, may affect PRV differently than HRV. This study aimed to assess the relationship between PRV and HRV under different BP states: hypotension, normotension, and hypertension. Using the MIMIC III database, 5 min segments of PPG and ECG signals were used to extract PRV and HRV, respectively. Several time-domain, frequency-domain, and nonlinear indices were obtained from these signals. Bland-Altman analysis, correlation analysis, and Friedman rank sum tests were used to compare HRV and PRV in each state, and PRV and HRV indices were compared among BP states using Kruskal-Wallis tests. The findings indicated that there were differences between PRV and HRV, especially in short-term and nonlinear indices, and although PRV and HRV were altered in a similar manner when there was a change in BP, PRV seemed to be more sensitive to these changes.


Conflict of interest statement

The authors declare that the research was conducted in the absence of any commercial or financial relationships that could be construed as a potential conflict of interest. The manuscript presented here is entirely original, it has not been copyrighted, published, submitted, or accepted for publication elsewhere.

Figures

Fig. 1
Fig. 1. Linear relationship between pulse rate variability and heart rate variability.
Spearman correlation coefficients (ρ) were measured between a time-domain indices, b absolute and entropy indices from the frequency domain, c relative indices from the frequency domain, d centroid-related indices from the frequency domain, e Poincaré plot indices, f entropy-related indices, g phase-related indices, and h indices resulting from the detrended fluctuation analysis. All indices were obtained from pulse rate variability and heart rate variability in each blood pressure state (hypotension, normotension, and hypertension).
Fig. 2
Fig. 2. Bias measured from the Bland–Altman analysis comparing indices extracted from pulse rate variability and heart rate variability.
The bias was obtained between measured indices when comparing pulse rate variability and heart rate variability in each blood pressure state (hypotension, normotension, and hypertension) using the Bland–Altman analysis. Indices analysed were a time-domain indices, b absolute and entropy indices from the frequency domain, c relative indices from the frequency domain, d centroid-related indices from the frequency domain, e Poincaré plot indices, f entropy-related indices, g phase-related indices, and h indices resulting from the detrended fluctuation analysis.
Fig. 3
Fig. 3. Differences between upper (LoAU) and lower (LoAL) limits of agreement obtained from Bland–Altman analysis comparing indices measured from pulse rate variability and heart rate variability.
The limits of agreement were obtained from the Bland–Altman analysis performed with the extracted indices in each blood pressure state (hypotension, normotension, and hypertension). Indices analysed were a time-domain indices, b absolute and entropy indices from the frequency domain, c relative indices from the frequency domain, d centroid-related indices from the frequency domain, e Poincaré plot indices, f entropy-related indices, g phase-related indices, and h indices resulting from the detrended fluctuation analysis.
Fig. 4
Fig. 4. Signal quality assessment algorithm.
This algorithm was applied for discarding low-quality arterial blood pressure signals.
Fig. 5
Fig. 5. Arterial blood pressure signal analysis.
Example of the analysis of a 5-min arterial blood pressure (ABP, gray line) signal, with the trends for systolic (SBP, continuous line) and diastolic (DBP, dotted line) blood pressure, as well as the determination of blood pressure state (BP state, dashed line). Hypo hypotension, Normo normotension, Hyper hypertension.
Fig. 6
Fig. 6. Electrocardiography and photoplethymography analysis for the extraction of heart rate variability and pulse rate variability, respectively.
Example of a an electrocardiography (ECG) and b a photoplethysmography (PPG) signal. R peaks (black circles on the ECG signal) were detected from ECG signals to measure heart rate variability (HRV) as the time interval between consecutive R peaks (RR intervals). Onsets (black circles on the PPG signal) were detected from PPG signals to measure pulse rate variability (PRV) as the time interval between consecutive onsets (PP intervals).

Similar articles

Cited by

References

    1. Mejia-Mejia E, May JM, Torres R, Kyriacou PA. Pulse rate variability in cardiovascular health: a review on its applications and relationship with heart rate variability. Physiol. Meas. 2020;41:07TR01. doi: 10.1088/1361-6579/ab998c. - DOI - PubMed
    1. Shaffer F, Ginsberg JP. An overview of heart rate variability metrics and norms. Front. Public Health. 2017;5:258. doi: 10.3389/fpubh.2017.00258. - DOI - PMC - PubMed
    1. Clifford, G. D., Azuaje, F. & McSharry, P. E. (eds) Advanced Methods and Tools for ECG Data Analysis (Artech House, 2006).
    1. Huikuri HV, et al. Measurement of heart rate variability: a clinical tool or a research toy? J. Am. Coll. Cardiol. 1999;34:1878–1883. doi: 10.1016/S0735-1097(99)00468-4. - DOI - PubMed
    1. Xhyheri B, Manfrini O, Mazzolini M, Pizzi C, Bugiardini R. Heart rate variability today. Prog. Cardiovasc. Dis. 2012;55:321–331. doi: 10.1016/j.pcad.2012.09.001. - DOI - PubMed

LinkOut - more resources