. 2021 Jun;40(23):3974-3988.
doi: 10.1038/s41388-021-01815-4. Epub 2021 May 14.

The loss of SHMT2 mediates 5-fluorouracil chemoresistance in colorectal cancer by upregulating autophagy

Affiliations

The loss of SHMT2 mediates 5-fluorouracil chemoresistance in colorectal cancer by upregulating autophagy

Jian Chen et al. Oncogene. 2021 Jun.

Abstract

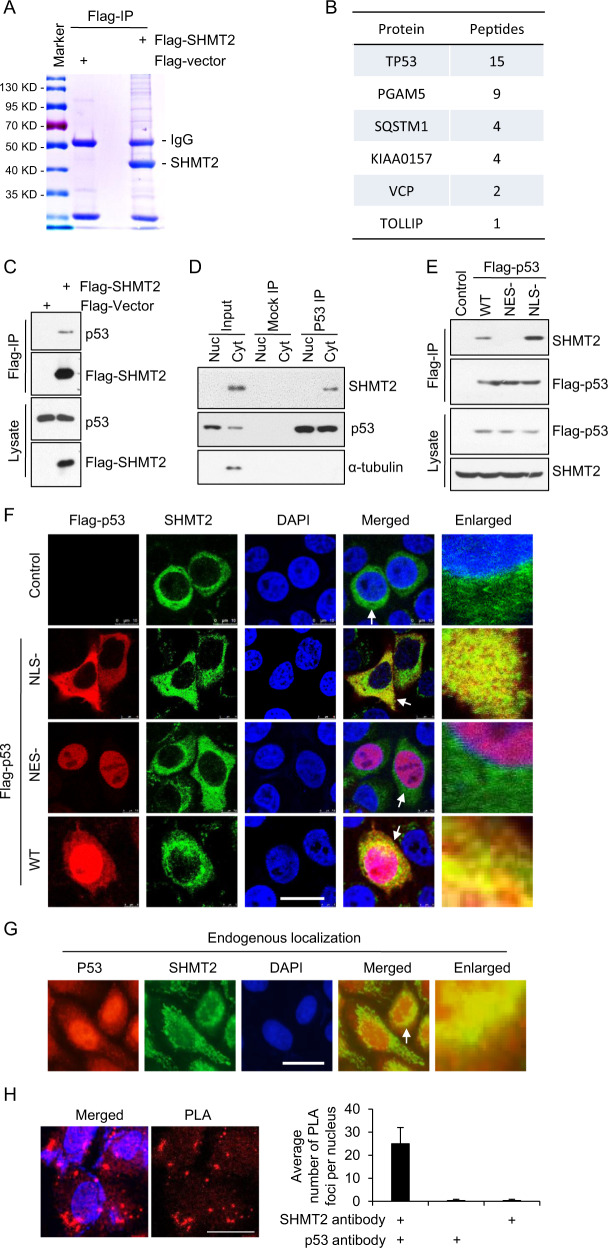
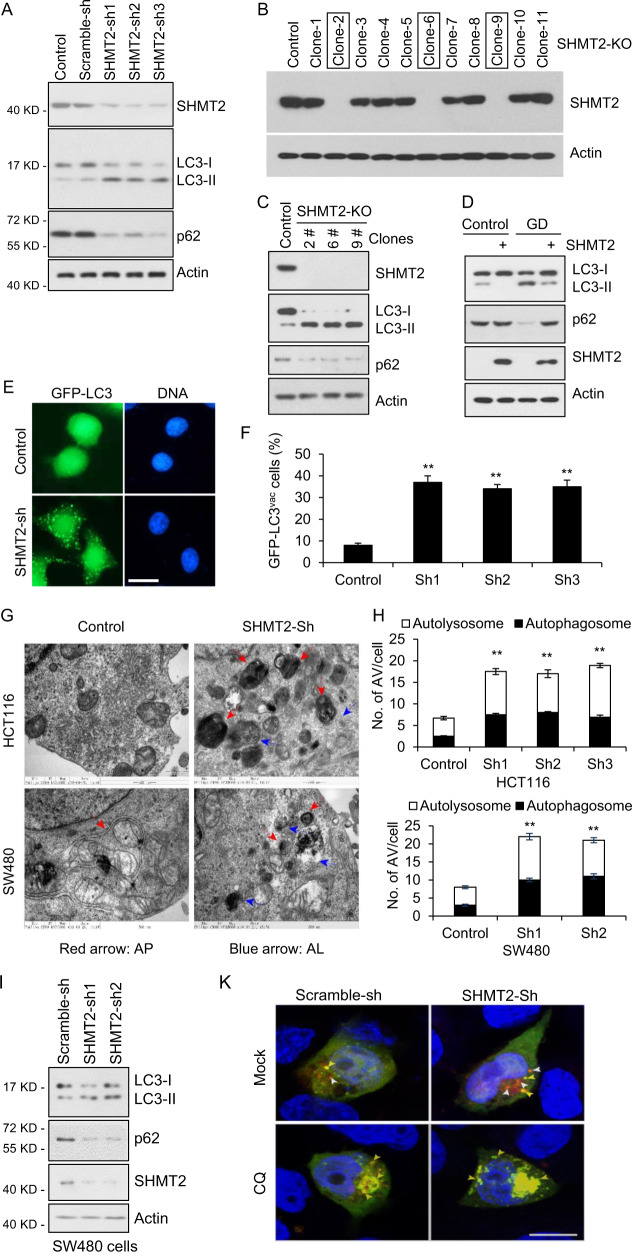
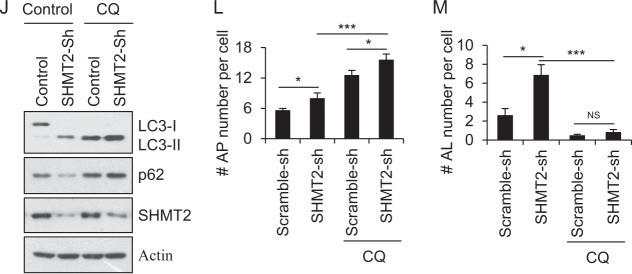
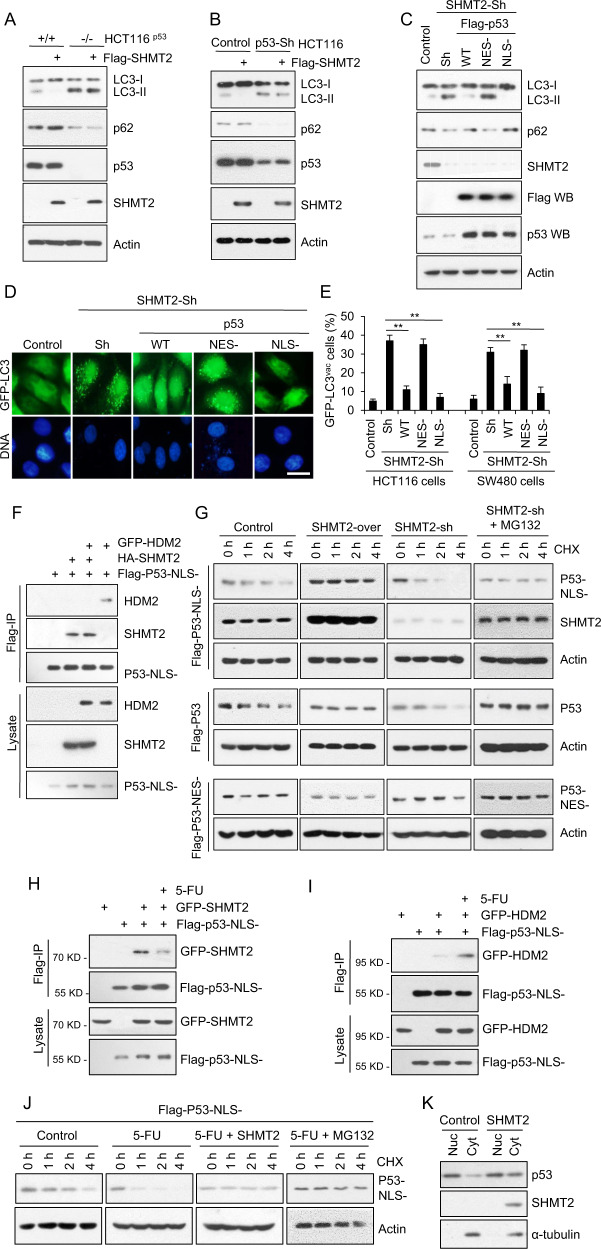
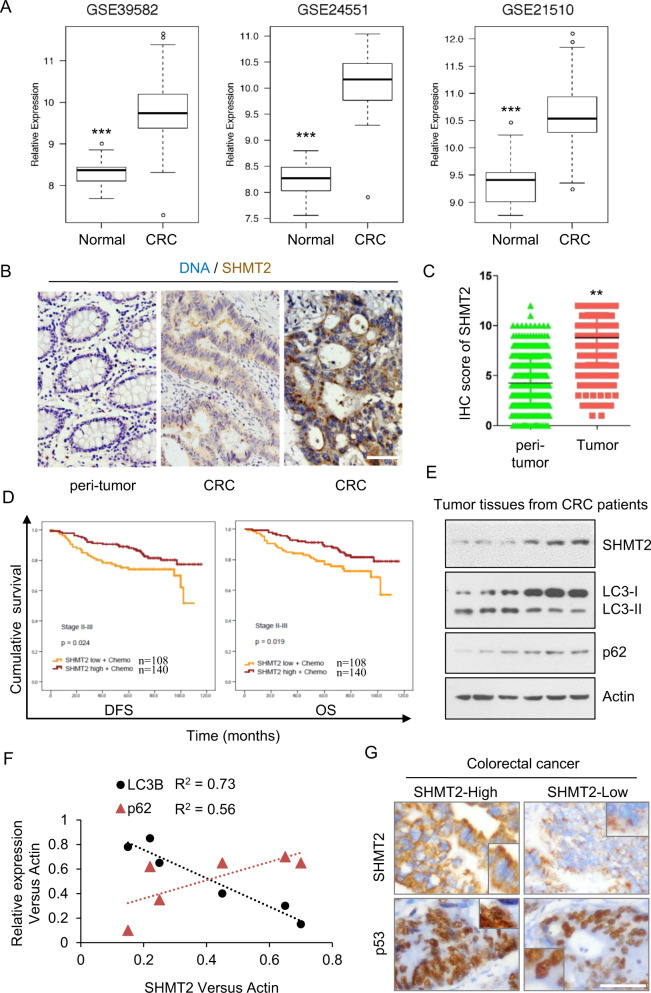
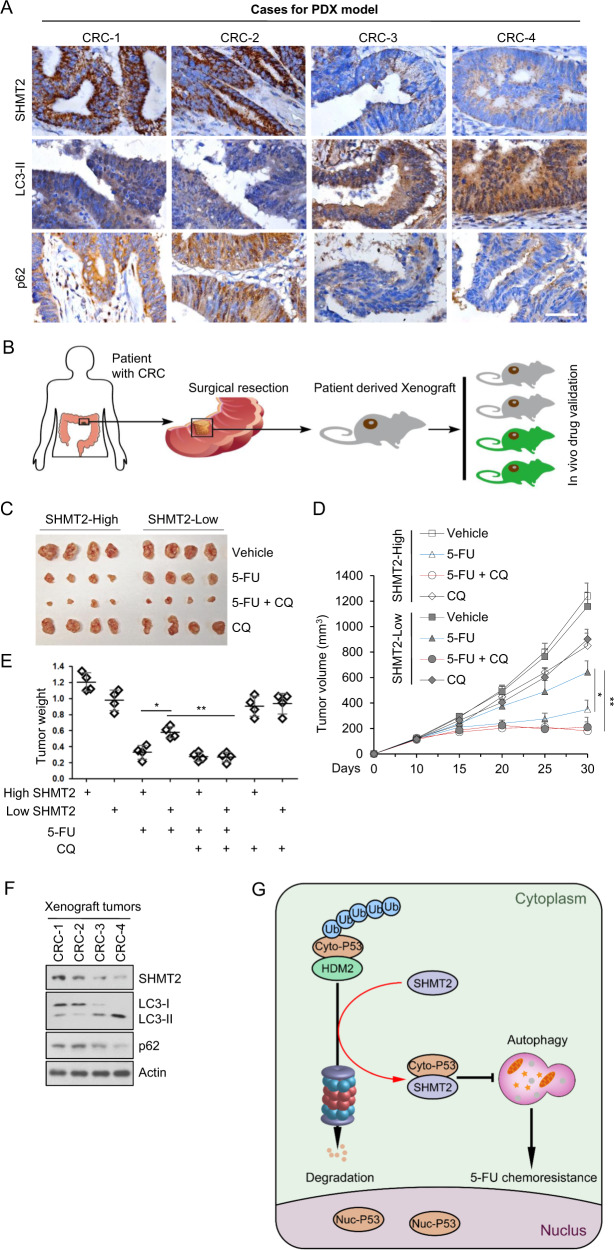
5-Fluorouracil (5-FU)-based chemotherapy is the first-line treatment for colorectal cancer (CRC) but is hampered by chemoresistance. Despite its impact on patient survival, the mechanism underlying chemoresistance against 5-FU remains poorly understood. Here, we identified serine hydroxymethyltransferase-2 (SHMT2) as a critical regulator of 5-FU chemoresistance in CRC. SHMT2 inhibits autophagy by binding cytosolic p53 instead of metabolism. SHMT2 prevents cytosolic p53 degradation by inhibiting the binding of p53 and HDM2. Under 5-FU treatment, SHMT2 depletion promotes autophagy and inhibits apoptosis. Autophagy inhibitors decrease low SHMT2-induced 5-FU resistance in vitro and in vivo. Finally, the lethality of 5-FU treatment to CRC cells was enhanced by treatment with the autophagy inhibitor chloroquine in patient-derived and CRC cell xenograft models. Taken together, our findings indicate that autophagy induced by low SHMT2 levels mediates 5-FU resistance in CRC. These results reveal the SHMT2-p53 interaction as a novel therapeutic target and provide a potential opportunity to reduce chemoresistance.


Conflict of interest statement

The authors declare no competing interests.

Figures

Fig. 1
Fig. 1. SHMT2 interacts with cytosolic p53.
A, B SHMT2 purified by Flag-IP was collected after in-gel digestion and used for LC-MS/MS analysis to search for the binding proteins of SHMT2. A Flag-SHMT2 was transfected into 293 T cells for 24 h, isolated by coimmunoprecipitation, separated by SDS-PAGE and stained using Coomassie. B Tabular display of the number of tryptic peptides from each of the indicated proteins that coprecipitated with SHMT2. C HCT116 cells transfected with Flag-SHMT2 were immunoprecipitated with FLAG-M2 beads. Western blotting for p53 and SHMT2 was then performed. Immunoprecipitation using an anti-p53 antibody (Do-1) was followed by western blotting with anti-SHMT2 or anti-p53 antibodies (ab32389, Abcam). D SHMT2 interacted mainly with endogenous cytosolic p53 in HCT116 cells. Cyt cytosolic, Nuc nuclear. E Cytosolic p53 bound to SHMT2. HCT116 cells transfected with Flag-WT, nuclear (NES-) or cytosolic p53 (NLS-) were immunoprecipitated with FLAG-M2 beads. Western blotting for FLAG and SHMT2 was then performed. FH Colocalization of SHMT2 and cytosolic p53. A set of partially enlarged pictures are attached on the right side. F Representative micrographs of HCT116 cells transfected with plasmids expressing WT, nuclear (NES-) and cytosolic p53 (NLS-). G Representative micrographs of HCT116 cells stained for SHMT2 and p53. H Representative micrographs of HCT116 cells in the proximity ligation assay (PLA). Scale bar, 10 μm. PLA foci per nucleus for the two antibodies are presented in the histogram.
Fig. 2
Fig. 2. Depletion of SHMT2 induces autophagy.
A The effect of SHMT2 on autophagy. To establish stable cell lines, HCT116 cells were infected with Scramble-sh (Control) or SHMT2 knockdown (SHMT2-sh-1, -sh-2, or -sh-3) lentivirus for 72 h and selected with puromycin (1 mg/ml). The protein levels of endogenous SHMT2, p62, LC3, and β-actin (as the internal standard) were examined by western blotting. B Identification of SHMT2-KO monoclonal HCT116 cell lines. C The protein levels of endogenous SHMT2, p62, LC3, and β-actin were evaluated in control and SHMT2-KO HCT116 cells. D The effect of SHMT2 on autophagy under glucose deprivation (GD) was assessed. E GFP-LC3 puncta were induced in SHMT2 knockdown cells. Control and SHMT2-sh stable HCT116 cell lines were transfected with the GFP-LC3 plasmid and cultured in complete medium for 24 h. Scale bar, 10 μm. F The percentage of cells exhibiting accumulation of GFP-LC3 in puncta (GFP-LC3vac) is shown (mean ± s.d., n = 3; **P < 0.01). G Ultrastructural evidence of autophagic vacuolization induced by SHMT2 depletion. H The numbers of autophagosomes (APs) and autolysosomes (ALs) were determined in at least 50 cells in three independent experiments (mean ± s.d.; **P < 0.01). I Effect of SHMT2 on LC3 maturation in SW480 cells. To establish stable cell lines, SW480 cells were infected with Scramble-sh (Control) or SHMT2 knockdown (SHMT2-sh-1 or -sh-2) lentivirus for 72 h and selected with puromycin (1 mg/ml). The protein levels of endogenous SHMT2, p62, LC3, and β-actin (as the internal standard) were examined by western blotting. J Autophagy levels were increased in SHMT2-sh cells and prevented by the autophagy inhibitor chloroquine (CQ). KM Representative images and quantification of HCT116 cells expressing mCherry-GFP-LC3B and the indicated shRNA. APs and ALs were identified as yellow and red puncta, respectively. The numbers of puncta are shown as the mean ± s.e.m. values. Statistical significance was determined by Poisson regression. ns nonsignificant, *P < 0.05, ***P < 0.001.
Fig. 3
Fig. 3. SHMT2 depletion induces autophagy via degradation of cytosolic p53 in response to 5-FU treatment.
AC Effect of SHMT2 and p53 on LC3 maturation. The protein levels of SHMT2, p53, p62, LC3, and β-actin (as the internal standard) were assessed by western blotting using anti-Flag and anti-p53, anti-p62, anti-LC3, and anti-β-actin antibodies, respectively. A HCT116p53+/+ cells and HCT116p53-/- cells were transfected with Flag-SHMT2 for 24 h. B HCT116 cells were infected with Scramble-sh (Control) or p53 knockdown (Sh) lentivirus for 72 h and transfected with Flag-SHMT2 for 24 h. C Stable control and SHMT2-sh cells were transfected with Flag-WT, nuclear (NES-) and cytosolic p53 (NLS-) plasmids for 24 h. The protein levels of p53, SHMT2, p62, LC3, and β-actin were assessed by western blotting using anti-Flag and anti-p53, anti-SHMT2, anti-p62, anti-LC3, and anti-β-actin antibodies, respectively. D GFP-LC3 puncta formation induced by SHMT2-sh or p53 mutants. Control and SHMT2-sh stable HCT116 cell lines were transfected with Flag-WT p53, nuclear (NES-) p53, cytosolic p53 (NLS-), or GFP-LC3 plasmids and cultured in complete medium for 24 h. Scale bar, 10 μm. E The percentage of HCT116 and SW480 cells exhibiting accumulation of GFP-LC3 in puncta (GFP-LC3vac) is shown (mean ± s.d., n = 3; **P < 0.01). Puncta were quantified from 100 cells. F SHMT2 disrupted the binding of cytosolic p53 to HDM2. HCT116 cells transfected with GFP-HDM2, HA-SHMT2, and Flag-cytosolic p53 (NLS-) plasmids were immunoprecipitated with FLAG-M2 beads. Western blotting for p53, GFP, and HA was then performed. G SHMT2 maintained the stability of cytosolic p53. Western blot analysis of lysates of cells with stable SHMT2 overexpression and knockdown that were transfected with Flag-WT, nuclear (NES-), and cytosolic p53 (NLS-) plasmids and treated with the translation inhibitors cycloheximide (CHX, 50 μg/ml) and MG132 (25 μM, 4 h) for the indicated durations. H, I HCT116 cells transfected with Flag-cytosolic p53 (NLS-), GFP-SHMT2 or GFP-HDM2 were immunoprecipitated with FLAG-M2 beads. Western blotting for p53 and GFP was then performed. H 5-FU disrupted the binding of cytosolic p53 to SHMT2. I 5-FU promoted the binding of cytosolic p53 to HDM2. J Western blot analysis of lysates of HCT116 cells transfected with Flag-cytosolic p53 (NLS-) or SHMT2 plasmids and treated with CHX and MG132 for the indicated durations with or without 5-FU. K Nuclear-cytosolic separation shows that SHMT2 affects the stability of endogenous cytosolic p53. Cyt cytosolic, Nuc nuclear.
Fig. 4
Fig. 4. Inhibition of autophagy induced by low SHMT2 expression sensitizes CRC cells to 5-FU treatment.
A SHMT2 promoted apoptosis and inhibited autophagy in response to 5-FU treatment. Western blot analysis of lysates of HCT116 cells that were transfected with SHMT2 or infected with SHMT2-sh lentivirus and treated with 5-FU (10 μM) for 24 h. The protein levels of SHMT2, p62, LC3, cleaved Caspase 3, PARP, and β-actin (as the internal standard) were assessed with the indicated antibodies. B The protein levels of SHMT2, p62, LC3, cleaved Caspase 3, PARP, and β-actin (as the internal standard) were assessed in SHMT2-KO HCT116 cells. C The indicated cells were treated with 5-FU (2 μM), 3-MA (10 mM) or chloroquine diphosphate salt (CQ, 20 μM) for 4 days and analyzed using the MTT cell viability assay. *P < 0.05, **P < 0.01. DF The xenograft experiment with Control and SHMT2-sh cells treated with 5-FU or CQ is described in the Methods section. D Xenograft tumors were harvested and photographed. E, F Quantification of the average volumes (E) and weights (F) of the xenograft tumors are shown. Five tumors from individual mice were included in each group; *P < 0.05, **P < 0.01.
Fig. 5
Fig. 5. 5-FU resistance is related to low SHMT2 expression and autophagy in CRC.
A Expression of SHMT2 in three GEO datasets (GSE39582, GSE24551, and GSE21510). ***P < 0.001. B Representative images of immunohistochemical staining for SHMT2 in peritumor and CRC tissues. Scale bar, 50 μm. C 378 stage II–III paired CRC tissues assessed by immunohistochemistry are shown. **P < 0.01. D Survival of patients stratified by the SHMT2 expression level. DFS and OS of patients with stage II–III disease treated with 5-FU-based chemotherapy stratified by the SHMT2 expression level. E, F The protein levels of endogenous SHMT2, p62, LC3, and β-actin (as the internal standard) were examined by western blotting in CRC tissues. F The Spearman rank correlation test was used to evaluate correlations between the SHMT2, p62, and LC3 expression status in CRC tissues as determined by western blotting. G Representative images of immunohistochemical staining. Scale bar, 50 μm.
Fig. 6
Fig. 6. CQ sensitizes PDXs with low SHMT2 expression to 5-FU treatment.
A Images of immunohistochemical staining for SHMT2, LC3, and p62 in CRC tissues from four selected patients (two with low SHMT2 expression and two with high SHMT2 expression) using the indicated antibodies. Scale bar, 50 μm. B Schematic of PDX model establishment. CE Xenograft experiments with 5-FU or CQ treatment are described in the Methods section. C Xenograft tumors were harvested and photographed. D, E Quantification of the average volumes (D) and weights (E) of the xenograft tumors are shown. Four tumors from individual mice were included in each group; *P < 0.05, **P < 0.01. F Representative western blot of xenograft tumors. G Schematic diagram showing the basic hypothesis/conclusion/model.

Similar articles

Cited by

References

    1. Siegel RL, Miller KD, Goding Sauer A, Fedewa SA, Butterly LF, Anderson JC, et al. Colorectal cancer statistics, 2020. CA Cancer J Clin. 2020;70:145–64. - PubMed
    1. Ribic CM, Sargent DJ, Moore MJ, Thibodeau SN, French AJ, Goldberg RM, et al. Tumor microsatellite-instability status as a predictor of benefit from fluorouracil-based adjuvant chemotherapy for colon cancer. N. Engl J Med. 2003;349:247–57. - PMC - PubMed
    1. Gustavsson B, Carlsson G, Machover D, Petrelli N, Roth A, Schmoll HJ, et al. A review of the evolution of systemic chemotherapy in the management of colorectal cancer. Clin Colorectal Cancer. 2015;14:1–10. - PubMed
    1. Saha S, Panigrahi DP, Patil S, Bhutia SK. Autophagy in health and disease: a comprehensive review. Biomed Pharmacother. 2018;104:485–95. - PubMed
    1. Klionsky DJ, Abdelmohsen K, Abe A, Abedin MJ, Abeliovich H, Acevedo Arozena A, et al. Guidelines for the use and interpretation of assays for monitoring autophagy (3rd edition) Autophagy. 2016;12:1–222. - PMC - PubMed

Publication types

MeSH terms