. 2023 Mar;28(3):1027-1045.
doi: 10.1038/s41380-021-01137-7. Epub 2021 May 14.

The laterodorsal tegmentum-ventral tegmental area circuit controls depression-like behaviors by activating ErbB4 in DA neurons

Affiliations

The laterodorsal tegmentum-ventral tegmental area circuit controls depression-like behaviors by activating ErbB4 in DA neurons

Hongsheng Wang et al. Mol Psychiatry. 2023 Mar.

Abstract

Dopamine (DA) neurons in the ventral tegmental area (VTA) are critical to coping with stress. However, molecular mechanisms regulating their activity and stress-induced depression were not well understood. We found that the receptor tyrosine kinase ErbB4 in VTA was activated in stress-susceptible mice. Deleting ErbB4 in VTA or in DA neurons, or chemical genetic inhibition of ErbB4 kinase activity in VTA suppressed the development of chronic social defeat stress (CSDS)-induced depression-like behaviors. ErbB4 activation required the expression of NRG1 in the laterodorsal tegmentum (LDTg); LDTg-specific deletion of NRG1 inhibited depression-like behaviors. NRG1 and ErbB4 suppressed potassium currents of VTA DA neurons and increased their firing activity. Finally, we showed that acute inhibition of ErbB4 after stress attenuated DA neuron hyperactivity and expression of depression-like behaviors. Together, these observations demonstrate a critical role of NRG1-ErbB4 signaling in regulating depression-like behaviors and identify an unexpected mechanism by which the LDTg-VTA circuit regulates the activity of DA neurons.


Conflict of interest statement

The authors declare no competing interests.

Figures

Fig. 1
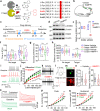
Fig. 1. Requirement of ErbB4 in VTA DA neurons for the development of depression-like behaviors.
a Procedure of chronic social defeat stress (CSDS), with CD1 breeders as aggressors. b Diagram of social avoidance test. c Diagram showing micro-dissection of VTA. Dissection was performed in oxygenated cutting solutions under a stereo microscope; oval or round shape of gray color indicating the regions of interest in brain slices, which were punched and pooled. d, e Increased pErbB4 in VTA of CSDS-susceptible mice. Sus susceptible, Res resilient. d Representative western blots. e Quantitative data. Data were expressed as box-and-whisker plots, error bars indicated the min and max data points, center lines indicated the median, plus symbols indicated the mean, circles were values for all individual samples. For pErbB4: One-way ANOVA, F(2, 15) = 8.326, **P = 0.0037, Tukey’s multiple comparisons test, **P(Naive vs. Sus) = 0.0049, P(Naive vs. Res) = 0.85018, *P(Sus vs. Res) = 0.0146; n = 9 mice per group. f, g Negative correlation between VTA pErbB4 level and social interaction time f and sucrose preference value g; IZ time spent in social interaction zone; correlation between pErbB4 and IZ, **P = 0.0011; correlation between pErbB4 and sucrose preference value, *P = 0.0120; n = 9 for naive, Sus, and Res group, respectively. h–j Conditional knockout (CKO) of ErbB4 in DA neurons. h DAT-Cre (Cre) mice crossed with the ErB4f/f (B4f/f) mice to generate the DAT-Cre;B4f/f (CKO) mice; i Western blot showing reduced ErbB4 protein in VTA in CKO mice; j quantitative data of i, Data were expressed as box-and-whisker plots. Unpaired Student’s t test, t8 = 8.704, ***P < 0.001; n = 5 mice per group. k Attenuation of CSDS-induced social avoidance in CKO mice. Notice that mice heterozygous in DAT-Cre gene were used. IZ, time spent in interaction zone. Data were expressed as box-and-whisker plots. Unpaired Student’s t test; Target vs. No Target in Naive-Cre mice, t42 = 5.232, $P < 0.0001; Target vs. No Target in Naive-CKO mice, t42 = 6.69, $P < 0.0001; With presence of Target: t(42)(Naive-Cre vs. CSDS-Cre) = 6.764, ***P < 0.0001; t(42) (Naive-CKO vs. CSDS-CKO) = 4.356, # # #P < 0.0001; t(42)(CSDS-Cre vs. CSDS-CKO) = 2.762, **P = 0.0085; n = 22 mice per group. n.s. no statistical difference. l Attenuation of CSDS-induced reduction of sucrose preference in CKO mice. Data were expressed as box-and-whisker plots. Unpaired Student’s t test, t(42)(Naive-Cre vs. CSDS-Cre) = 4.094 ***P = 0.0002; t(42)(CSDS-Cre vs. CSDS-CKO) = 2.378, *P = 0.0221; n = 22 mice per group. mr VTA-specific deletion of ErbB4 by expressing AAV-Cre (vCre) in VTA of B4f/f mice. m Anatomic diagram showing injection of vCre or AAV-GFP (vGFP) into bilateral VTAs. n Representative image showing expression of vCre at VTA, scale bar, 250 µm. o Enlargement of rectangle area in n, scale bar, 50 µm. p Quantification of DA neurons (TH+) that express vCre. q Representative western blots for dissected VTA showing decreased ErbB4 protein in vCre-injected B4f/f mice (B4f/f;vCre), compared with vGFP-injected mice (B4f/f;vGFP). r Quantification of q. Data were expressed as box-and-whisker plots. Unpaired Student’s t test, t14 = 12.89, ***P < 0.001; n = 8 mice per group. s Time scheme for behavioral studies. t Attenuation of CSDS-induced social avoidance in B4f/f;vCre mice. IZ, time spent in interaction zone. Data were expressed as box-and-whisker plots. Unpaired Student’s t test; Target vs. No Target in Naive;B4f/f;vGFP mice, t38 = 6.363, $P < 0.0001, Target vs. No Target in Naive;B4f/f;vCre mice, t38 = 5.755, $P < 0.0001. With presence of Target: t(38)(Naive;B4f/f;vGFP vs. CSDS;B4f/f;vGFP) = 6.598, ***P < 0.0001; t(38)(Naive-B4f/f;vCre vs. CSDS;B4f/f;vCre) = 2.592, #P = 0.0135; t(38)(CSDS;B4f/f;vGFP vs. CSDS;B4f/f;vCre) = 2.43, *P = 0.0199. n = 20 mice per group. u No alteration in locomotion of B4f/f;vCre mice. v Attenuation in CSDS-induced reduction of sucrose preference in B4f/f;vCre mice. Data were expressed as box-and-whisker plots. Unpaired Student’s t test, t(38)(Naive;B4f/f;vGFP vs. CSDS;B4f/f;vGFP) = 3.965, ***P = 0.0003; t(38)(CSDS;B4f/f;vGFP vs. CSDS;B4f/f;vCre) = 2.491, *P = 0.0172. n = 20 mice per group. (Also see Supplementary Fig. S1 for the segregation of susceptible and resilient mice; Supplementary Fig. S2 for the verification of DAT-Cre mice; Supplementary Fig. S3 for the unaltered expression TH in VTA; Supplementary Fig. S4 for the tracking images of social avoidance; Supplementary Fig. S5 for the unaltered locomotion of CKO mice; Supplementary Fig. S6 for the AAV expression at VTA.).
Fig. 2
Fig. 2. Attenuated development of depression-like behaviors after consecutive chemical genetic inhibition of ErbB4 kinase activity in VTA.
a Generation of the T796G mice by mutating the threonine 796 to glycine; the mutation causes the enlargement of the ATP-binding pocket which could be accessed by the bulk competitive inhibitor, 1NMPP1. b Diagram showing continuous infusion of 1NMPP1 or Vehicle into VTA via an implanted osmotic pump. c Time scheme for the experiments. d, e Inhibition of pErbB4 by consecutive injection of 1NMPP1 into VTA. d Representative western blots showing reduced pErbB4 in VTA of 1NMPP1-treated mice; e Quantitative data of d; Data were expressed as box-and-whisker plots. Unpaired Student’s t test; for pErbB4, t8 = 5.533, ***P = 0.0006; n = 5 mice per group. f Attenuation of CSDS-induced social avoidance in 1NMPP1-treated mice. IZ time spent in interaction zone. Data were expressed as box-and-whisker plots. Unpaired Student’s t test; Target vs. No Target in Vehicle mice, t38 = 4.519, $P < 0.0001; Target vs. No Target in 1NMPP1 mice, t38 = 6.382, $P < 0.0001; With presence of Target: t(38)(Naive-Vehicle vs. CSDS-Vehicle) = 5.331, ***P < 0.0001; t(38)(Naive-1NMPP1 vs. CSDS-1NMPP1) = 3.086, # #P = 0.0038; t(38)(CSDS-Vehicle vs. CSDS-1NMPP1) = 2.417, *P = 0.0206; n = 20 mice per group. g Attenuated development of CSDS-induced reduction in sucrose preference in 1NMPP1-treated mice. Data were expressed as box-and-whisker plots. Unpaired Student’s t test, t(38)(Naive-Vehicle vs. CSDS-Vehicle) = 5.331, ***P < 0.0001; t(38)(Naive-1NMPP1 vs. CSDS-1NMPP1) = 3.086, # #P = 0.0038; t(38)(CSDS-Vehicle vs. CSDS-1NMPP1) = 2.417, *P = 0.0206; n = 20 mice per group. h No alteration in locomotion after 1NMPP1 treatment. iq Reduced firing of VTA DA neurons by inhibition of ErbB4 activity, via enhancing K+ currents. ij Recording in VTA slices from DAT-Cre;Ai9;T796G mice showing decreased current injection-induced spikes in DA neurons by incubation with 1NMPP1. i Representative current injection-induced spikes. j Quantification of i. Data were expressed as mean ± SEM. Two-way ANOVA, Baseline vs. 1NMPP1, F(interaction)(8, 304) = 2.03, *P = 0.0427; Sidak’s multiple comparisons test, *P(75 pA) = 0.0220, **P(100 pA) = 0.0074, ***P(125 pA) = 0.0005, ***P(150 pA) < 0.0001, ***P(175 pA) < 0.0001, ***P(200 pA) < 0.0001; 1NMPP1 vs. Wash, F(interaction)(8, 304) = 1.374, P = 0.2070; F(main effect of 1NMPP1)(1,38) = 65.22, # # #P < 0.0001; Sidak’s multiple comparisons test, #P(150pA) = 0.0327, #P(175 pA) = 0.0242, # # #P(200pA) = 0.0009; n = 20 cells from 8 mice. kn In vivo recordings performed in T796G mice showing decreased firing rate (FR) and percentage of spikes in bursts (SB) after 1NMPP1 injection into VTA. k Representative firing traces of VTA DA neurons shortly (20 min) after injection of Vehicle or 1NMPP1 into VTA. Arrowheads indicated some of the spikes that fired in bursts. l Representative APs of DA neurons. Arrowheads and Arabic numerals indicated the three phases. m Representative immunostaining images showing recorded neuron double positive of biocytin and TH. Scale bar, 20 µm. n Quantitative data in m, data were expressed as box-and-whisker plots. Unpaired Student’s t test: t(FR)(68) = 2.558 *P = 0.0128; t(SB)(68) = 2.532, *P = 0.0137; n = 34 (Vehicle) or 36 (1NMPP1) cells from 13 mice. oq In vitro recording in VTA slices from T796G mice showing enhancement of total K+ currents by 1NMPP1. o Representative traces of total K+ currents in DA neurons after 1NMPP1 incubation. p–q Quantitative data in o showing enhancement of both the peak and sustained phases by 1NMPP1. Data were expressed as mean ± SEM. Two-way ANOVA. For peak phase: Baseline vs. 1NMPP1, F(interaction)(9, 414) = 3.099, **P = 0.0013, Sidak’s multiple comparisons test, ***P(90 mV) < 0.0001, ***P(80 mV) = 0.0001, **P(70 mV) = 0.0042, *P(60 mV) = 0.0377; 1NMPP1 vs. Wash, F(interaction)(9, 414) = 2.099, #P = 0.0285, Sidak’s multiple comparisons test, # # #P(90 mV) = 0.0001, #P(80 mV) = 0.0115. For sustained phase: Baseline vs. 1NMPP1, F(interaction)(9, 414) = 2.723, **P = 0.0043, Sidak’s multiple comparisons test, ***P(90 mV) < 0.0001, ***P(80 mV) = 0.0007, **P(70 mV) = 0.0064; 1NMPP1 vs. Wash, F(interaction)(9, 414) = 1.779, P = 0.0704; F(main effect of 1NMPP1)(1, 46) = 23.37, # # #P < 0.0001, Sidak’s multiple comparisons test, # #P(90 mV) = 0.0025, #P(80 mV) = 0.0131. n = 24 cells of 10 mice for each group. (Also see Supplementary Fig. S7 for the verification of positions of cannulae; Supplementary Fig. S10 for inhibition of BDNF release at NAc by 1NMPP1 injected into VTA of CSDS-exposed mice.).
Fig. 3
Fig. 3. Increased expression of NRG1 in LDTg after CSDS and its requirement for the development of depression-like behaviors.
a, b Increased NRG1 protein, but not mRNA, in VTA of CSDS-susceptible mice. a Representative western blots for dissected VTA; b Quantitative data of NRG1 protein and mRNA in VTA. Sus susceptible, Res resilient. Data were expressed as box-and-whisker plots. For western blot, one-way ANOVA, F(2, 12) = 6.785, **P = 0.0041; Sidak’s multiple comparisons test, **P(Naive vs. Sus) = 0.0065, *P(Res vs. Sus) = 0.0249; n = 10 (Naive), 9 (Res), or 11 (Sus) mice. c Diagram showing brain regions that send excitatory afferents to VTA DA neurons and are involved in social defeat-induced behavioral changes. mPFC medial prefrontal cortex, VP ventral pallidum, AMY amygdala, DRN dorsal raphe nucleus, VTA ventral tegmental area, LDTg laterodorsal tegmentum. d Increased NRG1 mRNA in LDTg and DRN, not mPFC, VP, or AMY in Sus mice. Data were expressed as box-and-whisker plots. One-way ANOVA. For LDTg, F(2, 27) = 8.185, **P = 0.0017; Tukey’s multiple comparisons test, **P(Naive vs. Sus) = 0.0028, **P(Res vs. Sus) = 0.0076. For DRN, F(2, 27) = 5.125, *P = 0.0130; Tukey’s multiple comparisons test, *P(Naive vs. Sus) = 0.0302, *P(Res vs. Sus) = 0.0227. n = 10 mice per group. ej Deletion of NRG1 gene in LDTg reduced NRG1 protein in VTA in CSDS-exposed mice. eg vCre injection into LDTg and DRN of NRG1f/f mice reduced local NRG1 mRNA. e, f vCre expression in LDTg and DRN; Left panels anatomic diagrams, right panels representative images of vCre expression, 2Cb 2nd cerebellar lobule, Aq aqueduct, Pa4 paratrochlear nucleus, mlf medial longitudinal fasciculus, xscp decussation of the superior cerebellar peduncle. Scale bars, 500 µm. g Reduced mRNA in LDTg and DRN detected by qRT-PCR. Data were expressed as box-and-whisker plots. Unpaired Student’s t test: t(6)(LDTg) = 4.112, **P = 0.0063; t(6)(DRN) = 5.056, **P = 0.0023; n = 4 mice per group. hj Reduced NRG1 protein in VTA after injecting vCre into LDTg, but not DRN. Mice after indicated paradigms were analyzed. h Representative western blots for dissected VTA; i, j Quantitative data in h. Data were expressed as box-and-whisker plots. Unpaired Student’s t test; for LDTg, t(14)(Naive-vGFP vs. CSDS-vGFP) = 2.688, *P = 0.0177; t(14)(Naive-vCre vs. CSDS-vCre) = 1.352, P = 0.1979, n = 8 mice per group; for DRN, t(14)(Naive-vGFP vs. CSDS-vGFP) = 2.725, *P = 0.0164;, t(14)(Naive-vCre vs. CSDS-vCre) = 3.046, **P = 0.0087, n = 8 mice per group. km Reduced pErbB4 in VTA after vCre injection into LDTg, but not DRN. Mice after indicated paradigms were analyzed. k Representative western blots for dissected VTA; l, m Quantitative data in k. Data were expressed as box-and-whisker plots. Unpaired Student’s t test; for LDTg, t(14)(Naive-vGFP vs. CSDS-vGFP) = 2.554, *P = 0.0230; t(14)(Naive-vCre vs. CSDS-vCre) = 1.18, P = 0.2577, n = 8 mice per group; for DRN, t(14)(Naive-vGFP vs. CSDS-vGFP) = 2.629, *P = 0.0198; t(14)(Naive-vCre vs. CSDS-vCre) = 2.845, *P = 0.0130, n = 8 mice per group. ny Requirement of NRG1 in LDTg for the development of depression-like behaviors. nq Deletion of NRG1 in LDTg attenuated the development of social avoidance and reduction in sucrose preference. n Anatomical diagram showing injection of vCre or vGFP into LDTg of NRG1f/f mice. o Attenuation of CSDS-induced social avoidance in NRG1f/f;vCre mice. Data were expressed as box-and-whisker plots. Unpaired Student’s t test, t(34)(Naive-vGFP vs. CSDS-vGFP) = 5.371, ***P < 0.0001; t(34)(Naive-vCre vs. CSDS-vCre) = 3.409, # #P = 0.0017; t(34)(CSDS-vGFP vs. CSDS-vCre) = 2.718, *P = 0.0103; n = 18 mice per group. p Attenuated development of CSDS-induced reduction of sucrose preference in NRG1f/f;vCre mice. Data were expressed as box-and-whisker plots. Unpaired Student’s t test; t(34)(Naive-vGFP vs. CSDS-vGFP) = 3.08, **P = 0.0041; t(34)(CSDS-vGFP vs. CSDS-vCre) = 2.2, *P = 0.0347; n = 18 mice per group. q No change in locomotion in NRG1f/f;vCre mice. rt Injection of AAV-NRG1-GFP (vNRG1) into LDTg increased local expression of NRG1. r Anatomic diagram showing injection of vNRG1 or vGFP into LDTg of WT mice; s Representative image showing expression of vNRG1 at LDTg. Aq aqueduct, 2Cb 2nd cerebellar lobule. Scale bar, 1 mm. t Increased NRG1 mRNA detected by qRT-PCR. Data were expressed as box-and-whisker plots. Unpaired Student’s t test, t6 = 4.865, **P = 0.0028. n = 4 mice per group. uy Enhanced development of depression-like behaviors by overexpressing NRG1 in LDTg after exposure to subSD. u Diagram showing the procedure of subSD. v No alteration in time spent in social target-absent IZ. w Reduction in time spent in social target-present IZ after subSD in vNRG1-injected mice. Data were expressed as box-and-whisker plots. Unpaired Student’s t test; t(34)(Naive-vGFP vs. subSD-vGFP) = 1.686, P = 0.1009; t(34)(Naive-vNRG1 vs. subSD-vNRG1) = 4.088, # # #P = 0.0003; t(34)(subSD-vGFP vs. subSD-vNRG1) = 3.237, **P = 0.0027; n = 18 mice per group. x Reduction in sucrose preference after subSD in vNRG1-injected mice. Data were expressed as box-and-whisker plots. Unpaired Student’s t test, t(34)(Naive-vGFP vs. subSD-vGFP) = 1.565, P = 0.1269; t(34)(Naive-vNRG1 vs. subSD-vNRG1) = 3.553, # #P = 0.0011; t(34)(subSD-vGFP vs. subSD-vNRG1) = 2.591, *P = 0.0140; n = 18 mice per group. y No changes in locomotion in vNRG1-injected mice. (Also see Supplementary Fig. S11 for AAV expression at DRN and LDTg; Supplementary Fig. S12 for the unaltered expression of total ErbB4 in VTA; Supplementary Fig. S12 for increased NRG1 in VTA after subSD in vNRG1-injected mice.).
Fig. 4
Fig. 4. VTA DA neuron firing increased by NRG1, via suppressing K+ currents.
ac In vitro recording performed in VTA slices from ErbB4-CreER;Ai9 mice showing increased VTA DA neuron firing after incubation with NRG1. a Representative images showing recorded neurons triple positive for ErbB4 (positive of tdTomato, referred to as tdT+), TH, and biocytin. Left, VTA slices with anatomic regions. SNc substantia nigra pars compacta, SNr substantia nigra pars reticulata, ml medial lemniscus, fr fasciculus retroflexus. Right, enlargement of the rectangle area in the left image. Arrowheads indicated the tdT, TH, and biocytin triple positive neurons. Scale bars, 200 μm in the left, 50 μm in the right. To avoid overexposure of fluorescent signal, low dose of tamoxifen was used to induced a small number of tdT+ cells. b Representative current injection-induced spikes. c Quantitative data in b. Data were expressed as mean ± SEM. Two-way ANOVA. Baseline vs. NRG1: F(interaction)(8, 288) = 2.081, *P = 0.0376; Sidak’s multiple comparisons test, *P(50 pA) = 0.0416, **P(100 pA) = 0.0085, **P(125 pA) = 0.0020, **P(150 pA) = 0.0012, ***P(175 pA) = 0.0008, ***P(200 pA) = 0.0003; NRG1 vs. Wash, F(interaction)(8, 288) = 1.0198, P = 0.3001; F(main effect of NRG1)(1,36) = 63.9, # # #P < 0.0001; Sidak’s multiple comparisons test, #P(125 pA) = 0.0206, #P(150 pA) = 0.0228, #P(175 pA) = 0.0279, #P(200 pA) = 0.0185; n = 19 cells from 8 mice. dg In vivo recordings performed in WT mice showing increased firing rate (FR) and percentage of spikes in bursts (SB) after NRG1 injection into VTA. d Representative firing traces of VTA DA neurons shortly (20 min) after injection of Vehicle, or NRG1 into VTA. Arrowheads indicated some of the spikes that fired in bursts. e Representative APs of DA neurons. Arrowheads and Arabic numerals indicated the three phases. f Representative immunostaining image showing recorded neuron double positive of biocytin and TH. Scale bar, 20 µm. g Quantitative data in d, data were expressed as box-and-whisker plots. Unpaired Student’s t test: t(FR)(70) = 2.584, *P = 0.0119; t(SB)(70) = 2.861, **P = 0.0056; n = 36 cells from 12 (Vehicle) or 13 (NRG1) mice. hj In vitro recordings performed in VTA slices from ErbB4-CreER;Ai9 mice showing inhibition of total K+ currents by NRG1. h Representative traces of total K+ currents in VTA DA neurons after NRG1 incubation. i, j Quantitative data showing inhibition of both the peak and sustained phases by NRG1. Data were expressed as mean ± SEM. Two-way ANOAVA. For the peak phase: Baseline vs. NRG1, F(interaction)(9, 414) = 3.403, ***P = 0.0005; Sidak’s multiple comparisons test, ***P(90 mV) < 0.0001, ***P(80 mV) = 0.0002, **P(70 mV) = 0.0021; NRG1 vs. Wash, F(interaction)(9, 414) = 1.851, P = 0.0577, F(main effect of NRG1)(1, 46) = 17.97, # # #P = 0.0001, Sidak’s multiple comparisons test, # #P(90 mV) = 0.0022, #P(80 mV) = 0.0260. For sustained phase: Baseline vs. NRG1, F(interaction)(9, 414) = 2.402, *P = 0.0116; Sidak’s multiple comparisons test, ***P(90 mV) = 0.0003, **P(80 mV) = 0.0012, **P(70 mV) = 0.0074; *P(60 mV) = 0.0431; NRG1 vs. Wash, F(interaction)(9, 414) = 1.449, P = 0.1649, F(main effect of NRG1)(1, 46) = 23.37, # # #P < 0.0001, Sidak’s multiple comparisons test, #P(70 mV) = 0.0417. n = 24 cells of 10 mice for each group. km pERK increased by NRG1, but decreased by NMP, injected into VTA. k Diagram showing acute injection of Veh, NRG1 or NMP into VTA. l Representative western blots for dissected VTA. m Quantification of l. Data were expressed as box-and-whisker plots. Unpaired Student’s t test, t(Veh vs. NRG1)(10) = 3.962, **P = 0.0027; t(Veh vs. 1NMPP1)(10) = 6.696, ***P < 0.001. nq ERK inhibitor, PD98059 (referred to as PD), reduced the effects of NRG1 on DA neuron firing and K+ currents. n Representative traces of current injection-induced spikes in DA neurons after incubation with Veh+NRG1 or PD + NRG1. o Quantification of n showing reduced spikes in PD + NRG1-treated slices. Data were expressed as mean ± SEM. Two-way ANOVA, F(interaction)(8, 296) = 2.058, *P = 0.0398; Sidak’s multiple comparisons test, **P(100 pA) = 0.0087, **P(125 pA) = 0.0028, **P(150 pA) = 0.0054, **P(175 pA) = 0.0032, **P (200 pA) = 0.0063; n = 20 (Veh) or 19 (PD) cells from 8 mice. p Representative traces of total K+ currents after incubation with Veh+NRG1 or PD + NRG1. q Quantification of p showing increased K+ currents in PD + NRG1-treated slices. Data were expressed as mean ± SEM. Two-way ANOVA. For peak phase: F(interaction)(9, 396) = 2.292, *P = 0.0162; Sidak’s multiple comparisons test, ***P(90 mV) = 0.0002, **P(80 mV) = 0.0011, *P(70 mV) = 0.0154. For sustained phase: F(interaction)(9, 396) = 2.195, #P = 0.0216; Sidak’s multiple comparisons test, # # #P(90 mV) = 0.0003, # #P(80 mV) = 0.0022, #P(70 mV) = 0.0207; n = 22 cells of 8 mice for each group. (Also see Supplementary Fig. S13 for quantification of ErbB4-expressing DA neurons in VTA; Supplementary Fig. S10 for the increased BDNF release at NAc after injection of NRG1 into VTA in subSD-exposed mice.).
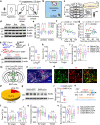
Fig. 5
Fig. 5. Attenuated expression of depression-like behaviors after acute injection of 1NMPP1 into VTA of CSDS-susceptible mice.
a Acute injection of NMP or Veh into VTA via implanted cannulae. b, c Acute inhibition of pErbB4 in VTA by single injection of NMP. b Representative western blots. c Quantitative data in b. Data were expressed as box-and-whisker plots. One-way ANOVA, F(6, 28) = 18.87, ***P < 0.0001, Sidak’s multiple comparisons test, ***P(Veh-30 min vs. NMP-30 min) < 0.0001; n = 5 mice for each time point. d Time scheme of behavioral studies. SI social interaction test, SP sucrose preference test, Sus susceptible. e Attenuation of CSDS-induced social avoidance by single administration of NMP into VTA. No difference was observed for time spent in social target-absent IZ. Data were expressed as box-and-whisker plots. At 30 min, unpaired Student’s t test, t38 = 3.488, **P = 0.0012. For comparison between different time points of NMP group, one-way ANOVA, F(2, 57) = 11.03, ***P < 0.0001, ***P(Pre vs. 30 min) = 0.0008. n = 20 mice per group. f No alteration by single injection of NMP in CSDS-induced reduction of sucrose preference (tested during two consecutive 24-h periods). g No alteration in locomotion. h, i Inhibition of DA neuron firing in VTA slices prepared from CSDS-susceptible mice by incubation with NMP. h Representative traces of current injection-induced spikes. i Quantification of h. Data were expressed as mean ± SEM. Two-way ANOVA, F(interaction)(8, 280) = 1.996, *P = 0.0470; Sidak’s multiple comparisons test, **P(100 pA) = 0.0068, **P(125 pA) = 0.0020, **P(150 pA) = 0.0040, *P(175 pA) = 0.0140, *P(200 pA) = 0.0191; n = 19 (Veh) or 18 (NMP) cells from 8 mice. (Also see Supplementary Fig. S15 for attenuation of depression-like behaviors by single administration of afatinib into VTA.).

Similar articles

Cited by

References

    1. Horvitz JC. Mesolimbocortical and nigrostriatal dopamine responses to salient non-reward events. Neuroscience. 2000;96:651–6. - PubMed
    1. Brischoux F, Chakraborty S, Brierley DI, Ungless MA. Phasic excitation of dopamine neurons in ventral VTA by noxious stimuli. Proc Natl Acad Sci USA. 2009;106:4894–9. - PMC - PubMed
    1. Holly EN, Miczek KA. Ventral tegmental area dopamine revisited: effects of acute and repeated stress. Psychopharmacology. 2016;233:163–86. - PMC - PubMed
    1. Tsai HC, Zhang F, Adamantidis A, Stuber GD, Bonci A, de Lecea L, et al. Phasic firing in dopaminergic neurons is sufficient for behavioral conditioning. Science. 2009;324:1080–4. - PMC - PubMed
    1. Chaudhury D, Walsh JJ, Friedman AK, Juarez B, Ku SM, Koo JW, et al. Rapid regulation of depression-related behaviours by control of midbrain dopamine neurons. Nature. 2013;493:532–6. - PMC - PubMed

Publication types