. 2021 May;27(5):882-891.
doi: 10.1038/s41591-021-01342-5. Epub 2021 May 14.

An ensemble of neural networks provides expert-level prenatal detection of complex congenital heart disease

Affiliations

An ensemble of neural networks provides expert-level prenatal detection of complex congenital heart disease

Rima Arnaout et al. Nat Med. 2021 May.

Abstract

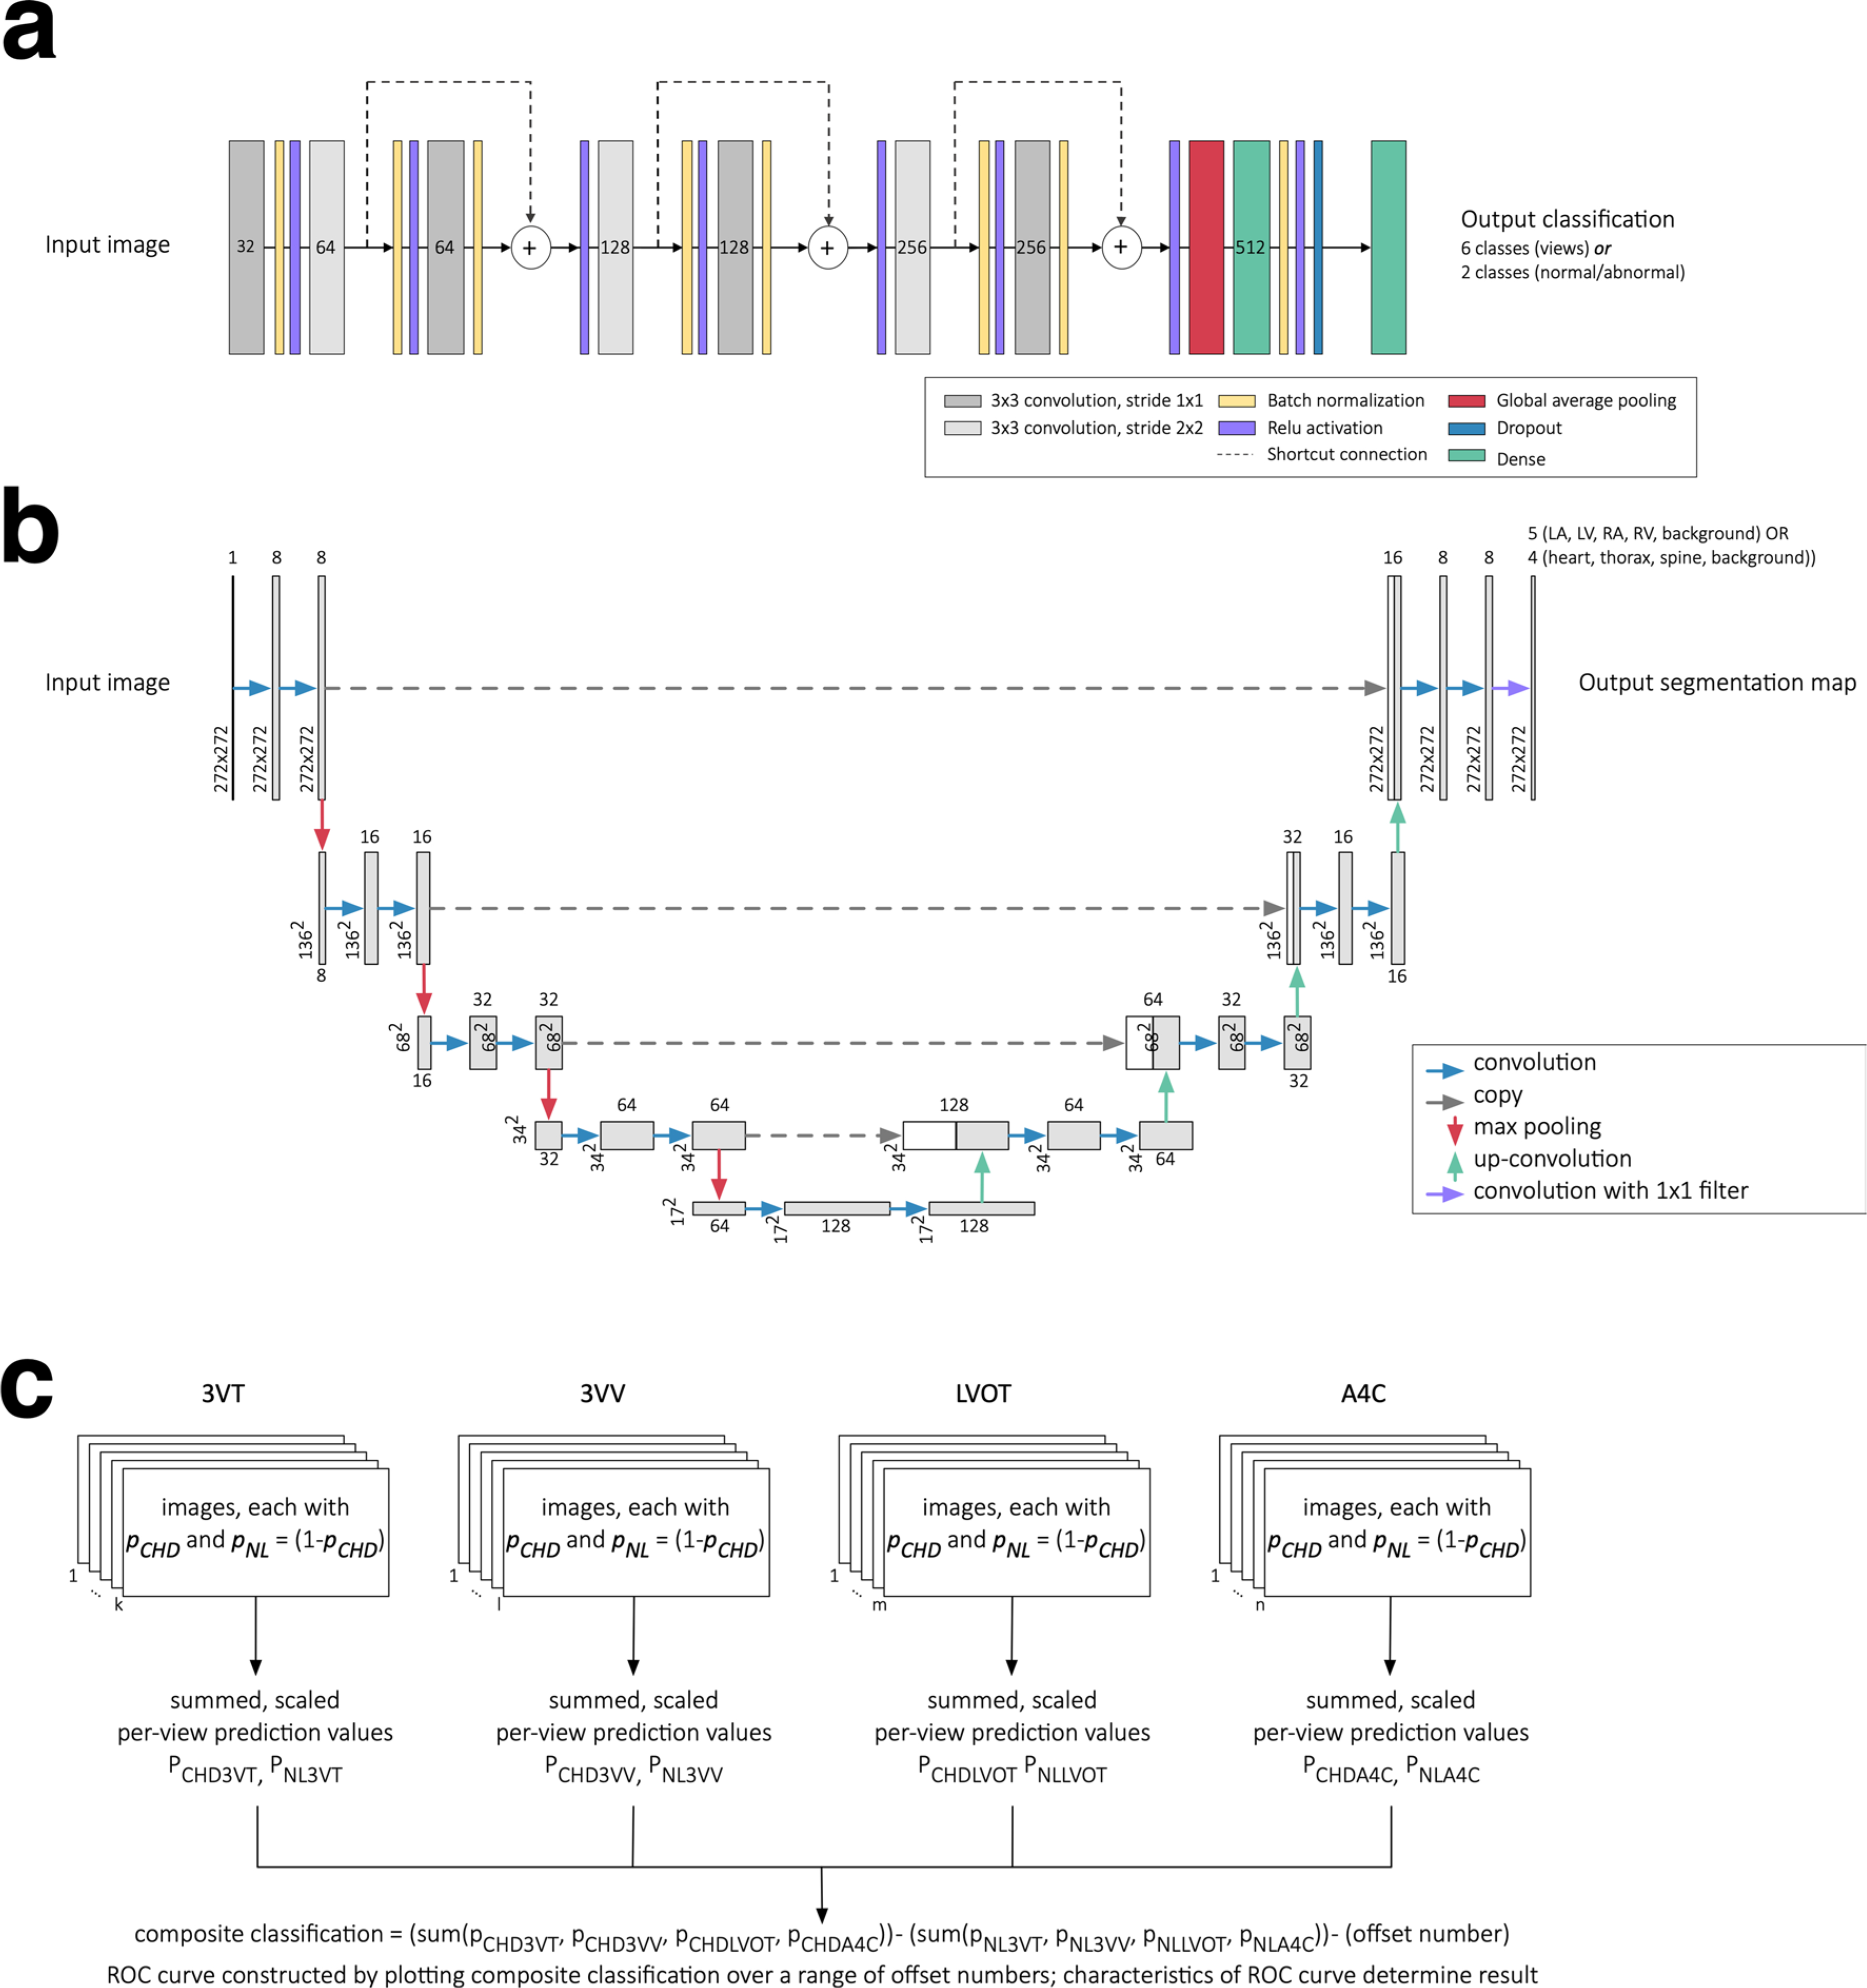
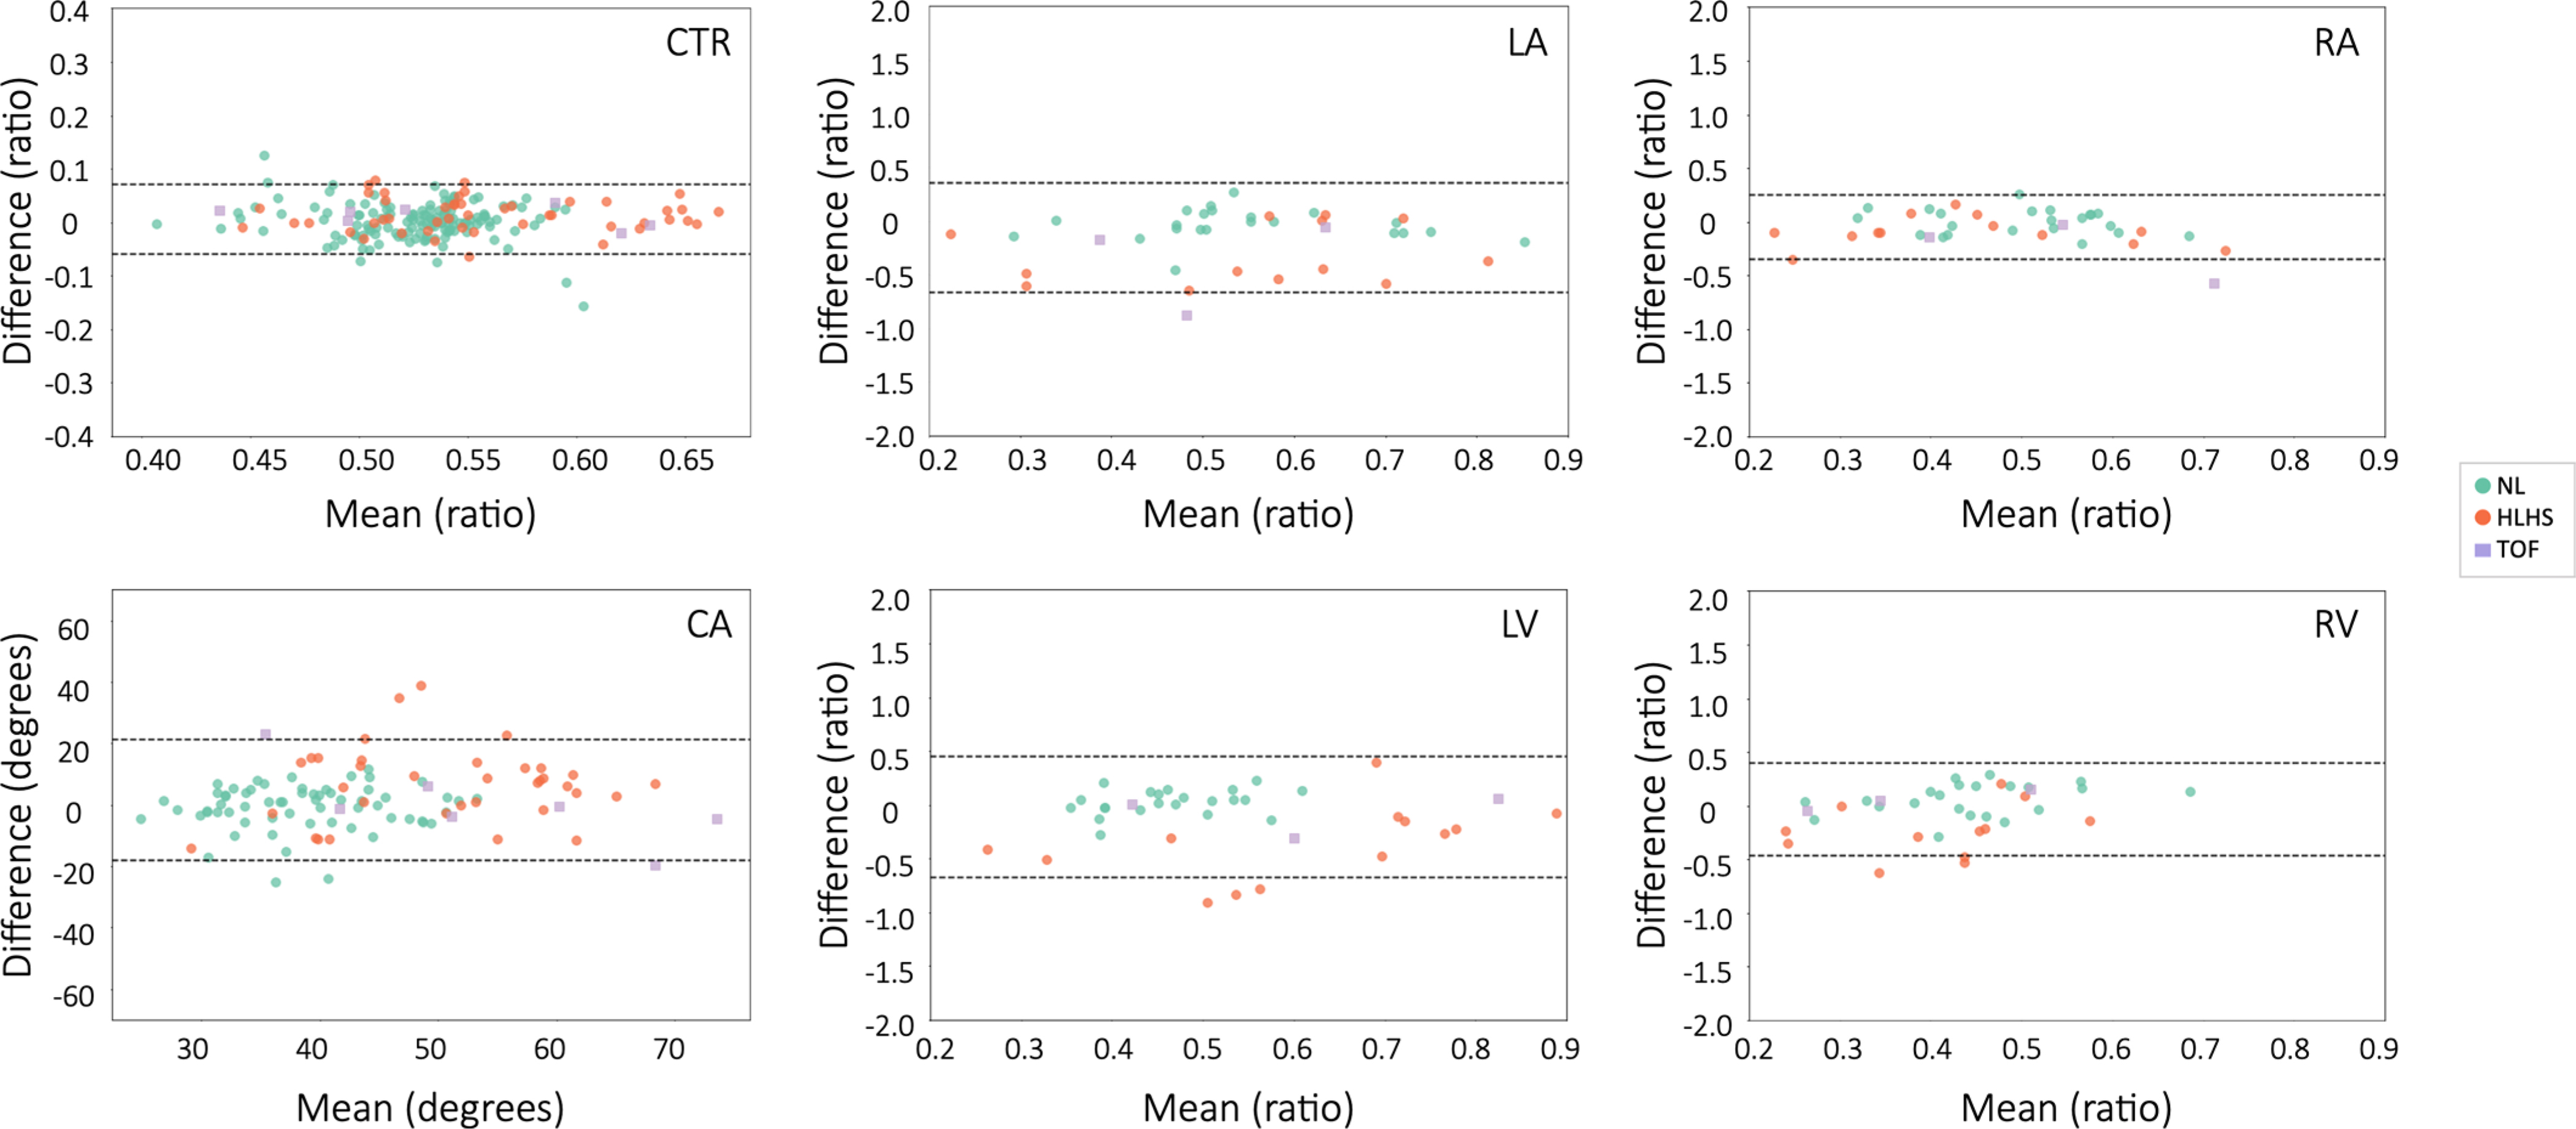
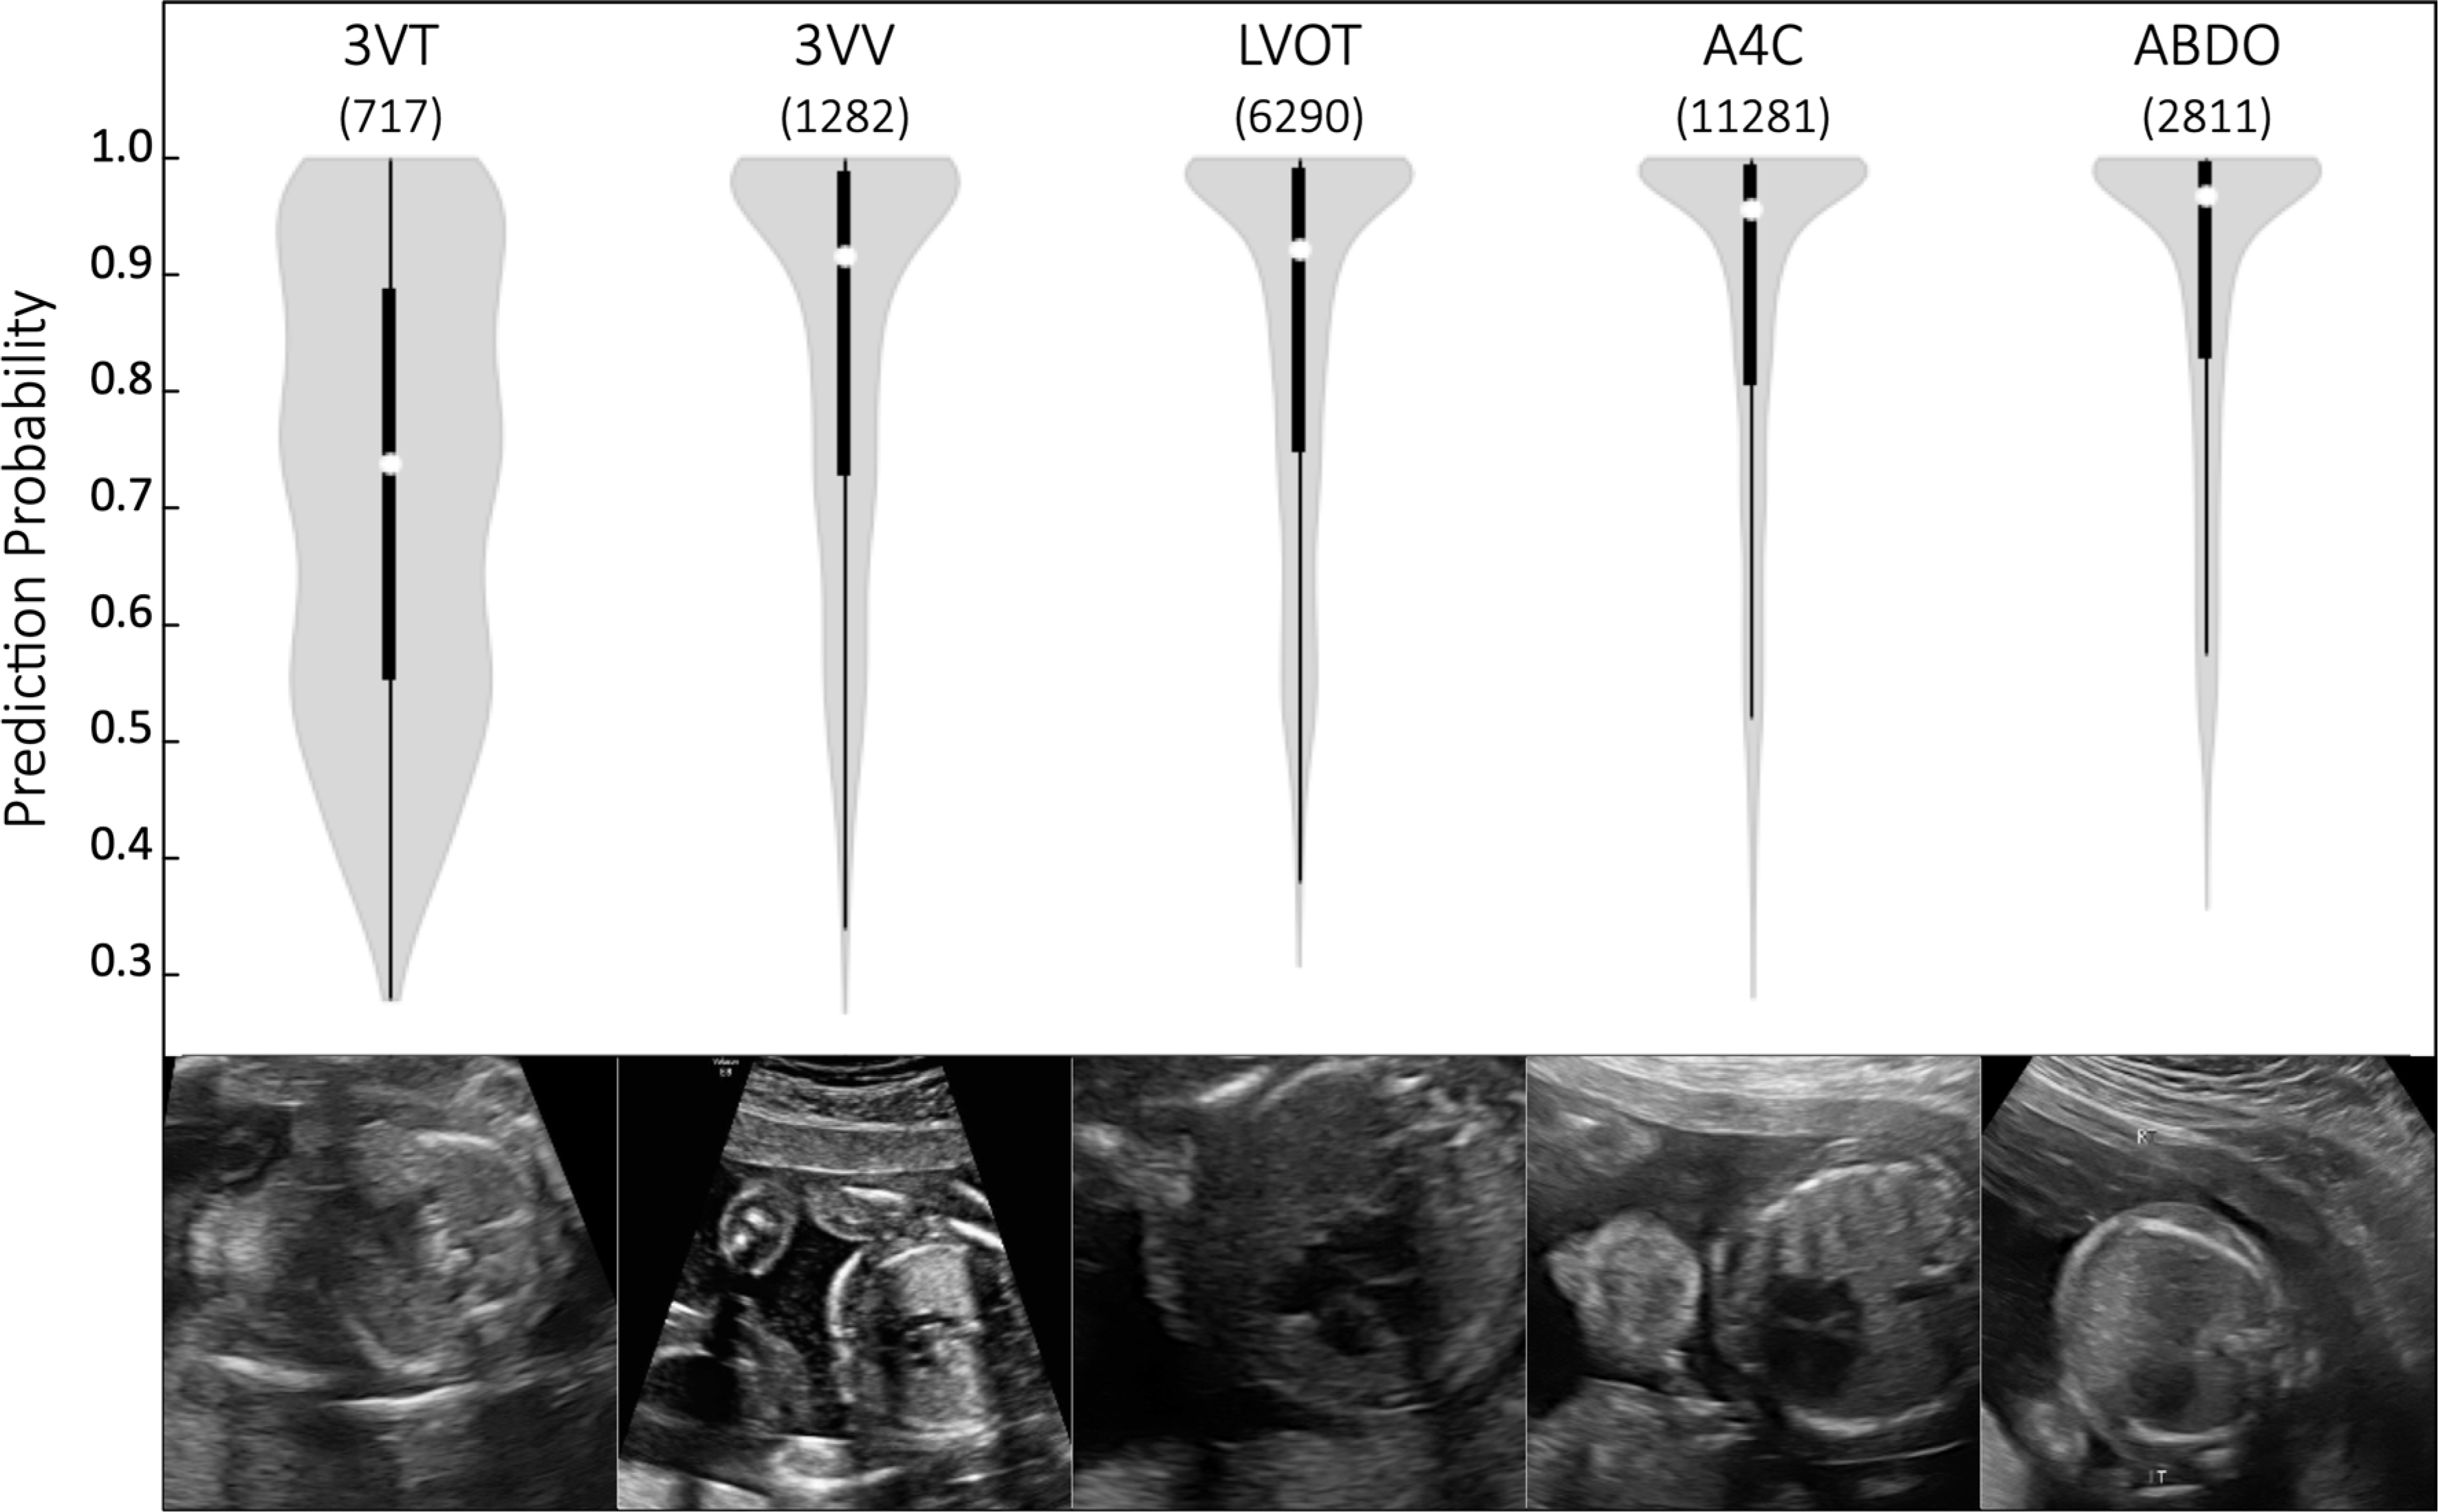
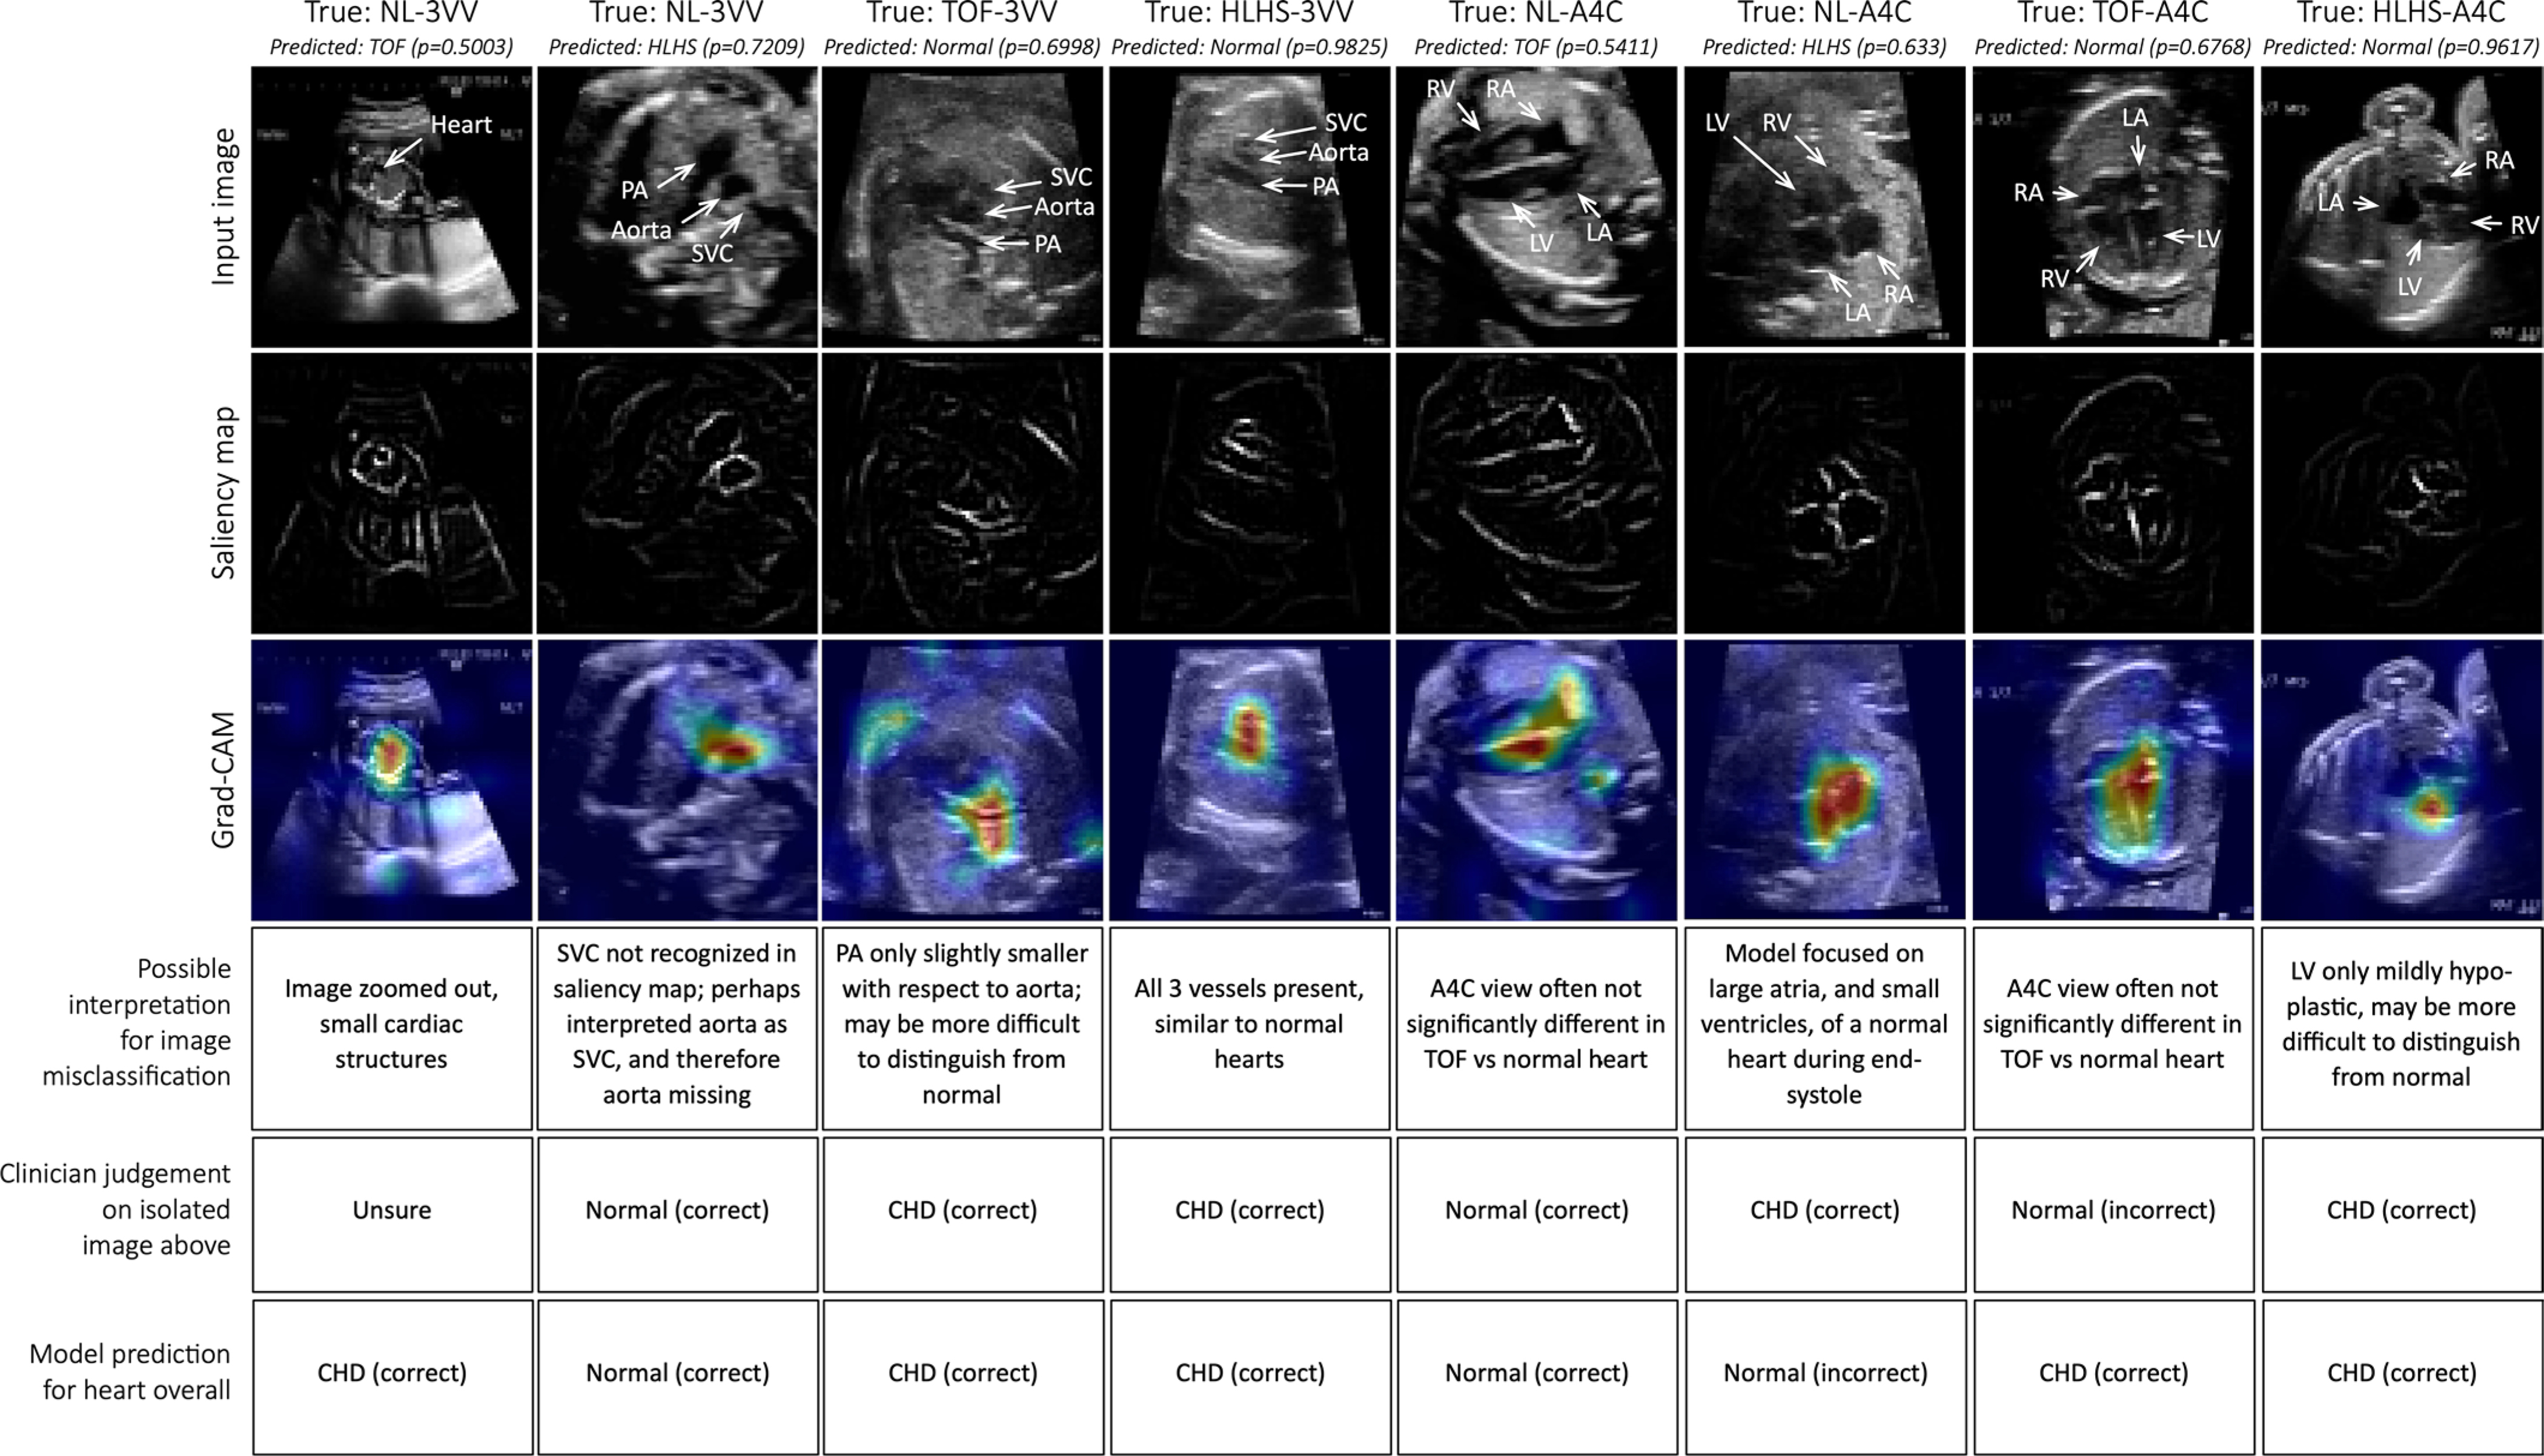
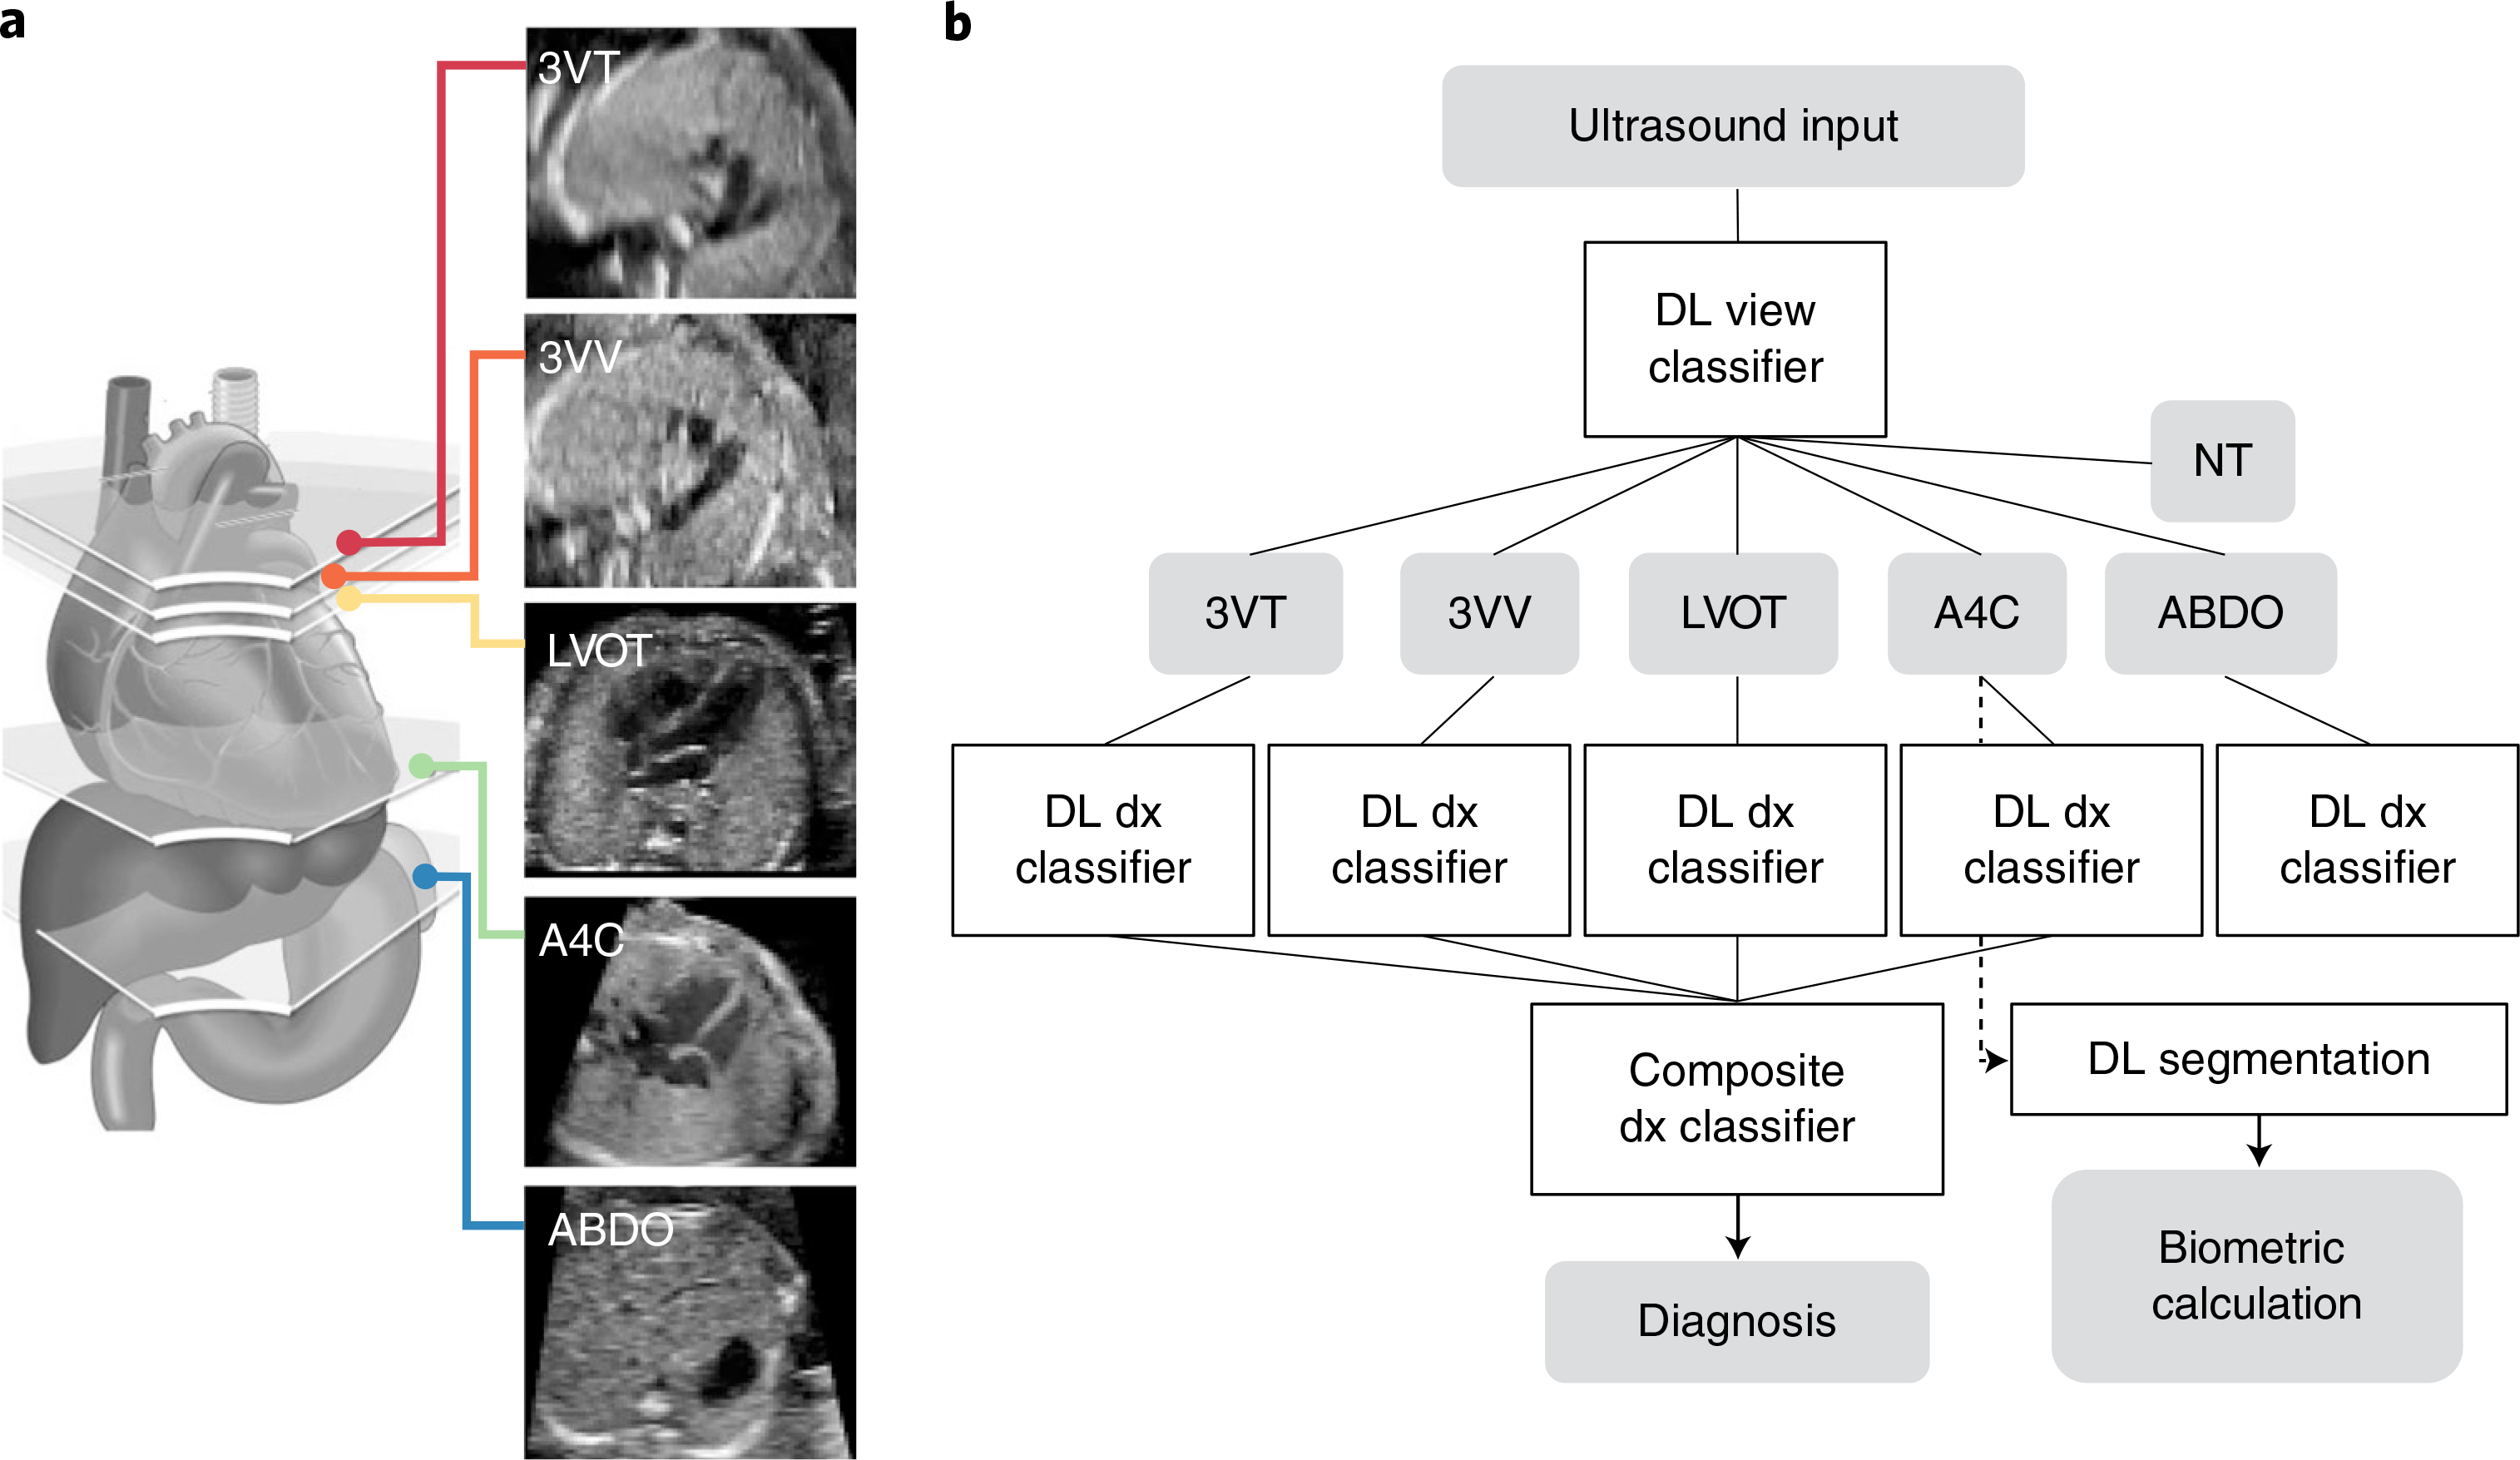
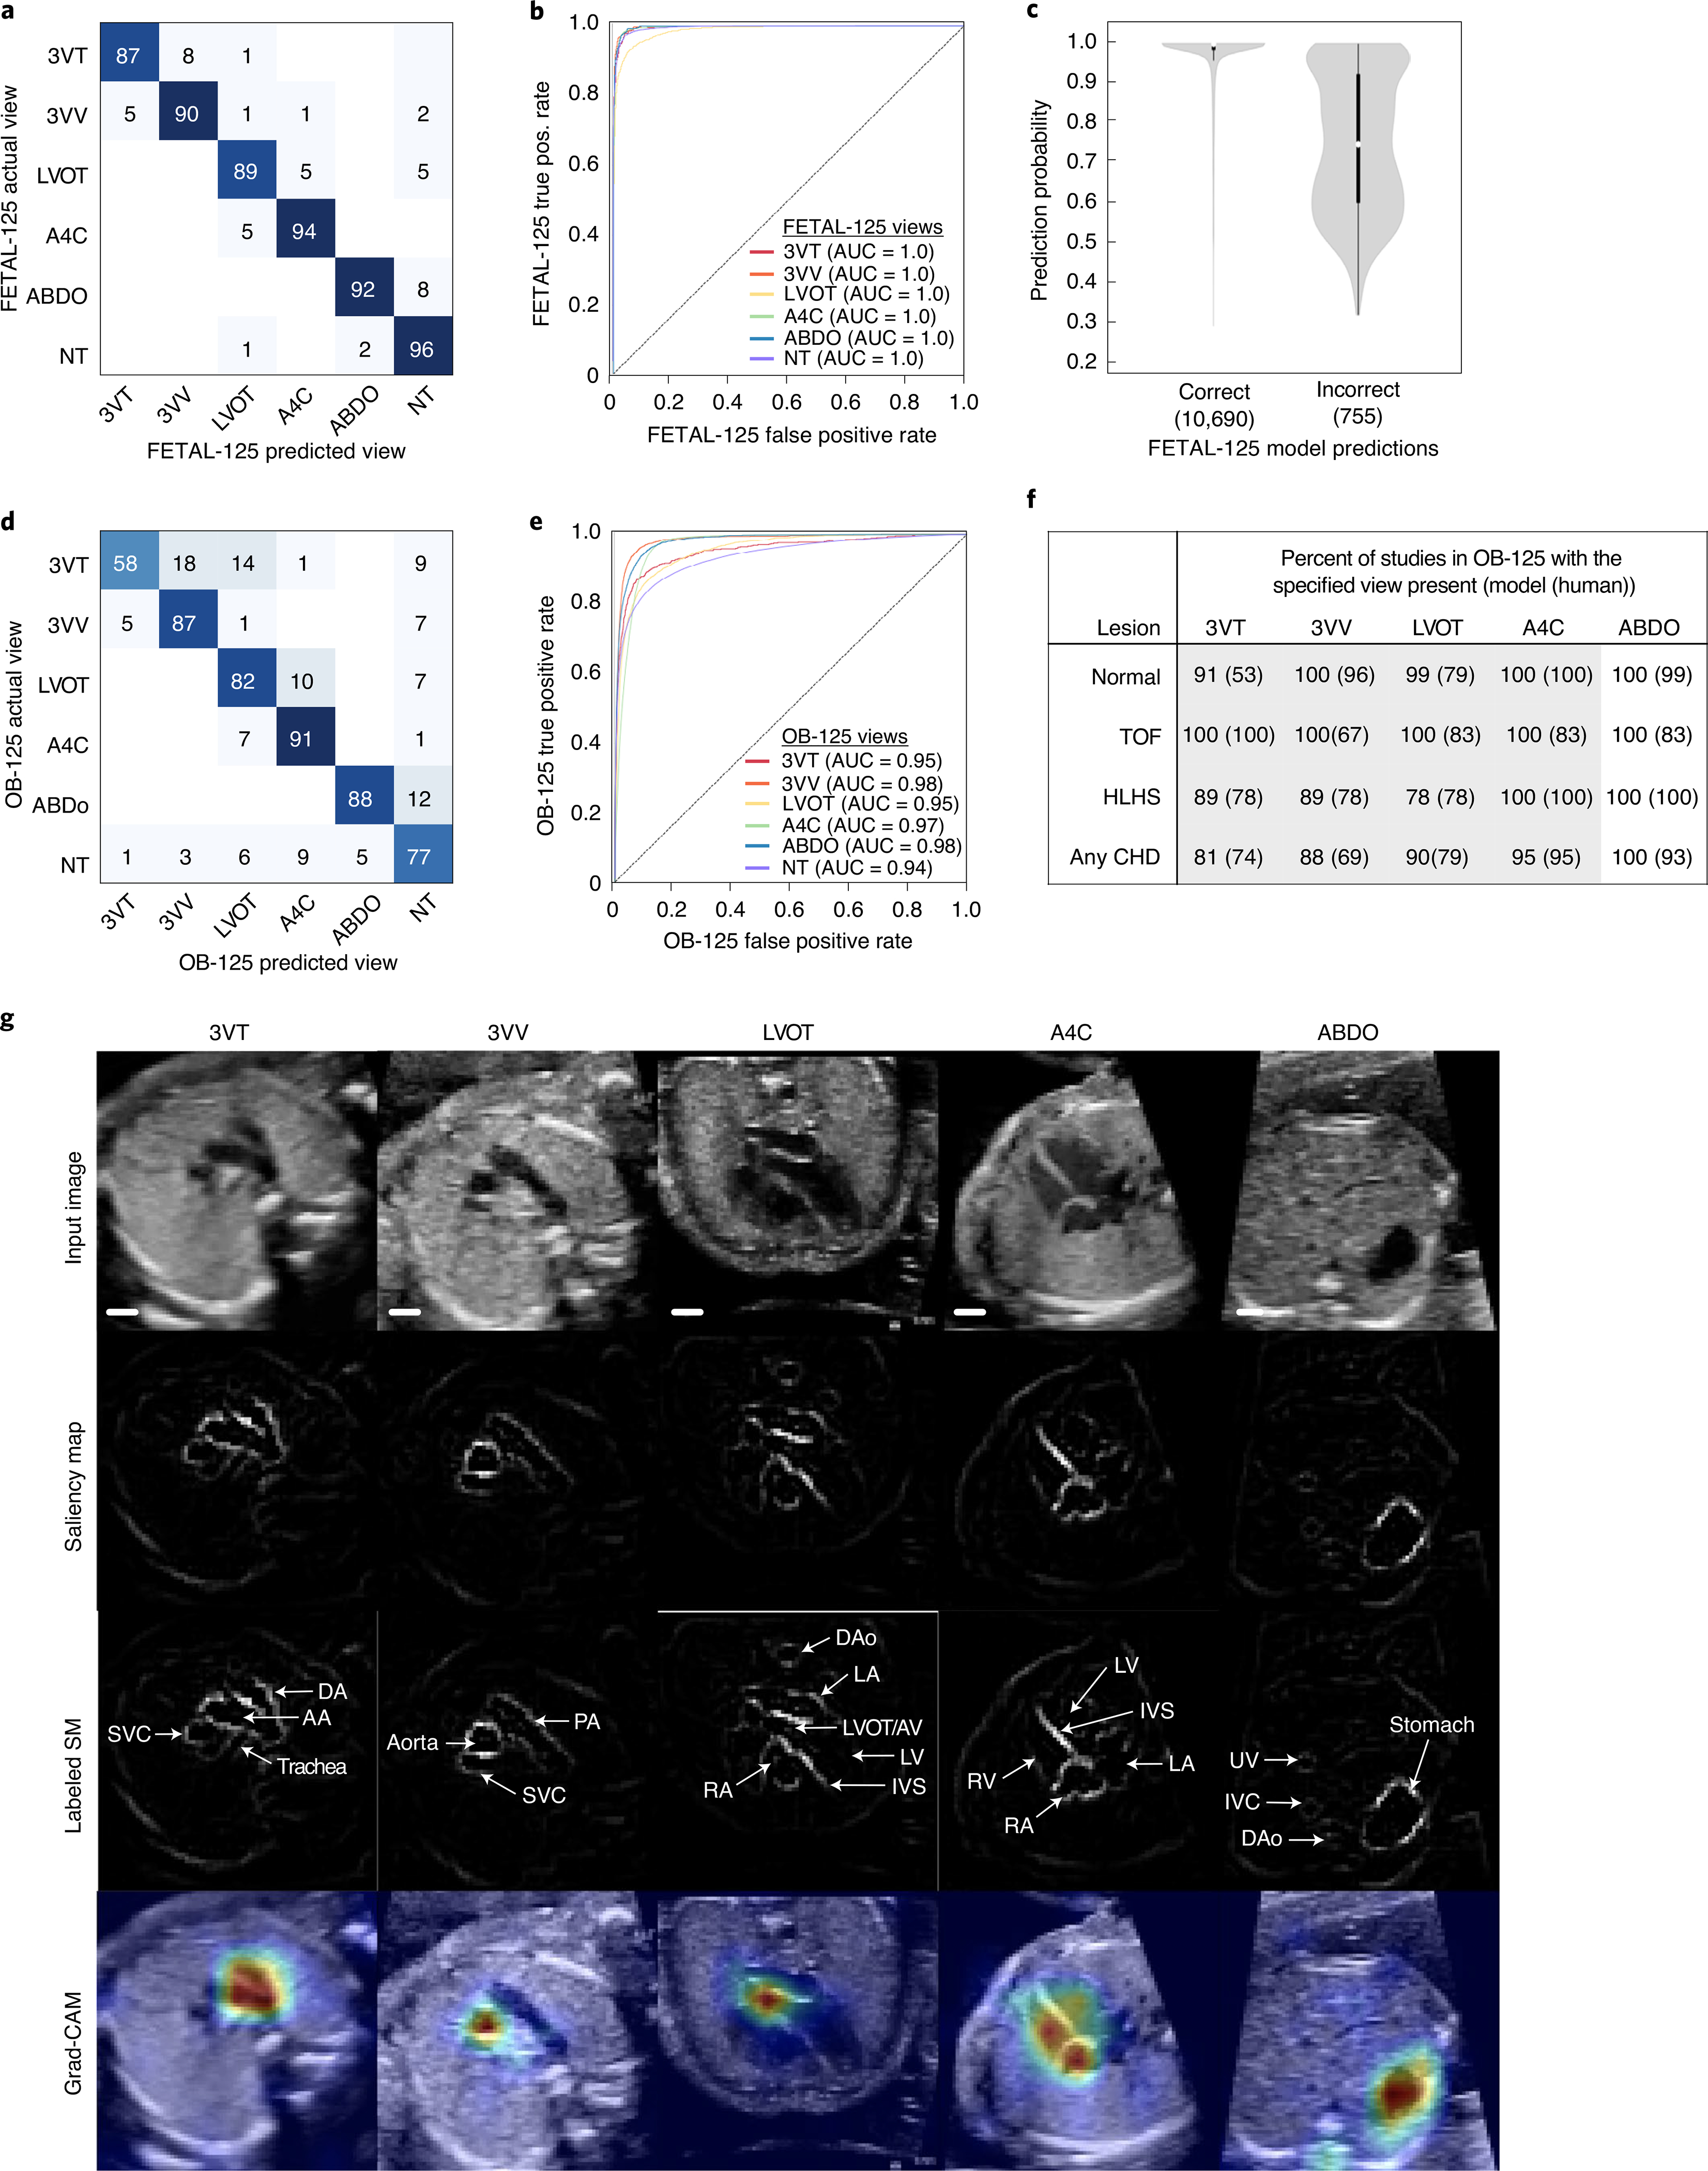
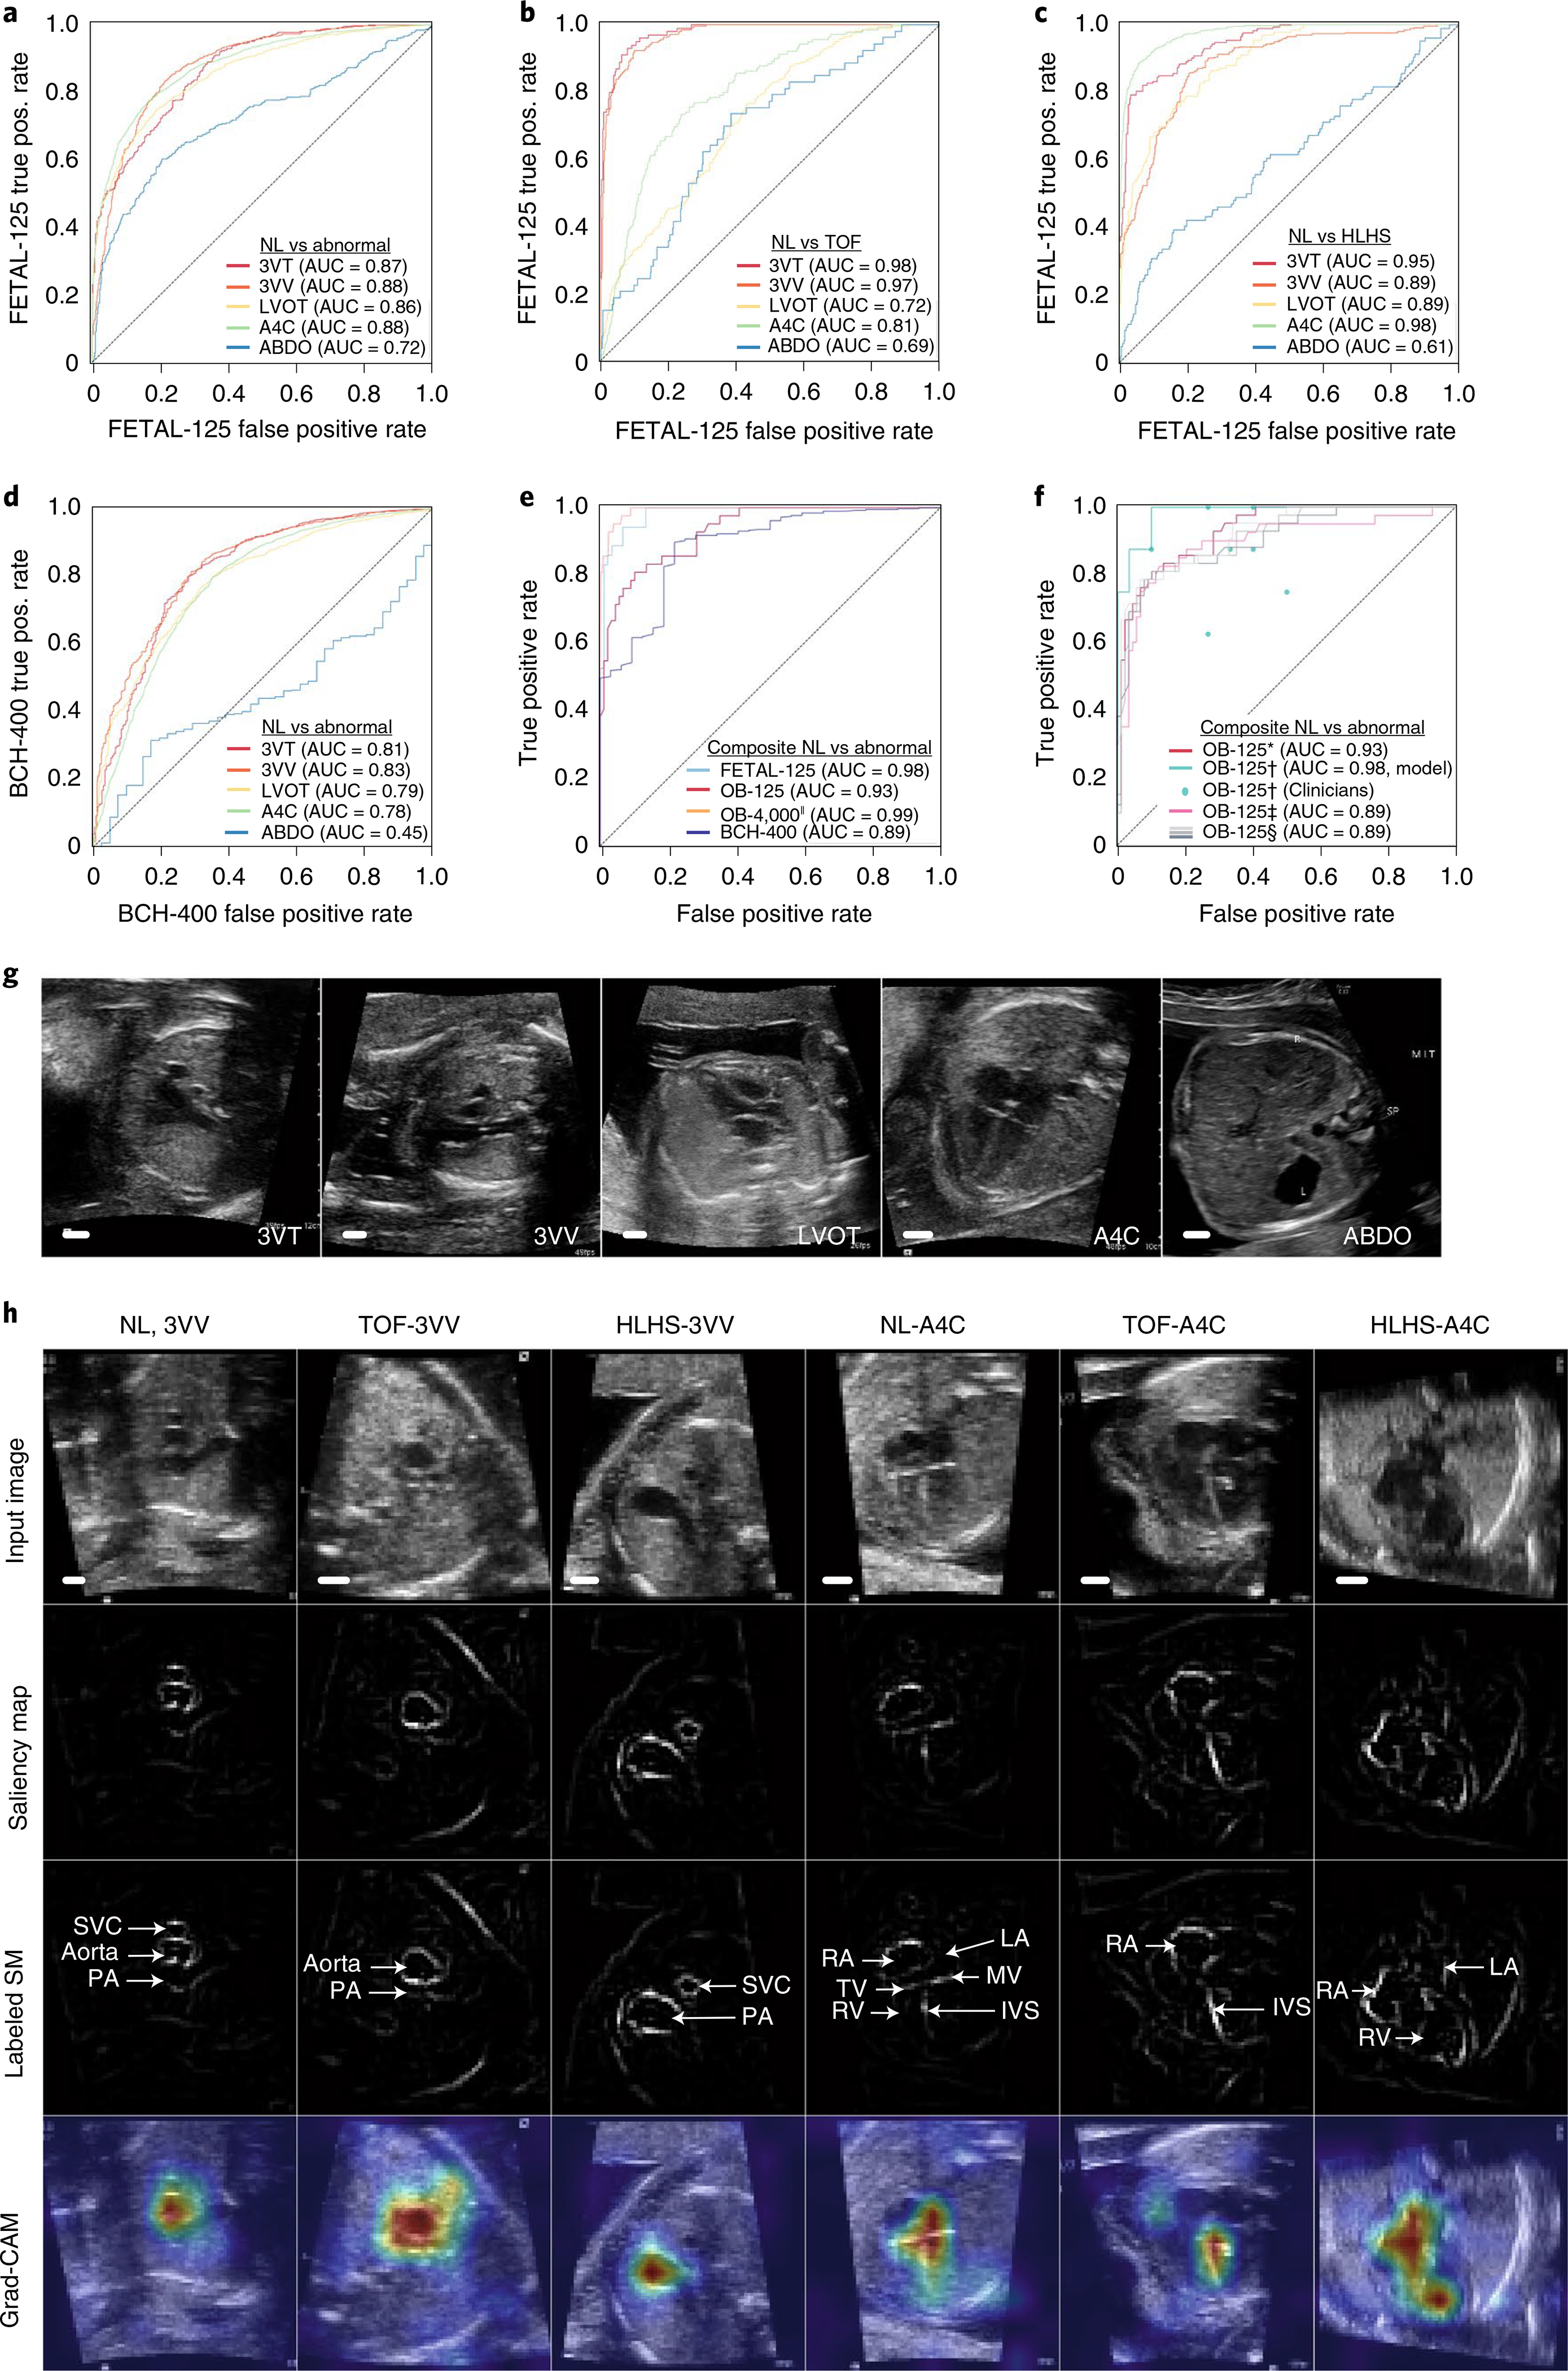
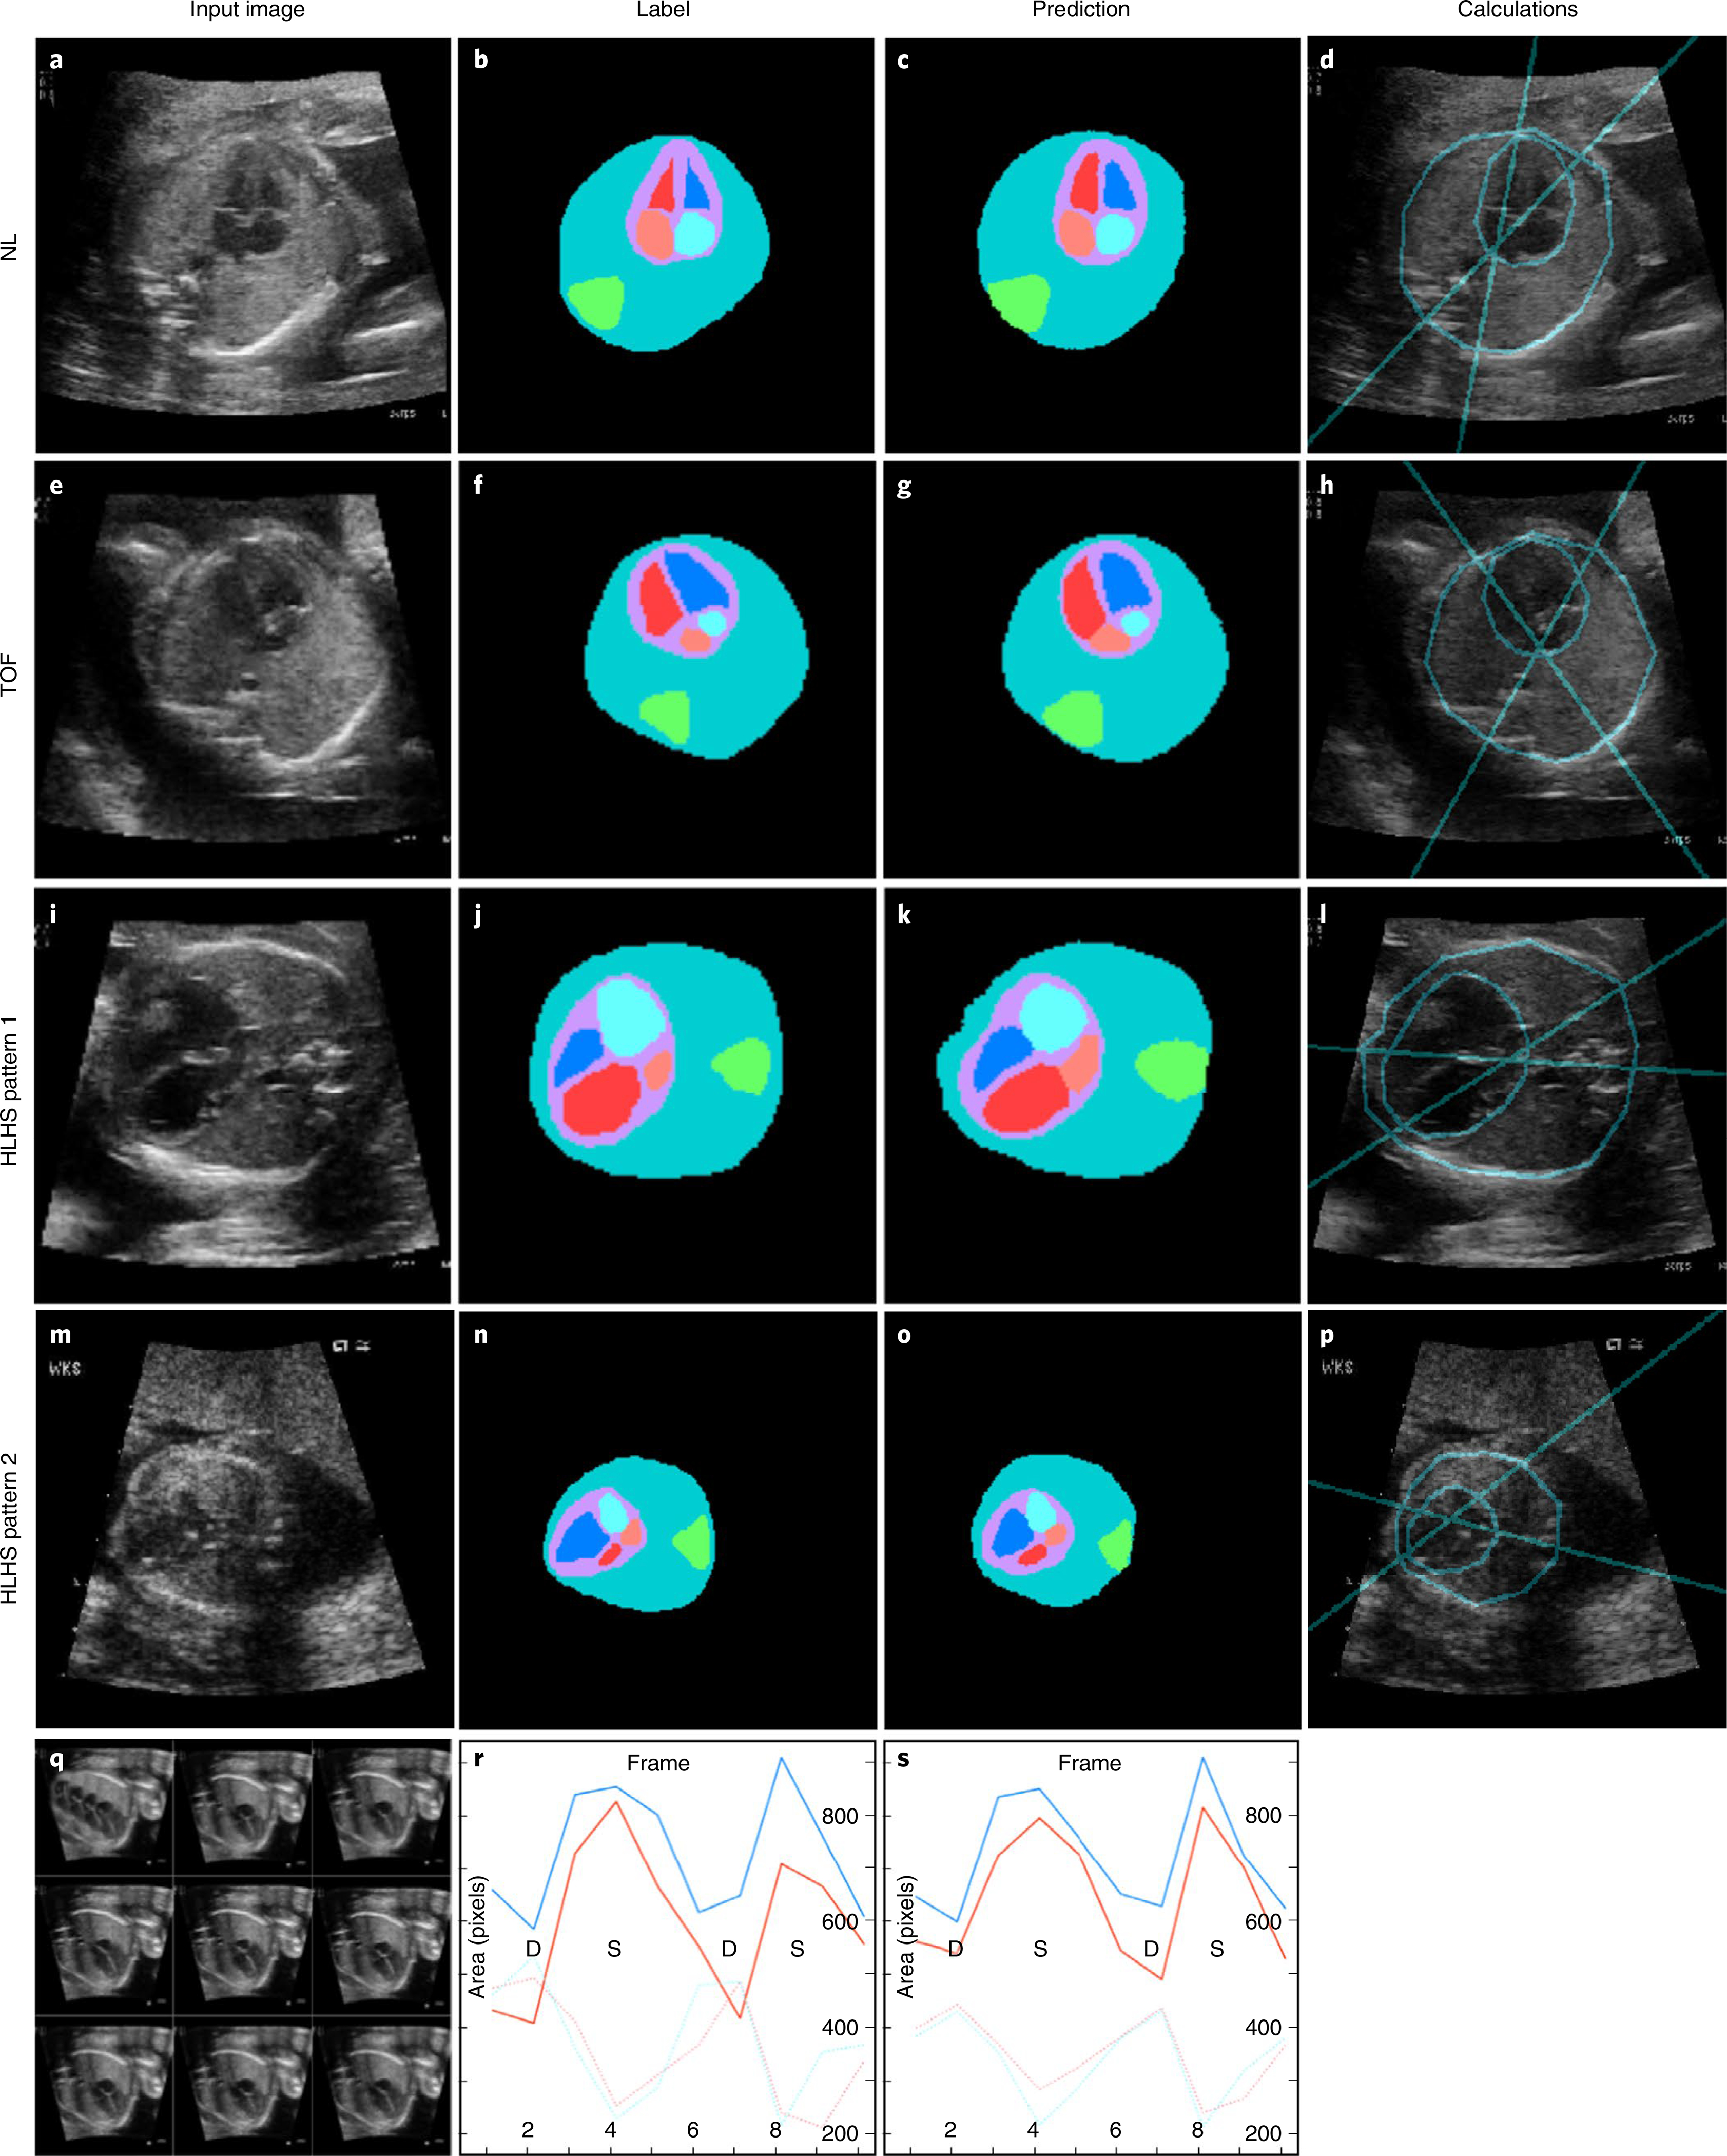
Congenital heart disease (CHD) is the most common birth defect. Fetal screening ultrasound provides five views of the heart that together can detect 90% of complex CHD, but in practice, sensitivity is as low as 30%. Here, using 107,823 images from 1,326 retrospective echocardiograms and screening ultrasounds from 18- to 24-week fetuses, we trained an ensemble of neural networks to identify recommended cardiac views and distinguish between normal hearts and complex CHD. We also used segmentation models to calculate standard fetal cardiothoracic measurements. In an internal test set of 4,108 fetal surveys (0.9% CHD, >4.4 million images), the model achieved an area under the curve (AUC) of 0.99, 95% sensitivity (95% confidence interval (CI), 84-99%), 96% specificity (95% CI, 95-97%) and 100% negative predictive value in distinguishing normal from abnormal hearts. Model sensitivity was comparable to that of clinicians and remained robust on outside-hospital and lower-quality images. The model's decisions were based on clinically relevant features. Cardiac measurements correlated with reported measures for normal and abnormal hearts. Applied to guideline-recommended imaging, ensemble learning models could significantly improve detection of fetal CHD, a critical and global diagnostic challenge.


Conflict of interest statement

Competing interests

Some methods used in this work have been filed in a provisional patent application.

Figures

Extended Data Fig. 1 |
Extended Data Fig. 1 |. Neural network architectures and schematic of rules-based classifier.
a, Neural network architecture used for classification, based on ResNet (He et. al. 2015). Numbers indicate the number of filters in each layer, while the legend indicates the type of layer. For convolutional layers (grey), the size and stride of the convolutional filters is indicated in the legend. b, Neural network architecture used for segmentation, based on UNet (Ronneberger et. al. 2015). Numbers indicate the pixel dimensions at each layer. c, A schematic for the rules-based classifier (‘Composite dx classifier,’ Figure 1b) used to unite per-view, per-image predictions from neural network classifiers into a composite (per-heart) prediction of normal vs. CHD. Only views with AUC > 0.85 on validation data were used. For each view, there are various numbers of images k,l,m,n, each with a per-image prediction probability pCHD and pNL. For each view, per-image pCHD and pNL were summed and scaled (see Methods) into a pair of overall prediction values for each view (for example PCHD3VT and PNL3VT). These are in turn summed for a composite classification. Evaluating true positive, false positive, true negative, and false negative with different offset numbers allowed construction of an ROC curve for each test dataset (Figure 3e). 3VT, 3-vessel trachea. 3VV, 3-vessel view. LVOT, left ventricular outflow tract. A4C, axial 4-chamber.
Extended Data Fig. 2 |
Extended Data Fig. 2 |. Bland-Altman plots comparing cardiac measurements from labeled vs. predicted structures.
CTR, cardiothoracic ratio; CA, cardiac axis; LV, left ventricle; RV, right ventricle; LA, left atrium, RA, right atrium. Legend indicates measures for normal hearts (NL), hypoplastic left heart syndrome (HLHS), and tetralogy of Fallot (TOF).
Extended Data Fig. 3 |
Extended Data Fig. 3 |. Model confidence on sub-optimal images.
Examples of sub-optimal quality images (target views found by the model but deemed low-quality by human experts) are shown for each view, along with violin plots showing prediction probabilities assigned to the sub-optimal target images (White dots signify mean, thick black line signifies 1st to 3rd quartiles). Numbers in parentheses on top of violin plots indicate the number of independent images represented in each plot. For 3VT images, minimum, Q1, median, Q3, and maximum prediction probabilities are 0.27, 0.55, 0.74, 0.89, and 1.0, respectively. For 3VV images, minimum, Q1, median, Q3, and maximum prediction probabilities are 0.27, 0.73, 0.91, 0.99 and 1.0, respectively. For LVOT images, minimum, Q1, median, Q3, and maximum prediction probabilities are 0.31, 0.75, 0.92, 0.99, and 1.0, respectively. For A4C images, minimum, Q1, median, Q3, and maximum prediction probabilities are 0.28, 0.80, 0.95, 0.99, and 1.0, respectively. For ABDO images, minimum, Q1, median, Q3, and maximum prediction probabilities are 0.36, 0.83, 0.97, 1.0, and 1.0, respectively. Scale bars indicate 5mm. 3VT, 3-vessel trachea. 3VV, 3-vessel view. LVOT, left ventricular outflow tract. A4C, axial 4-chamber; ABDO, abdomen.
Extended Data Fig. 4 |
Extended Data Fig. 4 |. Misclassifications from per-view diagnostic classifiers.
Top row: Example images misclassified by the diagnostic classifiers, with probabilities for the predicted class. Relevant cardiac structures are labeled. Second row: corresponding saliency map. Third row: Grad-CAM. Fourth row: possible interpretation of model’s misclassifications. Importantly, this is only to provide some context for readers who are unfamiliar with fetal cardiac anatomy; formally, it is not possible to know the true reason behind model misclassification. Fifth row: Clinician’s classification (normal vs. CHD) on the isolated example image. Sixth row: Model’s composite prediction of normal vs. CHD using all available images for the given study. For several of these examples, the composite diagnosis per study is correct, even when a particular image-level classification was incorrect. Scale bars indicate 5 mm. 3VV, 3-vessel view. A4C, axial 4-chamber. SVC, superior vena cava. PA, pulmonary artery. RA, right atrium. RV, right ventricle. LA, left atrium. LV, left ventricle.
Extended Data Fig. 5 |
Extended Data Fig. 5 |. Inter-observer agreement on a subset of labeled data.
Inter-observer agreement on a sample of FETAL-125 is shown as Cohen’s Kappa statistic across different views, where poor agreement is 0–0.20; fair agreement is 0.21–0.40; moderate agreement is 0.41–0.60; good agreement is 0.61–0.80 and excellent agreement is 0.81–1.0. Of note, images where clinicians did not agree were not included in model training (see Methods). Most agreement is good or excellent, with moderate agreement on including 3VT and 3VV views as diagnostic-quality vs. non-target. 3VT, 3-vessel trachea. 3VV, 3-vessel view. LVOT, left ventricular outflow tract. A4C, axial 4-chamber, ABDO, abdomen, NT, non-target.
Fig. 1 |
Fig. 1 |. Overview of the ensemble model.
a, Guidelines recommend that the indicated five axial views be used to detect CHD. The illustration was adapted with permission from yagel et. al.. b, Schematic of the overall model, which is an ensemble of the components shown. From a fetal ultrasound, a DL classifier detects the five screening views (‘DL view classifier’). Subsequent DL classifiers for each view detect whether the view is normal or abnormal (‘DL dx classifiers’). These per-image, per-view classifications are fed into a rule-based classifier (detailed in Extended Data Fig. 1c) to create a composite diagnostic decision as to whether the fetal heart is normal or abnormal (‘composite dx classifier’) (the abdomen view was not included in the composite diagnostic classifier because, clinically, the abdomen view does not commonly contribute to diagnosis; see Methods for further details). A4C views were also passed to a segmentation model to extract fetal cardiac biometrics. NT, non-target; dx, diagnosis.
Fig. 2 |
Fig. 2 |. Performance of the view detection step of the ensemble model.
Normalized confusion matrix (a) and ROC curve (b) showing classifier performance on normal hearts from the FETAL-125 test set. Pos., positive. c, Violin plots showing prediction probabilities for this test set, by correctness. In violin plots, white dots signify medians, the thick black line signifies first to third quartiles. Numbers in parentheses below the x axis indicate the number of independent images in each violin plot. For correctly predicted images, the minimum, first quartile, median, third quartile and maximum prediction probabilities are 0.29, 0.98, 1.0, 1.0 and 1.0, respectively. For incorrectly predicted images, the minimum, first quartile, median, third quartile and maximum prediction probabilities are 0.32, 0.60, 0.75, 0.92 and 1.0, respectively. Normalized confusion matrix (d) and ROC curve (e) showing classifier performance on normal hearts from the OB-125 test set. f, Percent of fetal surveys from the OB-125 test set with model-detected views (compared to human-detected views shown in parentheses). Gray shading indicates views with AUC ≥ 75 for normal versus abnormal prediction from Fig. 3a,d. g, One example test image is shown per view (top row), with a corresponding saliency map (unlabeled, second row; labeled, third row). Fourth row, Grad-CAM for the example images. Scale bars indicate 5 mm. SM, saliency map; DA, ductal arch; AA, aortic arch; SVC, superior vena cava; PA, pulmonary artery; TV, tricuspid valve; AV, aortic valve; MV, mitral valve; IVS, interventricular septum; IAS, interatrial septum (foramen ovale); RA, right atrium; RV, right ventricle; LA, left atrium; DAo, descending aorta; LV, left ventricle; UV, umbilical vein; IVC, inferior vena cava.
Fig. 3 |
Fig. 3 |. Performance of the diagnostic steps of the ensemble model.
ROC curves showing the model’s ability to distinguish normal hearts versus any CHD lesion mentioned in Table 1 (a), normal heart (NL) versus TOF (b) and NL versus HLHS (c) for each of the five views in the FETAL-125 test dataset. d, ROC curve for prediction of per-view normal versus abnormal hearts from external data (BCH-400 test set). e, ROC curves for composite (per-heart) prediction of normal versus abnormal hearts for each of the four test datasets. ‘OB-4000ll’ indicates the high-confidence target images from the OB-4000 test set (images with view-prediction probability at or above the first quartile). f, ROC curve for composite (per-heart) prediction of normal heart versus CHD for different testing scenarios for OB-125. OB-125*, all possible images present. OB-125†, only five images present, one image per view (teal line is model performance; teal dots denote clinician performance). OB-125‡, low-quality images. OB-125§, 6.5% of views scrambled to simulate error in view classification (average of three replicates). g, Example of images given to both the model and clinicians for determination of normal versus abnormal hearts in a head-to-head comparison. h, Top row, one example test image is shown for normal heart, TOF and HLHS; 3VV and A4C views are shown. Second row, corresponding unlabeled saliency map. Third row, labeled saliency map. Fourth row, Grad-CAM provides a heatmap of regions of the image most important to the model in prediction. In 3VV, the relative sizes of the aorta and pulmonary artery distinguish these lesions from normal hearts; and in A4C, the angled intraventricular septum and enlarged right heart distinguish TOF and HLHS, respectively, from normal hearts. Scale bars indicate 5 mm.
Fig. 4 |
Fig. 4 |. Analysis of fetal cardiac structure and function measurements based on segmentation provided by the ensemble model.
a,s Example input image, ground-truth label of anatomic structures, prediction of anatomic structures and calculations of the CTR and CA for a normal heart (ad), TOF (eh) and HLHS (ip). Segmentation of an image series (q) allows plots of chamber area over time (label, r; prediction, s) and identification of image frames in ventricular systole (S) and diastole (D) for FAC calculation. Scale bars indicate 5 mm. Teal, thorax; green, spine; purple, heart; red, left ventricle; pink, left atrium; blue, right ventricle; light blue, right atrium.

Comment in

Similar articles

Cited by

References

    1. Donofrio MT et al.Diagnosis and treatment of fetal cardiac disease: a scientific statement from the American Heart Association. Circulation 129, 2183–2242 (2014). - PubMed
    1. Holland BJ, Myers JA & Woods CR Jr. Prenatal diagnosis of critical congenital heart disease reduces risk of death from cardiovascular compromise prior to planned neonatal cardiac surgery: a meta-analysis. Ultrasound Obstet. Gynecol. 45, 631–638 (2015). - PubMed
    1. Wright LK et al.Relation of prenatal diagnosis with one-year survival rate for infants with congenital heart disease. Am. J. Cardiol. 113, 1041–1044 (2014). - PubMed
    1. Bensemlali M et al.Neonatal management and outcomes of prenatally diagnosed CHDs. Cardiol. Young 27, 344–353 (2017). - PubMed
    1. Li YF et al.Efficacy of prenatal diagnosis of major congenital heart disease on perinatal management and perioperative mortality: a meta-analysis. World J. Pediatr. 12, 298–307 (2016). - PubMed

Publication types

MeSH terms