. 2021 Jun;10(12):4017-4029.
doi: 10.1002/cam4.3945. Epub 2021 May 15.

Identification of a glycolysis-related gene signature associated with clinical outcome for patients with lung squamous cell carcinoma

Affiliations

Identification of a glycolysis-related gene signature associated with clinical outcome for patients with lung squamous cell carcinoma

Ziming Xu et al. Cancer Med. 2021 Jun.

Abstract

Background: Lung squamous cell carcinoma (LUSC), one of the main types of lung cancer, has caused a huge social burden. There has been no significant progress in its therapy in recent years, Resulting in a poor prognosis. This study aims to develop a glycolysis-related gene signature to predict patients' survival with LUSC and explore new therapeutic targets.

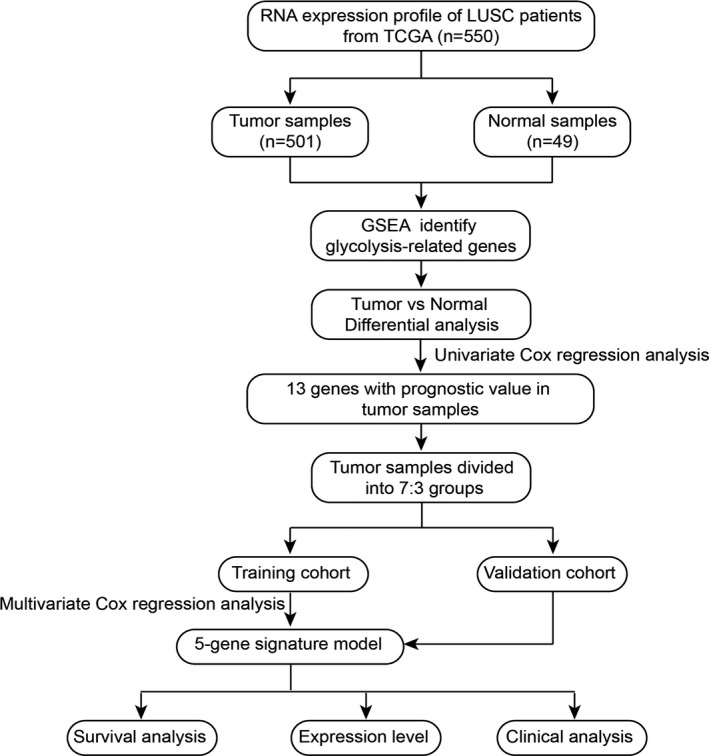
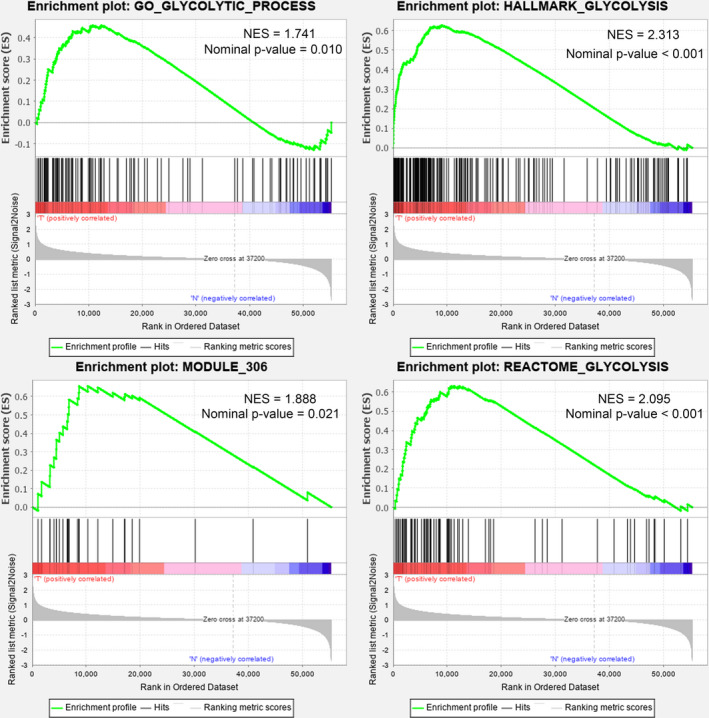
Methods: We obtained the mRNA expression and clinical information of 550 patients with LUSC from the Cancer Genome Atlas (TCGA) database. Glycolysis genes were identified by Gene Set Enrichment Analysis (GSEA). The glycolysis-related gene signature was established using the Cox regression analysis.

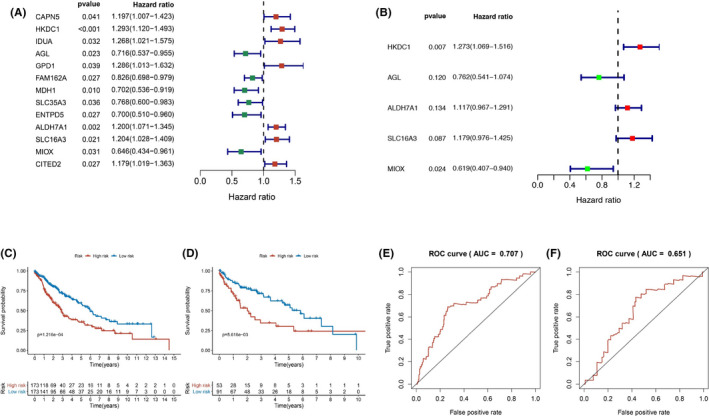
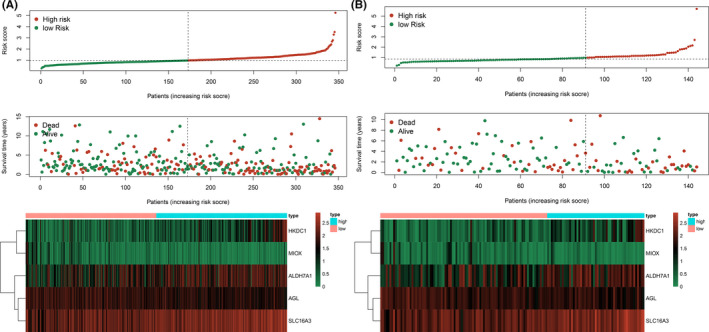
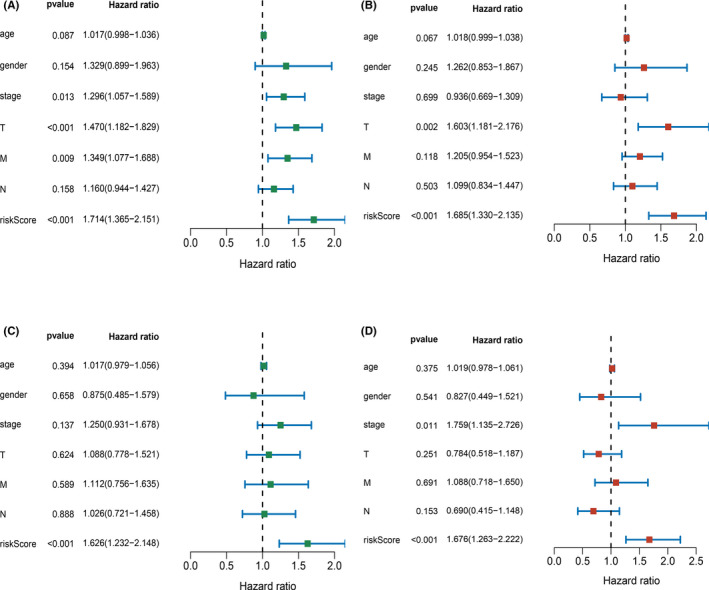
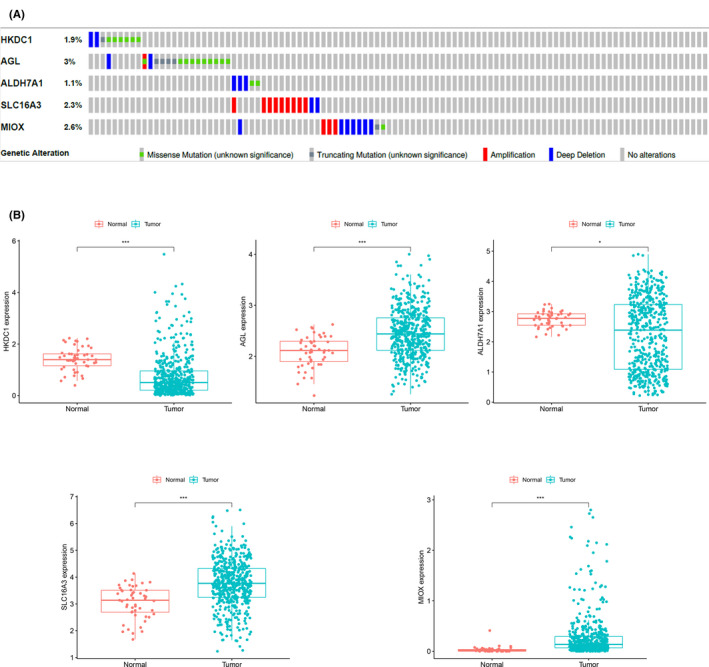
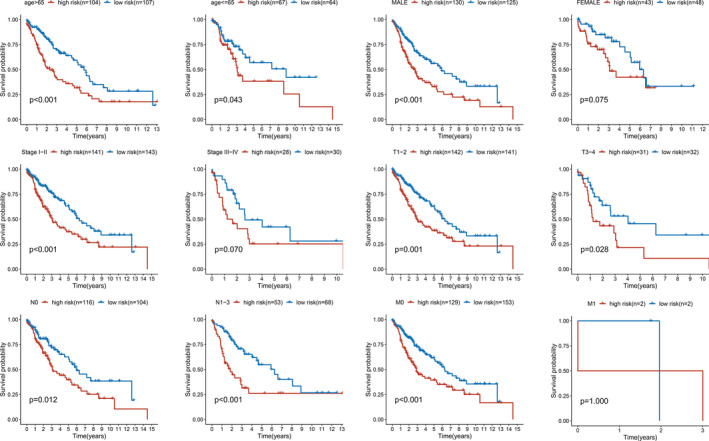
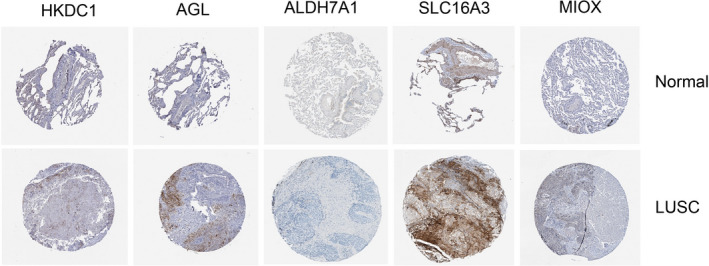
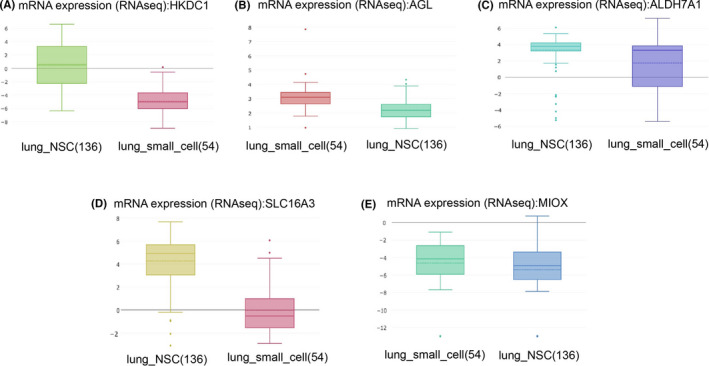
Results: We developed five glycolysis-related genes signature (HKDC1, AGL, ALDH7A1, SLC16A3, and MIOX) to calculate each patient's risk score. According to the risk score, patients were divided into high- and low-risk groups and exhibited significant differences in overall survival (OS) between the two groups. The ROC curves showed that the AUC was 0.707 for the training cohort and 0.651 for the validation cohort. Additionally, the risk score was confirmed as an independent risk factor for LUSC patients by Cox regression analysis.

Conclusion: We built a gene signature to clarify the connection between glycolysis and LUSC. This model performs well in evaluating patients' survival with LUSC and provides new biomarkers for targeted therapy.

Keywords: gene signature; glycolysis; lung squamous cell carcinoma; survival.


Conflict of interest statement

The authors have no conflict of interest to declare.

Figures

FIGURE 1
FIGURE 1
The flowchart of this study
FIGURE 2
FIGURE 2
Enrichment plots of four glycolysis‐related gene set that were significantly differentiated between LUSC patients and normal samples. The GO_GLYCOLYTIC_PROCESS gene set had an NES of 1.741 and a p value = 0.010; the HALLMARK_GLYCOLYSIS gene set had an NES of 2.313 and a p value < 0.001; the MODULE_306 gene set had an NES of 1.888 and a p value = 0.021; the REACTOME_GLYCOLYSIS gene set had an NES of 2.095 and a p value < 0.001. Gene set data were from the Molecular Signatures Database (https://www.gsea‐msigdb.org/gsea/msigdb/index.jsp). NES: normalized enrichment score
FIGURE 3
FIGURE 3
A, 13 glycolysis‐related genes were significantly related to prognosis in patients with LUSC by univariate Cox regression analysis. B, Multivariate Cox regression analysis showed that HKCD1 and MIOX were independent risk factor in the glycolysis‐related gene signature. C, Kaplan–Meier curves showed that high‐risk patients had poorer survival in the training cohort (p < 0.001). D, Kaplan–Meier curves showed high‐risk patients had worse survival in the validation cohort (p = 0.006). E, The AUC of the ROC curve was 0.707 in the training cohort. F, The AUC of the ROC curve was 0.651 in the validation cohort. ROC: Receiver Operating Characteristic. AUC: Area Under Curve
FIGURE 4
FIGURE 4
A, Top 20 GO‐BP terms. B, Top 10 KEGG terms. The length of the barplots and the size of the balls represented the number of genes enriched. The color depth represented the p value
FIGURE 5
FIGURE 5
Risk score distribution, survival time, and heatmap of 5 genes’ expression profile for each LUSC patient. A, High‐risk patients had higher mortality and shorter survival time in the training cohort. HKDC1, ALDH7A1, and SLC16A3 were high expressed in high‐risk patients, whereas AGL and MIOX were low expressed in high‐risk patients; B, Similar results were observed in the validation cohort
FIGURE 6
FIGURE 6
Univariable and multivariable Cox regression analyses for each clinical feature and risk score. A, Stage, T staging, M staging, and riskScore were significant prognostic factors for LUSC patients by univariable analysis in the training cohort; B, T staging and riskScore were significant prognostic factors for LUSC patients by multivariable analysis in the training cohort; C, Only riskScore was significant prognostic factor for LUSC patients by univariable analysis in the validation cohort; D, Stage and riskScore were significant prognostic factors for LUSC patients by multivariable analysis in the validation cohort
FIGURE 7
FIGURE 7
Selected genes‐specific alteration frequency (A) (data from CBioPortal: http://www.cbioportal.org/) and expression level between tumor samples and normal samples (B). AGL, SLC16A3, and MIOX were significantly high expressed in tumor samples, whereas HKDC1 and ALDH7A1 were significantly low expressed in tumor samples (data from the Genomic Data Commons: https://portal.gdc.cancer.gov/)
FIGURE 8
FIGURE 8
Kaplan–Meier curves for the predictive value of the risk score for LUSC patients divided by each clinical feature. High‐risk patients had a significantly worse survival than low‐risk patients in most subgroups except for the female (p = 0.075), stage III–IV (p = 0.070), and M1 subgroups (p = 1.000)
FIGURE 9
FIGURE 9
Validation of the gene signature by immunohistochemistry between LUSC and normal samples. AGL and SLC16A3 were significantly overexpressed in tumor samples compared to normal samples (data from the Human Protein Atlas: https://www.proteinatlas.org/)
FIGURE 10
FIGURE 10
Validation of the gene signature by lung cancer cell lines between non‐small‐cell lung cancer cell line and small‐cell lung cancer cell line. HKCD1 and SLC16A3 were significantly overexpressed in non‐small‐cell lung cancer cell lines than small‐cell lung cancer cell lines (data from the Cancer Cell Line Encyclopedia database https://portals.broadinstitute.org/ccle)

Similar articles

Cited by

References

    1. Siegel RL, Miller KD, Jemal A. Cancer statistics, 2020. CA Cancer J Clin. 2020;70(1):7‐30. - PubMed
    1. Rizvi NA, Hellmann MD, Brahmer JR, et al. Nivolumab in combination with platinum‐based doublet chemotherapy for first‐line treatment of advanced non‐small‐cell lung cancer. J Clin Oncol. 2016;34(25):2969‐2979. - PMC - PubMed
    1. Cheng Z, Yu C, Cui S, et al. circTP63 functions as a ceRNA to promote lung squamous cell carcinoma progression by upregulating FOXM1. Nat Commun. 2019;10(1):3200. - PMC - PubMed
    1. Qi L, Gao C, Feng F, et al. MicroRNAs associated with lung squamous cell carcinoma: new prognostic biomarkers and therapeutic targets. J Cell Biochem. 2019;120(11):18956‐18966. - PubMed
    1. Xu Y, Li J, Wang P, Zhang Z, Wang X. LncRNA HULC promotes lung squamous cell carcinoma by regulating PTPRO via NF‐kappaB. J Cell Biochem. 2019;120(12):19415‐19421. - PubMed

MeSH terms

LinkOut - more resources