

covid19census: U.S. and Italy COVID-19 metrics and other epidemiological data
- PMID: 33991092
- PMCID: PMC8122363
- DOI: 10.1093/database/baab027
covid19census: U.S. and Italy COVID-19 metrics and other epidemiological data
Abstract
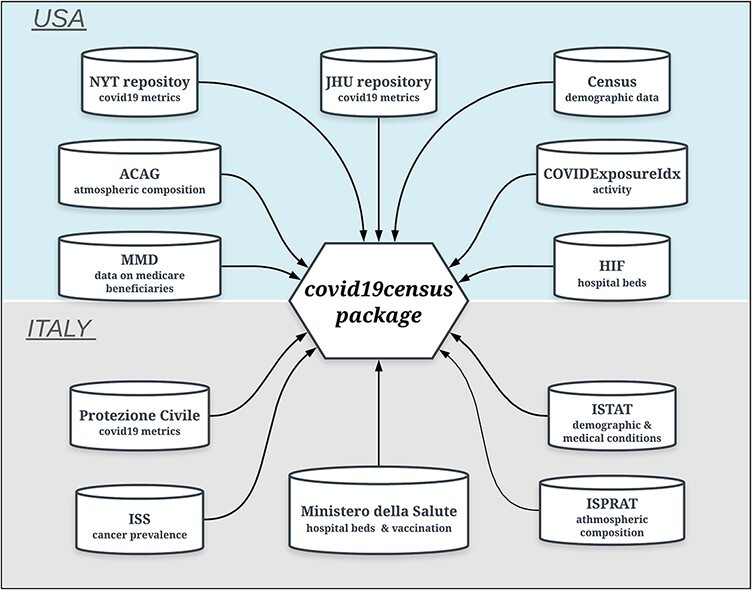
Since the beginning of the coronavirus disease-2019 (COVID-19) pandemic in 2020, there has been a tremendous accumulation of data capturing different statistics including the number of tests, confirmed cases and deaths. This data wealth offers a great opportunity for researchers to model the effect of certain variables on COVID-19 morbidity and mortality and to get a better understanding of the disease at the epidemiological level. However, in order to draw any reliable and unbiased estimate, models also need to take into account other variables and metrics available from a plurality of official and unofficial heterogenous resources. In this study, we introduce covid19census, an R package that extracts from many different repositories and combines together COVID-19 metrics and other demographic, environment- and health-related variables of the USA and Italy at the county and regional levels, respectively. The package is equipped with a number of user-friendly functions that dynamically extract the data over different timepoints and contains a detailed description of the included variables. To demonstrate the utility of this tool, we used it to extract and combine different county-level data from the USA, which we subsequently used to model the effect of diabetes on COVID-19 mortality at the county level, taking into account other variables that may influence such effects. In conclusion, it was observed that the 'covid19census' package allows to easily extract area-level data from both the USA and Italy using few functions. These comprehensive data can be used to provide reliable estimates of the effect of certain variables on COVID-19 outcomes. Database URL: https://github.com/c1au6i0/covid19census.
© The Author(s) 2021. Published by Oxford University Press.
Figures

References
-
- CDC . (2020) COVID Data Tracker. https://covid.cdc.gov/covid-data-tracker (2 April 2021, date last accessed).
-
- The New York Times . (2021) Coronavirus (Covid-19) data in the United States. The New York Times.
-
- The COVID Tracking Project . https://covidtracking.com/ (2 April 2021, date last accessed).
-
- Guidotti,E. and Ardia,D. (2020) COVID-19 data hub. J. Open Source Softw., 5, 2376.
Publication types
MeSH terms
Grants and funding
LinkOut - more resources
Full Text Sources
Other Literature Sources
Medical
Molecular Biology Databases
