. 2021 Aug 1;42(11):3343-3351.
doi: 10.1002/hbm.25452. Epub 2021 May 15.

BACON: A tool for reverse inference in brain activation and alteration

Affiliations

BACON: A tool for reverse inference in brain activation and alteration

Tommaso Costa et al. Hum Brain Mapp. .

Abstract

Over the past decades, powerful MRI-based methods have been developed, which yield both voxel-based maps of the brain activity and anatomical variation related to different conditions. With regard to functional or structural MRI data, forward inferences try to determine which areas are involved given a mental function or a brain disorder. A major drawback of forward inference is its lack of specificity, as it suggests the involvement of brain areas that are not specific for the process/condition under investigation. Therefore, a different approach is needed to determine to what extent a given pattern of cerebral activation or alteration is specifically associated with a mental function or brain pathology. In this study, we present a new tool called BACON (Bayes fACtor mOdeliNg) for performing reverse inference both with functional and structural neuroimaging data. BACON implements the Bayes' factor and uses the activation likelihood estimation derived-maps to obtain posterior probability distributions on the evidence of specificity with regard to a particular mental function or brain pathology.

Keywords: Bayes' factor; activation likelihood estimation; coordinate-based meta-analysis; fMRI; reverse inference; voxel-based morphometry.


Conflict of interest statement

The authors declare no potential conflict of interest.

Figures
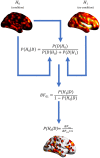
FIGURE 1
FIGURE 1
Graphical representation of the role of the maps, previously obtained in the pipeline, for the Bayes' Factor calculation as implemented in the plug‐in. In the formula, the numerator represents the probability calculated from the unthresholded ALE map showing the effect of interest. In the denominator, the probability calculated from this same map is summed with the probability calculated for its negation (i.e., the unthresholded ALE map computed on the experiments not showing the effect of interest). The final map represents values of probabilities, obtained by means of the BF 01 computation, and can be thresholded depending on the desired level of probability. Maps are showed for visualization purpose only, and are not based on the data described in the Section 2
FIGURE 2
FIGURE 2
Examples of pipeline for the calculation of specificity using the BACON plug‐in
FIGURE 3
FIGURE 3
Posterior maps of the specificity of the PAIN threshold at p(PAIN| activation) = 0.7 (70%) and p(PAIN| activation) = 0.8 (80%)
FIGURE 4
FIGURE 4
Comparison of the results of the behavioral analysis on the maps related to the cognitive domain “pain.” Top panel refers to the map produced by BACON and thresholded at p = .7. Middle panel refers to the map produced by BACON and thresholded at p = .8. Bottom panel refers to the map available on Neurosynth. Colors refer to the domain, as they are organized in the behavioral analysis tool. All the showed sub‐domains are statistically significant (z ≥3)
FIGURE 5
FIGURE 5
Posterior probability maps of the specificity to Schizophrenia, thresholded at p(SCZ| alteration) = 0.7 (70%) and 0.8 (80%)
FIGURE 6
FIGURE 6
Comparison of the results of the behavioral analysis on the maps related to schizophrenia. Top panel refers to the map produced by BACON and thresholded at p = .7. Bottom panel refers to the map produced by BACON and thresholded at p = .8

References

    1. Anderson, M. L. , Kinnison, J. , & Pessoa, L. (2013). Describing functional diversity of brain regions and brain networks. NeuroImage, 73, 50–58. 10.1016/j.neuroimage.2013.01.071 - DOI - PMC - PubMed
    1. Ashburner, J. , & Friston, K. J. (2000). Voxel‐based morphometry—The methods. NeuroImage, 11(6), 805–821. - PubMed
    1. Cauda, F. , Nani, A. , Costa, T. , Palermo, S. , Tatu, K. , Manuello, J. , … Keller, R. (2018). The morphometric co‐atrophy networking of schizophrenia, autistic and obsessive spectrum disorders. Human Brain Mapping, 39(5), 1898–1928. 10.1002/hbm.23952 - DOI - PMC - PubMed
    1. Cauda, F. , Nani, A. , Liloia, D. , Manuello, J. , Premi, E. , Duca, S. , … Costa, T. (2020). Finding specificity in structural brain alterations through Bayesian reverse inference. Human Brain Mapping, 41(5), 4155–4172. 10.1002/hbm.25105 - DOI - PMC - PubMed
    1. Cauda, F. , Nani, A. , Manuello, J. , Liloia, D. , Tatu, K. , Vercelli, U. , … Costa, T. (2019). The alteration landscape of the cerebral cortex. NeuroImage, 184, 359–371. 10.1016/j.neuroimage.2018.09.036 - DOI - PMC - PubMed

Publication types