Review
. 2021 Nov;51(12):2425-2436.
doi: 10.1007/s00247-021-05095-8. Epub 2021 May 15.

Translational research in pediatric contrast-enhanced ultrasound

Affiliations
Review

Translational research in pediatric contrast-enhanced ultrasound

Anush Sridharan et al. Pediatr Radiol. 2021 Nov.

Abstract

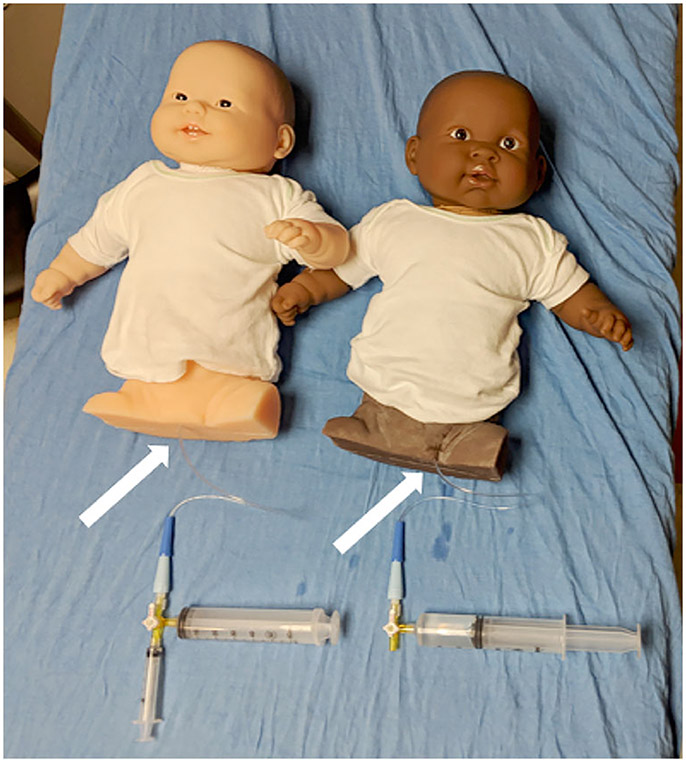
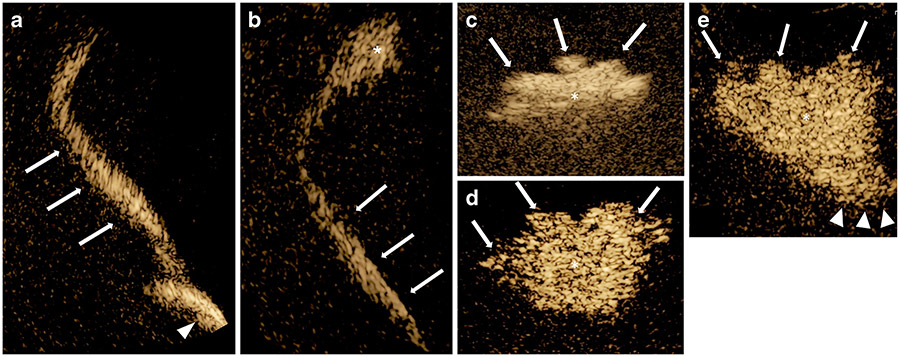
The role of contrast-enhanced ultrasound (CEUS) imaging is being widely explored by various groups for its use in the pediatric population. Clinical implementation of new diagnostic or therapeutic techniques requires extensive and meticulous preclinical testing and evaluation. The impact of CEUS will be determined in part by the extent to which studies are oriented specifically toward a pediatric population. Rather than simply applying principles and techniques used in the adult population, these studies are expected to advance and augment preexisting knowledge with pediatric-specific information. To further develop this imaging modality for use in children, pediatric-focused preclinical research is essential. In this paper we describe the development and implementation of the pediatric-specific preclinical animal and phantom models that are being used to evaluate CEUS with the goal of clinical translation to children.

Keywords: Children; Contrast-enhanced ultrasound; Fetus; Neonates; Phantom; Translational research; Ultrasound; Ultrasound contrast agents.


Conflict of interest statement

Conflicts of interest Shelby Kutty is a consultant for GE Healthcare.

Figures

Fig. 1
Fig. 1
Dual-screen transcranial US image (coronal plane) through the fetal lamb (108 days of gestation) brain using VueBox (Bracco, Milan, Italy) analysis software. a Gray-scale US image for localization. b Contrast-enhanced US image with color map represents peak enhancement in the region of interest included in the green circle
Fig. 2
Fig. 2
Severe left spermatic cord occlusion. a Final frame from contrast-enhanced ultrasound (CEUS) imaging sequence shows four regions of interest within the right (R) and left (L) testicles in a rabbit model of testicular ischemia. The experimentally occluded left testicle appears swollen and hypoechoic compared with the contralateral normal right testicle and is surrounded by a small hydrocele. b Individual image frames are shown, with the final frame corresponding to (a), outlined with yellow box. c Corresponding testicular replenishment curves. There is a significant delay in the rate of rise of the left testicular replenishment curves (arrowhead) compared with the right testicular curves (arrow). A decrease in the amplitude of the plateau levels of the left testicle, as compared with the right testicle, is also seen. Reprinted with permission from [55]
Fig. 3
Fig. 3
Testicular mean US pixel intensity ratios (y-axis) in transverse (black), longitudinal (pink) and combined transverse and longitudinal (green) planes at different degrees of surgically induced testicular torsion (x-axis) follow a trend resembling that of the reference standard mean radiolabeled microsphere (RLMS) blood flow ratios (orange) at each degree of torsion. a–c Measurements obtained immediately (a) and 4 h (b) and 8 h (c) after surgery. There was no consistent improvement in correlation when data from the transverse and longitudinal planes were combined over those obtained from separate analysis of data from the averaged transverse planes and averaged longitudinal planes, although the weakest correlation was seen with US data derived from the averaged transverse planes alone in the immediate postoperative period. Reprinted with permission from [56]
Fig. 4
Fig. 4
Real-time three-dimensional (3-D) assessment of blood flow from a tissue volume obtained using a 2-D matrix-phased-array US transducer in a rabbit model of unilateral testicular torsion. a, b The cumulative change in signal intensity for the right (R) and left (L) testicles is depicted at baseline (a) and after 720° of left-side torsion (b), where there is a visually obvious decrease in cumulative signal intensity in the left testicle compared to the normal right testicle. The brightest signal intensity in yellow corresponds to the highest amount of US contrast agent signal and the lowest is represented by the blue areas. Reprinted with permission from [57]
Fig. 5
Fig. 5
Baseline values for testicular perfusion. Scatter plot shows the contrast-enhanced US intensity change ratios (y-axis) compared to the reference standard radiolabeled microsphere testicular perfusion ratios (x-axis) between the intervention and control testicles at baseline and postoperatively for different degrees of torsion. I/C intervention (testis)/control (testis). Reprinted with permission [57]
Fig. 6
Fig. 6
Postoperative values for testicular perfusion. Scatter plot shows the contrast-enhanced US intensity change ratios (y-axis) compared to the reference standard radiolabeled microsphere testicular perfusion ratios (x-axis) between the intervention and control testicles restricted to postoperative values at different degrees of torsion. I/C intervention (testicle)/control (testicle). Reprinted with permission [57]
Fig. 7
Fig. 7
Kidney models. Three-dimensional model of two contrast-enhanced voiding urosonography phantoms on 3-matic software (Materialise NV, Leuven, Belgium). a Kidney model simulates vesicoureteral reflux (VUR) grades 4 (right) and 2 (left). b Kidneymodel simulates VUR grades 3 (right) and 5 (left)
Fig. 8
Fig. 8
Vesicoureteral reflux (VUR) models. a Three-dimensional (3-D)-printed kidney polyvinyl alcohol models depict VUR grades 4 and 2 (left) and VUR grades 3 and 5 (right). b 3-D-printed external acrylonitrile butadiene styrene mold of an infantile abdomen and pelvis (black), and kidney model (white) embedded inside the mold. c Silicone poured into the acrylonitrile butadiene styrene mold with the polyvinyl alcohol parts embedded. d Contrast-enhanced voiding urosonography phantom with the upper torso and head of a baby doll attached to the silicone abdomen and pelvis
Fig. 9
Fig. 9
Voiding urosonography phantoms. Catheters are placed in the urethra (arrows) of the two contrast-enhanced voiding urosonography phantoms to enable filling
Fig. 10
Fig. 10
Contrast-specific US images of contrast-enhanced voiding urosonography (VUS) phantoms depict the five grades of vesicoureteral reflux (VUR) after contrast-saline solution injection. a VUR grade 1, coronal scan from the flank. Microbubbles are visible in the bladder (arrowhead) and in the ureter (arrows). b VUR grade 2. Microbubbles are visible within the ureter (arrows) and the renal pelvis (asterisk), with no significant pelvic dilation. c VUR grade 3. Microbubbles are in the pelvicalyces (asterisk), with significant pelvic dilation and moderate calyceal dilation (arrows). d VUR grade 4. Microbubbles are in the pelvicalyces (asterisk), with significant pelvic and severe calyceal dilation (arrows). e VUR grade 5. Microbubbles appear in the pelvicalyces (asterisk), with significant pelvicalyceal dilation, loss of pelvicalyceal contour (arrows) and dilated proximal tortuous ureter (arrowheads)

Similar articles

References

    1. Darge K (2010) Voiding urosonography with US contrast agent for the diagnosis of vesicoureteric reflux in children: an update. Pediatr Radiol 40:956–962 - PubMed
    1. Darge K, Moeller RT, Trusen A et al. (2005) Diagnosis of vesicoureteric reflux with low-dose contrast-enhanced harmonic ultrasound imaging. Pediatr Radiol 35:73–78 - PubMed
    1. Piskunowicz M, Kosiak W, Batko T et al. (2015) Safety of intravenous application of second-generation ultrasound contrast agent in children: prospective analysis. Ultrasound Med Biol 41:1095–1099 - PubMed
    1. Stenzel M (2013) Intravenous contrast-enhanced sonography in children and adolescents — a single center experience. J Ultrason 13:133–144 - PMC - PubMed
    1. Jacob J, Deganello A, Sellars ME et al. (2013) Contrast enhanced ultrasound (CEUS) characterization of grey-scale sonographic indeterminate focal liver lesions in pediatric practice. Ultraschall Med 34:529–540 - PubMed

LinkOut - more resources