

Agent-based evolving network modeling: a new simulation method for modeling low prevalence infectious diseases
- PMID: 33991293
- PMCID: PMC8459606
- DOI: 10.1007/s10729-021-09558-0
Agent-based evolving network modeling: a new simulation method for modeling low prevalence infectious diseases
Abstract
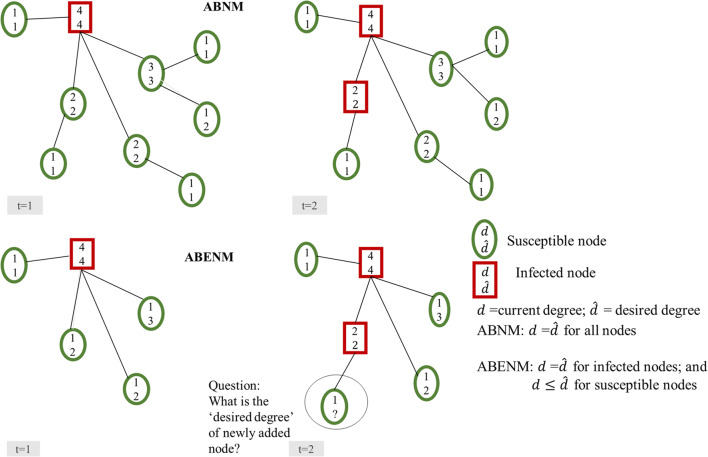
Agent-based network modeling (ABNM) simulates each person at the individual-level as agents of the simulation, and uses network generation algorithms to generate the network of contacts between individuals. ABNM are suitable for simulating individual-level dynamics of infectious diseases, especially for diseases such as HIV that spread through close contacts within intricate contact networks. However, as ABNM simulates a scaled-version of the full population, consisting of all infected and susceptible persons, they are computationally infeasible for studying certain questions in low prevalence diseases such as HIV. We present a new simulation technique, agent-based evolving network modeling (ABENM), which includes a new network generation algorithm, Evolving Contact Network Algorithm (ECNA), for generating scale-free networks. ABENM simulates only infected persons and their immediate contacts at the individual-level as agents of the simulation, and uses the ECNA for generating the contact structures between these individuals. All other susceptible persons are modeled using a compartmental modeling structure. Thus, ABENM has a hybrid agent-based and compartmental modeling structure. The ECNA uses concepts from graph theory for generating scale-free networks. Multiple social networks, including sexual partnership networks and needle sharing networks among injecting drug-users, are known to follow a scale-free network structure. Numerical results comparing ABENM with ABNM estimations for disease trajectories of hypothetical diseases transmitted on scale-free contact networks are promising for application to low prevalence diseases.
Keywords: Agent-based simulation; Disease modeling; Network modeling; Scale-free networks.
© 2021. The Author(s).
Figures
Similar articles
-
Progression and transmission of HIV (PATH 4.0)-A new agent-based evolving network simulation for modeling HIV transmission clusters.Math Biosci Eng. 2021 Mar 3;18(3):2150-2181. doi: 10.3934/mbe.2021109. Math Biosci Eng. 2021. PMID: 33892539 Free PMC article.
-
A new mixed agent-based network and compartmental simulation framework for joint modeling of related infectious diseases- application to sexually transmitted infections.Infect Dis Model. 2022 Dec 23;8(1):84-100. doi: 10.1016/j.idm.2022.12.003. eCollection 2023 Mar. Infect Dis Model. 2022. PMID: 36632177 Free PMC article.
-
sispread: A software to simulate infectious diseases spreading on contact networks.Methods Inf Med. 2007;46(1):19-26. Methods Inf Med. 2007. PMID: 17224976
-
Networks and epidemic models.J R Soc Interface. 2005 Sep 22;2(4):295-307. doi: 10.1098/rsif.2005.0051. J R Soc Interface. 2005. PMID: 16849187 Free PMC article. Review.
-
Spatio-temporal modeling of connectome-scale brain network interactions via time-evolving graphs.Neuroimage. 2018 Oct 15;180(Pt B):350-369. doi: 10.1016/j.neuroimage.2017.10.067. Epub 2017 Nov 10. Neuroimage. 2018. PMID: 29102809 Free PMC article. Review.
Cited by
-
Understanding the Impact of Social Networks on the Spread of Obesity.Int J Environ Res Public Health. 2023 Jul 26;20(15):6451. doi: 10.3390/ijerph20156451. Int J Environ Res Public Health. 2023. PMID: 37568992 Free PMC article.
-
Joint modeling HIV and HPV using a new hybrid agent-based network and compartmental simulation technique.PLoS One. 2023 Nov 3;18(11):e0288141. doi: 10.1371/journal.pone.0288141. eCollection 2023. PLoS One. 2023. PMID: 37922306 Free PMC article.
-
Progression and transmission of HIV (PATH 4.0)-A new agent-based evolving network simulation for modeling HIV transmission clusters.Math Biosci Eng. 2021 Mar 3;18(3):2150-2181. doi: 10.3934/mbe.2021109. Math Biosci Eng. 2021. PMID: 33892539 Free PMC article.
-
A new mixed agent-based network and compartmental simulation framework for joint modeling of related infectious diseases- application to sexually transmitted infections.Infect Dis Model. 2022 Dec 23;8(1):84-100. doi: 10.1016/j.idm.2022.12.003. eCollection 2023 Mar. Infect Dis Model. 2022. PMID: 36632177 Free PMC article.
-
Mechanistic modeling of social conditions in disease-prediction simulations via copulas and probabilistic graphical models: HIV case study.Health Care Manag Sci. 2025 Mar;28(1):28-49. doi: 10.1007/s10729-024-09694-3. Epub 2024 Dec 2. Health Care Manag Sci. 2025. PMID: 39621234 Free PMC article.
References
-
- Centers for Disease Control and Prevention. Estimated HIV incidence and prevalence in the United States, 2010–2015. HIV Surveillance Supplemental Report 2018;23(No. 1). http://www.cdc.gov/hiv/library/reports/hiv-surveillance.html. Published March 2018. Accessed [November 2018]
MeSH terms
Grants and funding
LinkOut - more resources
Full Text Sources
Other Literature Sources
Medical
