. 2021 Oct 11;44(10):zsab123.
doi: 10.1093/sleep/zsab123.

Sleepiness is a signal to go to bed: data and model simulations

Affiliations

Sleepiness is a signal to go to bed: data and model simulations

Tamar Shochat et al. Sleep. .

Abstract

Study objectives: Assess the validity of a subjective measure of sleepiness as an indicator of sleep drive by quantifying associations between intraindividual variation in evening sleepiness and bedtime, sleep duration, and next morning and subsequent evening sleepiness, in young adults.

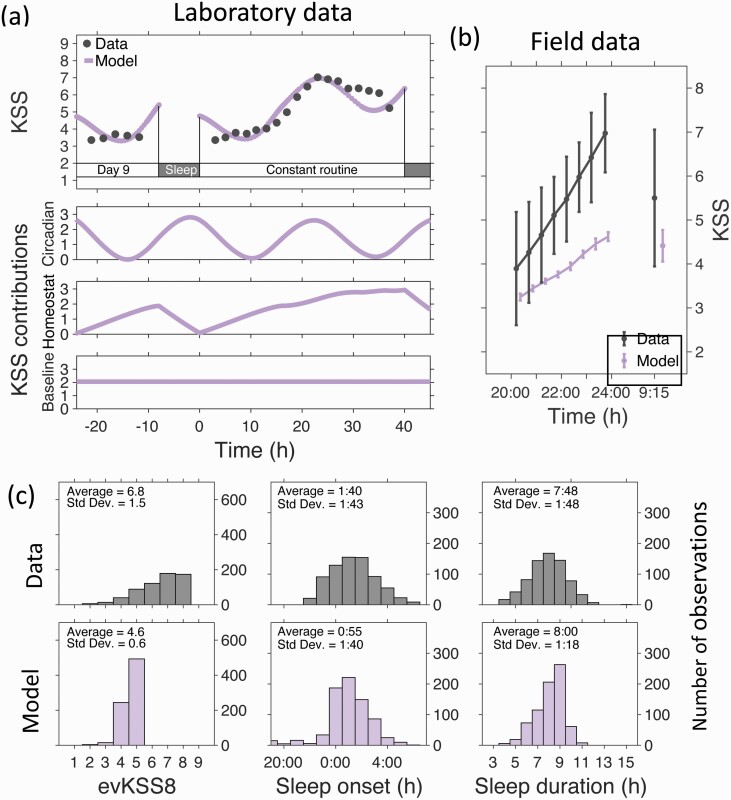
Methods: Sleep timing and sleepiness were assessed in 19 students in late autumn and late spring on a total of 771 days. Karolinska Sleepiness Scales (KSS) were completed at half-hourly intervals at fixed clock times starting 4 h prior to participants' habitual bedtime, and in the morning. Associations between sleepiness and sleep timing were evaluated by mixed model and nonparametric approaches and simulated with a mathematical model for the homeostatic and circadian regulation of sleepiness.

Results: Intraindividual variation in evening sleepiness was very large, covering four or five points on the 9-point KSS scale, and was significantly associated with subsequent sleep timing. On average, a one point higher KSS value was followed by 20 min earlier bedtime, which led to 11 min longer sleep, which correlated with lower sleepiness next morning and the following evening. Associations between sleepiness and sleep timing were stronger in early compared to late sleepers. Model simulations indicated that the directions of associations between sleepiness and sleep timing are in accordance with their homeostatic and circadian regulation, even though much of the variance in evening sleepiness and details of its time course remain unexplained by the model.

Conclusion: Subjective sleepiness is a valid indicator of the drive for sleep which, if acted upon, can reduce insufficient sleep.

Keywords: circadian regulation; mathematical model simulations; sleep duration; sleep homeostasis; sleep timing; sleepiness.


Figures

Figure 1.
Figure 1.
Evening and morning sleepiness, sleep timing and light exposure during late autumn and early spring in one participant. The horizontal bars indicate sleep timing. Each bar starts at sleep onset as defined by bedtime reported in the sleep diary and sleep latency as determined from actigrapy, and ends at wake time as reported in the sleep diary. Bars colored dark blue are weekend nights (Friday night to Saturday morning and Saturday night to Sunday morning). The circles before and after each “sleep period” are coloured according to the value on the Karolinska sleepiness scale (KSS). The yellow trace is light measured using an Actiwatch-L on a logarithmic scale.
Figure 2.
Figure 2.
Schematic representation of the mathematical modeling of the experiment. (a) A population consisting of 18 model participants was constructed in line with the number of participants for the field protocol. Each participant was assigned a different intrinsic circadian period and light exposure pattern. (b) A two-process-like mathematical model that included homeostatic sleep pressure (S) and circadian rhythmicity (C) along with light and social constraints was then used to simulate each participant. Sleepiness was modeled as proportional to the distance between S and the upper threshold of C, such that sleepiness increases when the distance between the upper threshold and S becomes smaller. Day-to-day variation in sleep timing and sleepiness was modeled by varying the position of the upper threshold. Thus a higher upper threshold (dark gray line), as for example induced by direct effects of light or caffeine, led to lower sleepiness. (c) Model outputs included sleep timing (gray bars), measures of evening and morning sleepiness (color coded circles) and circadian phase (red triangles).
Figure 3.
Figure 3.
Time course of sleepiness during the evening and reported reasons for going to bed. Panel (a) Sleepiness across eight Karolinska sleepiness scale (KSS) assessments in the evening (evKSS1-8) and in the morning (moKSS) plotted at the average time of the assessment in local clock time and hours before habitual bedtime for the late autumn (upper panel) and the late spring (lower panel) respectively. To illustrate both the time course of sleepiness and the within participant variation, evKSS1-8 and moKSS were expressed as deviations from the overall KSS median score for each individual participant separately for each season. Panel (b) Time course of average KSS scores for evKSS1-8 and moKSS, for participants in early, intermediate and late bedtime categories and plotted at the average local clock times across observations. Vertical bars reflect the between participant standard error. Panel (c) Reported reasons for going to bed. Participants could select more than one option, so the bars sum to more than 100%. The reason for going to bed was only asked in the late spring.
Figure 4.
Figure 4.
Associations between intraindividual variation in evening sleepiness and subsequent bedtime, bedtime and subsequent sleep duration, sleep duration and the following morning KSS, morning KSS and the following evening KSS. For each panel the distributions of the variables are shown using violin plots, where the violin plot for the variable plotted on the horizontal axis is at the top of the panel and the violin plot for the variable plotted on the vertical axis is to the left of the panel. The violin plots show that most of the distributions have long tails. All variables are expressed as deviations from the participant median value. The Spearman rho correlation coefficients and associated adjusted p values are shown in each panel.
Figure 5.
Figure 5.
Model fitting to laboratory data and comparison between simulations and data for KSS, bedtime and sleep duration. Panel (a) Fitted KSS time course using the mathematical model and data from a laboratory sleep extension / sleep restriction followed by 40 h of sleep deprivation study [7]. Only days 9–11 of the 12-day protocol are shown. The modeled KSS time course consisted of circadian, homeostatic and baseline contributions which are also shown. Panel (b) Time course of average KSS scores for evKSS1-8 and moKSS, for participants in the field study and for the simuated protocol. Data points are plotted at the average local clock times across observations with the exception of the simulated moKSS which has been displaced horizontally for clarity. Vertical bars reflect the between participant standard deviation. Panel (c) Histograms of the observed and simulated eighth evening KSS (evKSS8) assessment, sleep onset and sleep duration. Data for all participants and all days are included. The labels for all bins are centered. Differences between observed and simulated KSS are in part a consequence of known differences between field and laboratory measurements [13].
Figure 6.
Figure 6.
Mathematically modeled associations between evening sleepiness and subsequent bedtime, bedtime and subsequent sleep duration, sleep duration and the following morning KSS, morning KSS and the following evening KSS. For each panel the distributions of the correlated variables are shown using violin plots, where the violin plot for the variable plotted on the horizontal axis is at the top of the panel and the violin plot for the variable plotted on the vertical axis is to the left of the panel. Some of the violin plots suggest a multimodal distribution which relates to differences between weekdays and weekends. All variables are expressed as deviations from the participant median value. The Spearman rho correlation coefficients and associated p values are shown in each panel.
Figure 7.
Figure 7.
Summary of the homeostatically-regulated chain of events. Field data and simulations support a homeostatic chain of events where deviations from equilibrium are corrected. So higher evening sleepiness leads to earlier bedtime, earlier bedtime to longer sleep duration, longer sleep duration to lower morning sleepiness, lower morning sleepiness to lower evening sleepiness. Magnitudes of the associations are given for both the field data and the model, with those from the model given in brackets.

Similar articles

Cited by

References

    1. He K, et al. . Sleep-disordered breathing and excessive daytime sleepiness. Sleep Med Clin. 2017;12(3):369–382. - PubMed
    1. Akerstedt T, et al. . Subjective sleepiness is a sensitive indicator of insufficient sleep and impaired waking function. J Sleep Res. 2014;23(3):240–252. - PubMed
    1. Wyatt JK, et al. . Circadian temperature and melatonin rhythms, sleep, and neurobehavioral function in humans living on a 20-h day. Am J Physiol. 1999;277(4 Pt 2):R1152–R1163. - PubMed
    1. Agostini A, et al. . An experimental study of adolescent sleep restriction during a simulated school week: changes in phase, sleep staging, performance and sleepiness. J Sleep Res. 2017;26(2):227–235. - PubMed
    1. Van Dyk TR, et al. . Feasibility and impact on daytime sleepiness of an experimental protocol inducing variable sleep duration in adolescents. PLoS One. 2019;14(6):e0218894. - PMC - PubMed

Publication types