

Hypoxia induces expression of angiotensin-converting enzyme II in alveolar epithelial cells: Implications for the pathogenesis of acute lung injury in COVID-19
- PMID: 33991451
- PMCID: PMC8123561
- DOI: 10.14814/phy2.14854
Hypoxia induces expression of angiotensin-converting enzyme II in alveolar epithelial cells: Implications for the pathogenesis of acute lung injury in COVID-19
Abstract
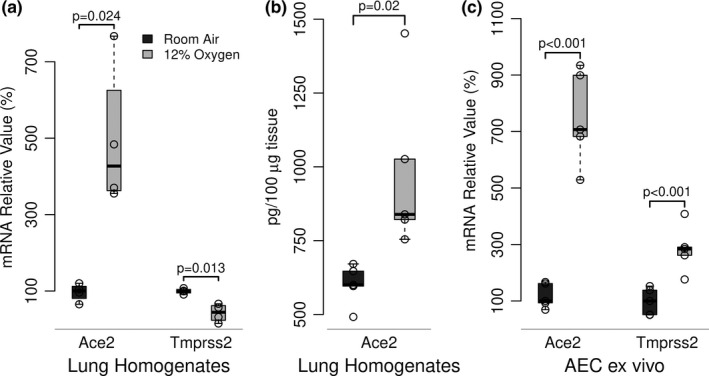
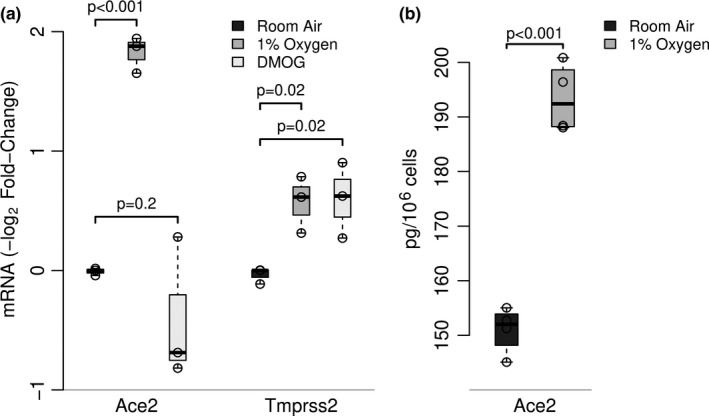
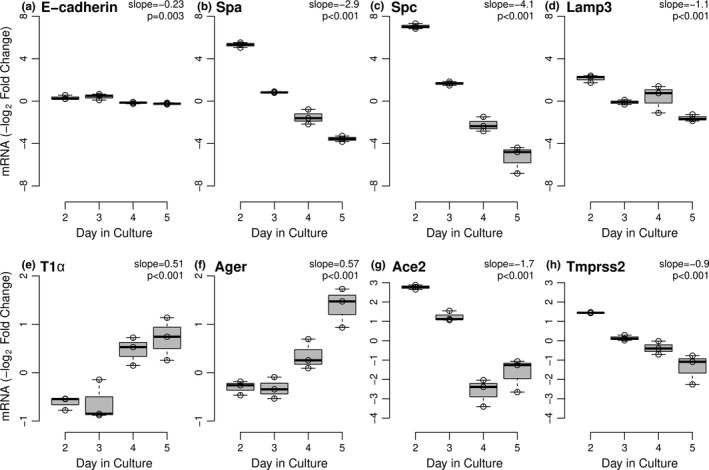
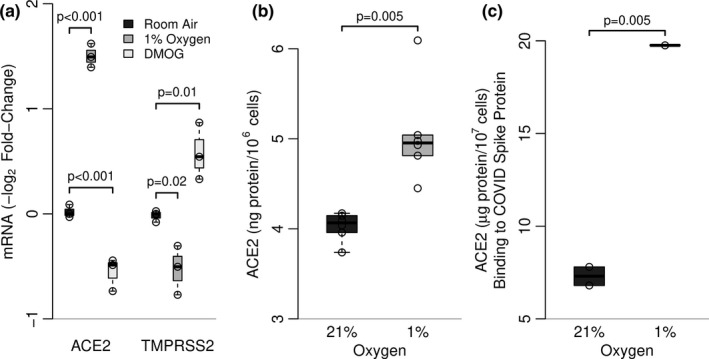
SARS-CoV-2 uptake by lung epithelial cells is a critical step in the pathogenesis of COVID-19. Viral entry is dependent on the binding of the viral spike protein to the angiotensin converting enzyme II protein (ACE2) on the host cell surface, followed by proteolytic cleavage by a host serine protease such as TMPRSS2. Infection of alveolar epithelial cells (AEC) in the distal lung is a key feature in progression to the acute respiratory distress syndrome (ARDS). We hypothesized that AEC expression of ACE2 is induced by hypoxia. In a murine model of hypoxic stress (12% FiO2), the total lung Ace2 mRNA and protein expression was significantly increased after 24 hours in hypoxia compared to normoxia (21% FiO2). In experiments with primary murine type II AEC, we found that exposure to hypoxia either in vivo (prior to isolation) or in vitro resulted in greatly increased AEC expression of both Ace2 (mRNA and protein) and of Tmprss2. However, when isolated type II AEC were maintained in culture over 5 days, with loss of type II cell characteristics and induction of type I cell features, Ace2 expression was greatly reduced, suggesting that this expression was a feature of only this subset of AEC. Finally, in primary human small airway epithelial cells (SAEC), ACE2 mRNA and protein expression were also induced by hypoxia, as was binding to purified spike protein. Hypoxia-induced increase in ACE2 expression in type II AEC may provide an explanation of the extended temporal course of human patients who develop ARDS in COVID-19.
© 2021 The Authors. Physiological Reports published by Wiley Periodicals LLC on behalf of The Physiological Society and the American Physiological Society.
Conflict of interest statement
The authors have no conflicts to declare related to this work. In activities unrelated to the current work, RP serves as a consultant to Partner Therapeutics.
Figures
Similar articles
-
Comparative analysis of ACE2 protein expression in rodent, non-human primate, and human respiratory tract at baseline and after injury: A conundrum for COVID-19 pathogenesis.PLoS One. 2021 Feb 24;16(2):e0247510. doi: 10.1371/journal.pone.0247510. eCollection 2021. PLoS One. 2021. PMID: 33626084 Free PMC article.
-
Increased Angiotensin-Converting Enzyme 2 and Loss of Alveolar Type II Cells in COVID-19-related Acute Respiratory Distress Syndrome.Am J Respir Crit Care Med. 2021 Nov 1;204(9):1024-1034. doi: 10.1164/rccm.202012-4461OC. Am J Respir Crit Care Med. 2021. PMID: 34449302 Free PMC article.
-
Overexpression of the SARS-CoV-2 receptor ACE2 is induced by cigarette smoke in bronchial and alveolar epithelia.J Pathol. 2021 Jan;253(1):17-30. doi: 10.1002/path.5555. Epub 2020 Oct 27. J Pathol. 2021. PMID: 32991738 Free PMC article.
-
Angiotensin-Converting Enzyme 2 (ACE2) in the Pathogenesis of ARDS in COVID-19.Front Immunol. 2021 Dec 22;12:732690. doi: 10.3389/fimmu.2021.732690. eCollection 2021. Front Immunol. 2021. PMID: 35003058 Free PMC article. Review.
-
Potential detrimental role of soluble ACE2 in severe COVID-19 comorbid patients.Rev Med Virol. 2021 Sep;31(5):1-12. doi: 10.1002/rmv.2213. Epub 2021 Jan 10. Rev Med Virol. 2021. PMID: 33426683 Free PMC article. Review.
Cited by
-
Type 2 alveolar epithelial cell-derived circulating extracellular vesicle-encapsulated surfactant protein C as a mediator of cardiac inflammation in COVID-19.Inflamm Res. 2022 Sep;71(9):1003-1009. doi: 10.1007/s00011-022-01612-z. Epub 2022 Jul 31. Inflamm Res. 2022. PMID: 35909187 Free PMC article.
-
Exposure to sulfur mustard increases the risk for mortality in patients with COVID-19 infection: A cohort study.Am J Emerg Med. 2022 Jan;51:144-149. doi: 10.1016/j.ajem.2021.09.053. Epub 2021 Sep 25. Am J Emerg Med. 2022. PMID: 34739867 Free PMC article.
-
CRISPR-Cas9 genetic screens reveal regulation of TMPRSS2 by the Elongin BC-VHL complex.Sci Rep. 2025 Apr 7;15(1):11907. doi: 10.1038/s41598-025-95644-0. Sci Rep. 2025. PMID: 40195420 Free PMC article.
-
Serum ACE2 Level is Associated With Severe SARS-CoV-2 Infection: A Cross-Sectional Observational Study.Biomark Insights. 2022 Sep 21;17:11772719221125123. doi: 10.1177/11772719221125123. eCollection 2022. Biomark Insights. 2022. PMID: 36156891 Free PMC article.
-
The Renin-Angiotensin System as a Component of Biotrauma in Acute Respiratory Distress Syndrome.Front Physiol. 2022 Apr 13;12:806062. doi: 10.3389/fphys.2021.806062. eCollection 2021. Front Physiol. 2022. PMID: 35498160 Free PMC article. Review.
References
-
- Aguiar, J. A. , Tremblay, B. J. , Mansfield, M. J. , Woody, O. , Lobb, B. , Banerjee, A. , Chandiramohan, A. , Tiessen, N. , Cao, Q. , Dvorkin‐Gheva, A. , Revill, S. , Miller, M. S. , Carlsten, C. , Organ, L. , Joseph, C. , John, A. , Hanson, P. , Austin, R. C. , McManus, B. M. , … Hirota, J. A. (2020). Gene expression and in situ protein profiling of candidate SARS‐CoV‐2 receptors in human airway epithelial cells and lung tissue. European Respiratory Journal, 56. - PMC - PubMed
-
- Crapo, J. D. , Young, S. L. , Fram, E. K. , Pinkerton, K. E. , Barry, B. E. , & Crapo, R. O. (1983). Morphometric characteristics of cells in the alveolar region of mammalian lungs. American Review of Respiratory Disease, 128, S42–46. - PubMed
-
- Dinnon, K. H. , Leist, S. R. , Schafer, A. , Edwards, C. E. , Martinez, D. R. , Montgomery, S. A. , West, A. , Yount, B. L. Jr , Hou, Y. J. , Adams, L. E. , Gully, K. L. , Brown, A. J. , Huang, E. , Bryant, M. D. , Choong, I. C. , Glenn, J. S. , Gralinski, L. E. , Sheahan, T. P. , & Baric, R. S. (2020). A mouse‐adapted model of SARS‐CoV‐2 to test COVID‐19 countermeasures. Nature, 586, 560–566. - PMC - PubMed
-
- Hoffmann, M. , Kleine‐Weber, H. , Schroeder, S. , Kruger, N. , Herrler, T. , Erichsen, S. , Schiergens, T. S. , Herrler, G. , Wu, N. H. , Nitsche, A. , Muller, M. A. , Drosten, C. , & Pohlmann, S. (2020). SARS‐CoV‐2 Cell Entry Depends on ACE2 and TMPRSS2 and Is Blocked by a Clinically Proven Protease Inhibitor. Cell, 181(271–280), e8. - PMC - PubMed
Publication types
MeSH terms
Substances
Grants and funding
LinkOut - more resources
Full Text Sources
Other Literature Sources
Medical
Miscellaneous
