. 2021 Jun 24;184(13):3426-3437.e8.
doi: 10.1016/j.cell.2021.04.025. Epub 2021 Apr 20.

Transmission, infectivity, and neutralization of a spike L452R SARS-CoV-2 variant

Affiliations

Transmission, infectivity, and neutralization of a spike L452R SARS-CoV-2 variant

Xianding Deng et al. Cell. .

Abstract

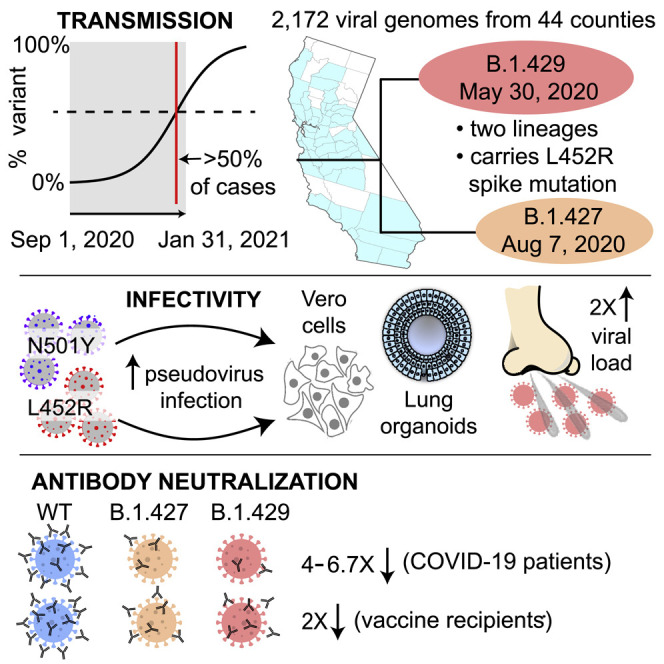
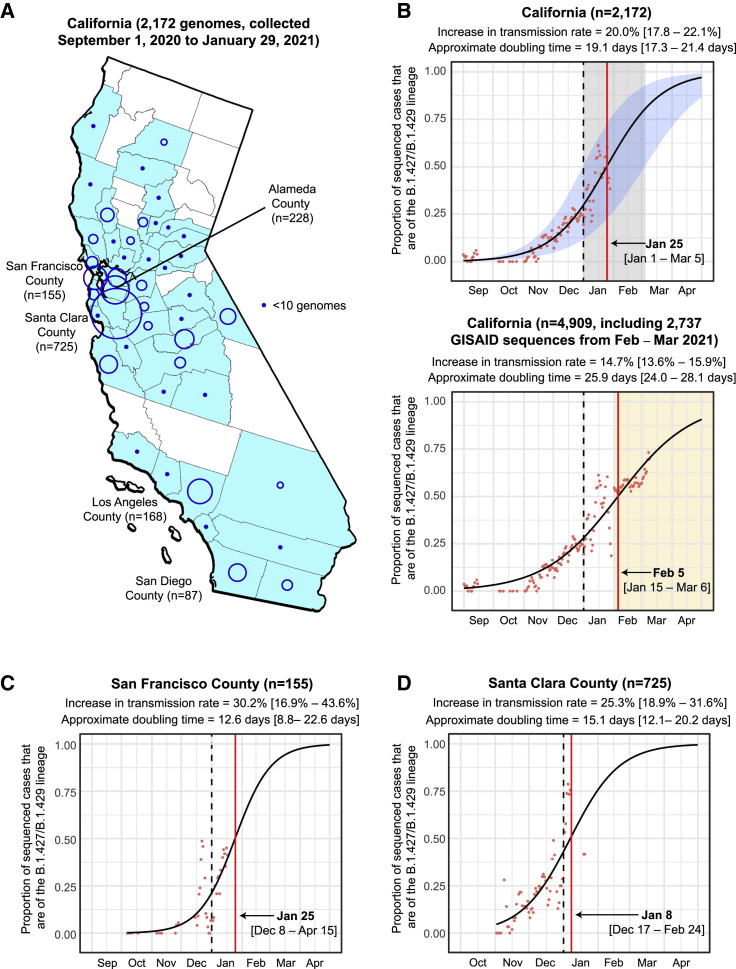
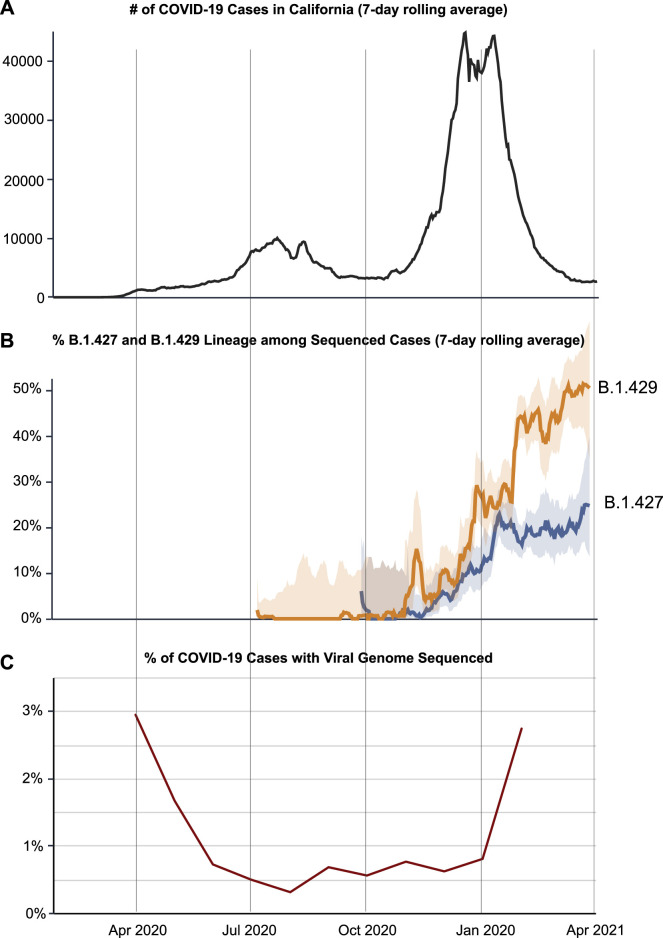
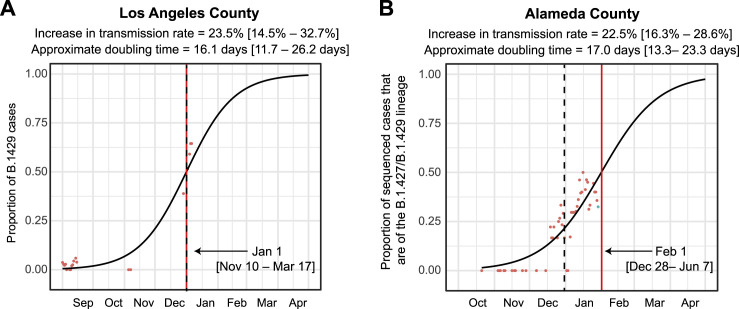
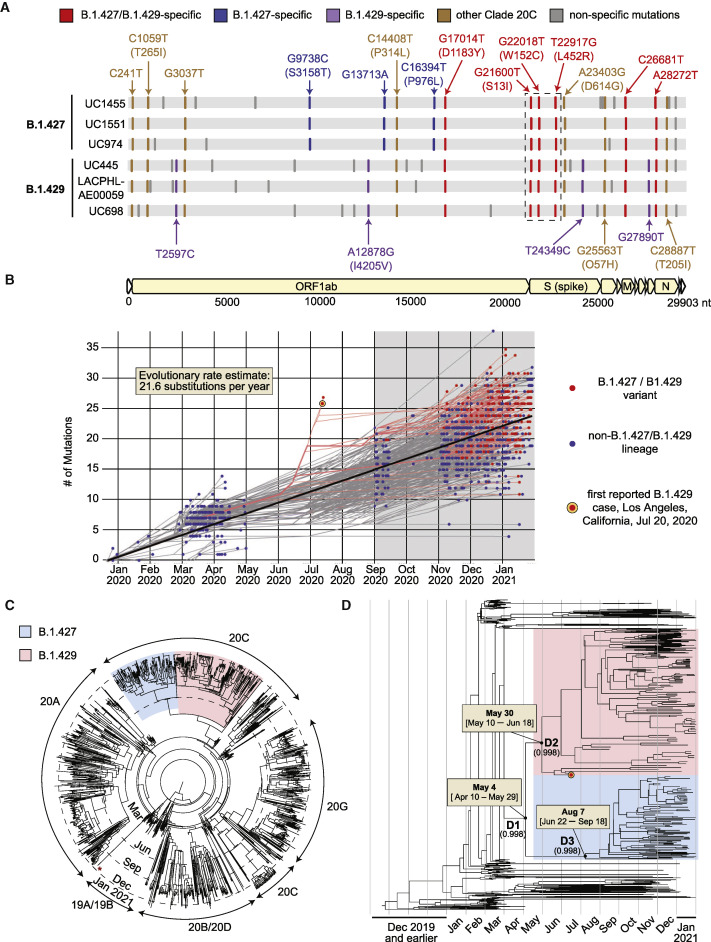
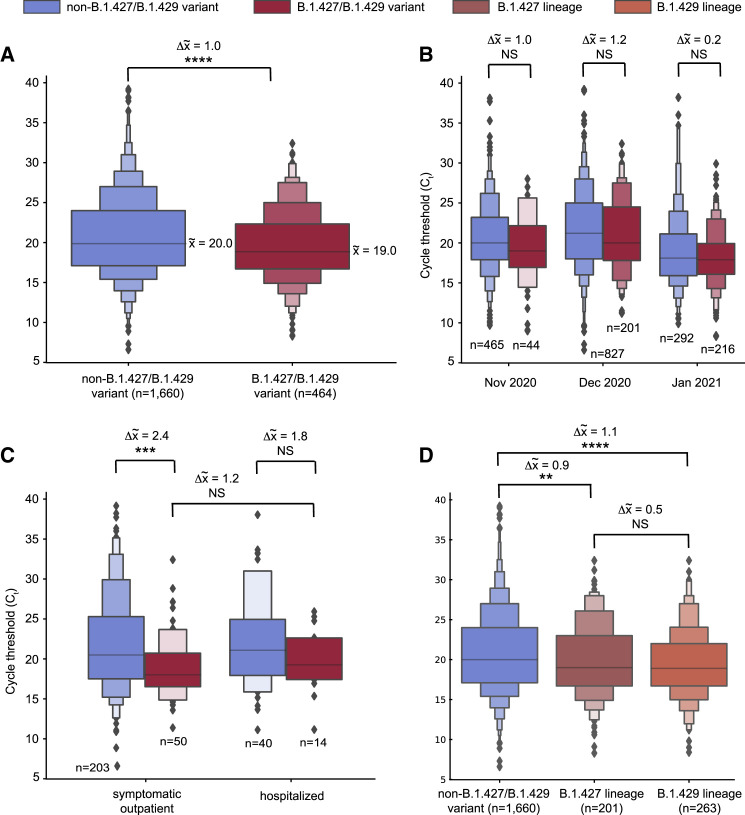
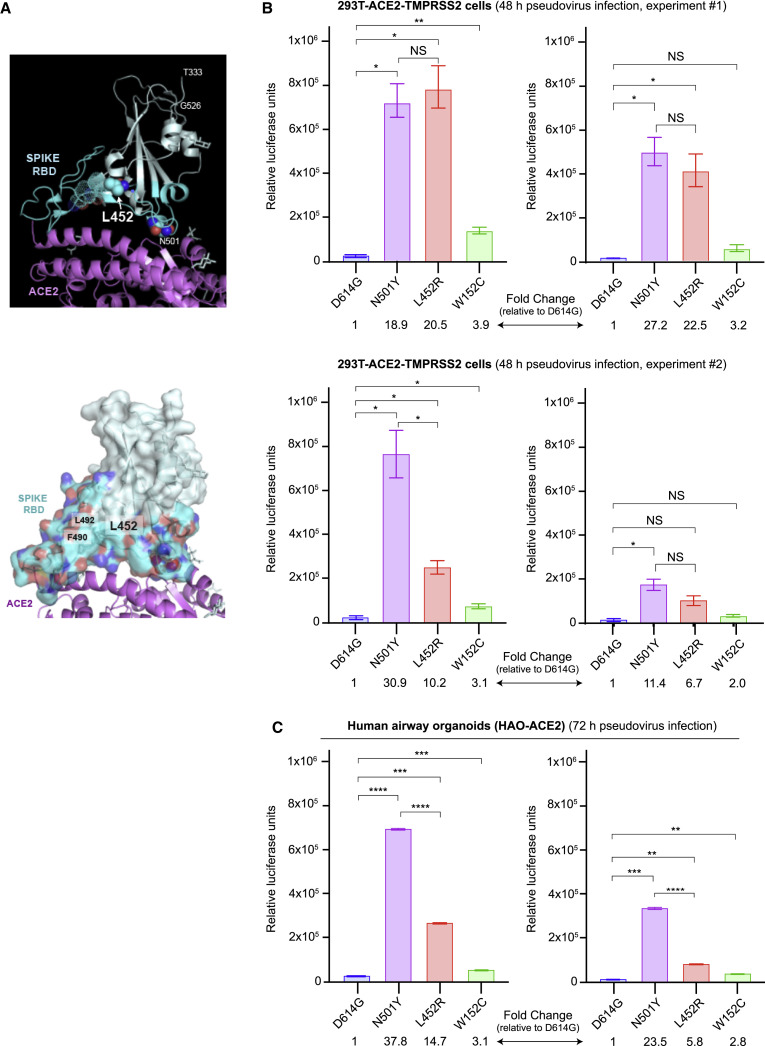
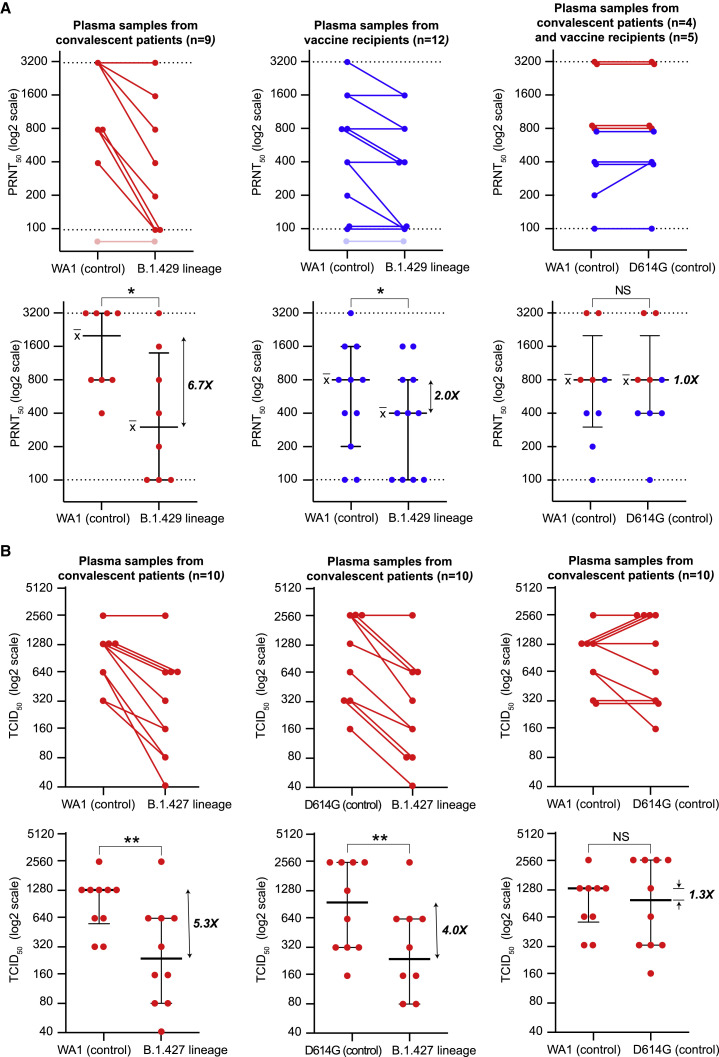
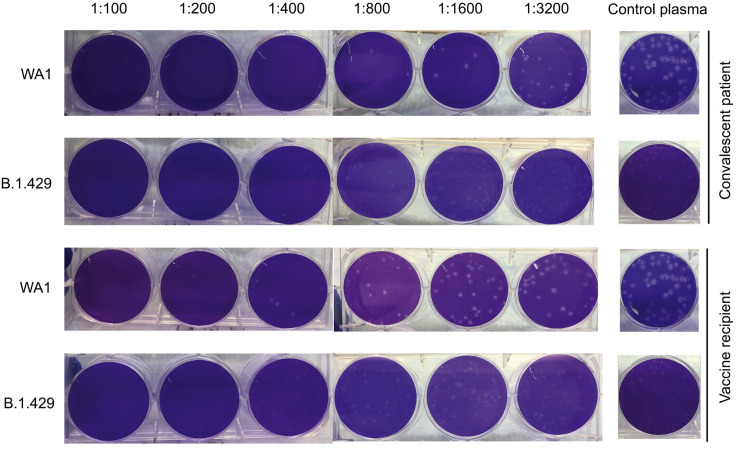
We identified an emerging severe acute respiratory syndrome coronavirus 2 (SARS-CoV-2) variant by viral whole-genome sequencing of 2,172 nasal/nasopharyngeal swab samples from 44 counties in California, a state in the western United States. Named B.1.427/B.1.429 to denote its two lineages, the variant emerged in May 2020 and increased from 0% to >50% of sequenced cases from September 2020 to January 2021, showing 18.6%-24% increased transmissibility relative to wild-type circulating strains. The variant carries three mutations in the spike protein, including an L452R substitution. We found 2-fold increased B.1.427/B.1.429 viral shedding in vivo and increased L452R pseudovirus infection of cell cultures and lung organoids, albeit decreased relative to pseudoviruses carrying the N501Y mutation common to variants B.1.1.7, B.1.351, and P.1. Antibody neutralization assays revealed 4.0- to 6.7-fold and 2.0-fold decreases in neutralizing titers from convalescent patients and vaccine recipients, respectively. The increased prevalence of a more transmissible variant in California exhibiting decreased antibody neutralization warrants further investigation.

Keywords: 20C/L452R; B.1.427/B.1.429; COVID-19; L452R mutation; SARS-CoV-2; antibody neutralization; genomic epidemiology; molecular dating; pseudovirus infectivity studies; spike protein; variant of concern; viral whole-genome sequencing.


Conflict of interest statement

Declaration of interests C.Y.C. receives support for SARS-CoV-2 research unrelated to this study from Abbott Laboratories and Mammoth Biosciences. The other authors declare no competing interests.

Figures

None
Graphical abstract
Figure 1
Figure 1
Increasing frequency of the B.1.427/B.1.429 variant in California from September 1, 2020 to January 29, 2021 (A) County-level representation of the 2,172 newly sequenced SARS-CoV-2 genomes in the current study. Counties from which at least 1 genome were sequenced are colored in sky blue. The size of the circle is proportionate to the number of genomes sequenced from each county, while points designate counties where fewer than 10 genomes were sequenced. (B–D) Logistic growth curves fitting the 5-day rolling average of the estimated proportion of B.1.427/B.1.429 variant cases in (B) California, (C) San Francisco County, and (D) Santa Clara County. For each curve, the estimated increase in transmission rate and doubling time are shown, along with their associated 95% confidence intervals. The predicted time when the growth curve crosses 0.5 is indicated by a vertical red line. A vertical black dotted line denotes the transition from 2020 to 2021. (B) Top: the logistic growth curve generated from all 2,172 genomes in the current study. The 95% confidence intervals for the increase in transmission rate and doubling time are shaded in blue and gray, respectively. (B) Bottom: the logistic growth curve with inclusion of an additional 2,737 sequenced genomes from California collected February 1 to March 11, 2021. The increase in transmission rate is defined as the logistic growth rate multiplied by the serial interval (Volz et al., 2020; Washington et al., 2021). See also Figures S1 and S2 and Tables S1, S2, and S5.
Figure S1
Figure S1
COVID-19 cases, frequency of the B.1.427/B.1.429 variant, and percentage of sequenced cases in California from April 1, 2020 to April 1, 2021, related to Figure 1 (A) Plot showing the reported COVID-19 cases in California. (B) Plot showing the 784 frequency of sequenced cases corresponding to the B.1.427 or B.1.429 variant. (C) Plot 785 showing the % of COVID-19 cases for which the viral genome is sequenced.
Figure S2
Figure S2
Increasing frequency of the B.1.427/B.1.429 variant in Los Angeles County and Alameda County from September 2020 to January 2021, related to Figure 1 Logistic growth curves fitting the 5-day rolling average of the estimated proportion of B.1.427/B.1.429 variant cases in Los Angeles County (A) and Alameda County (B). A vertical black dotted line is used to denote the transition from 2020 to 2021.
Figure 2
Figure 2
Genomic, phylogenetic, and molecular clock analyses of the B.1.427/B.1.429 variant in California (A) A multiple sequence alignment of 6 representative B.1.427/B.1.429 genomes, 3 from the B.1.427 lineage, and 3 from the B.1.429 lineage, using the prototypical Wuhan Hu-1 genome as a reference. Defining single nucleotide polymorphisms (SNPs) in the B.1.427 and B.1.429 lineages are compared to each other and to other SARS-CoV-2 viruses in Nextstrain clade 20C. The SNPs are color coded as follows: red SNPs are shared between the B.1.427 and B.1.429 lineages, blue SNPs are specific to B.1.427, purple SNPs are specific to B.1.429, brown SNPs are shared with other clade 20C viruses, and gray SNPs are specific to individual viruses. (B) Root-to-tip divergence plot of number of accumulated mutations by month based on 1,153 genomes subsampled from a complete dataset consisting of the 2,172 genomes recovered in the current study and 347 representative global genomes. The gray highlighted region encompasses the period of sampling for nearly all genomes sequenced in the current study (September 1, 2020 to January 31, 2021), with the exception of the first 2 sequenced B.1.429 genomes from Los Angeles that were reported on July 20, 2020. The orange-red bullseye denotes the first reported genomic sequence of the B.1.429 variant from Los Angeles County from a sample collected July 13, 2020. (C) Maximum likelihood circular phylogenetic tree of the 1,153 subsampled genomes, denoting the major viral clades. The red asterisk denotes a UK B.1.1.7 variant genome. (D) Time scaled maximum clade credibility (MCC) tree, showing the median divergence dates and associated 95% highest posterior density (HPD) distributions, or confidence intervals, for the B.1.427/B.1.429 variant (D1), B.1.429 lineage (D2), and B.1.427 lineage (D3), as estimated from TMRCA (time to most recent common ancestor) calculations. The B.1.427 lineage is colored in blue and the B.1.429 lineage in red. The orange-red bullseye denotes the first reported genomic sequence of the B.1.429 variant from Los Angeles County from a sample collected July 13, 2020. See also Tables S1 and S5.
Figure 3
Figure 3
Higher viral loads in infections from the B.1.427/B.1.429 variant as compared to non-B.1.427/B.1.429 variant lineages (A–D) Boxen plots of available PCR cycle threshold (Ct) values for B.1.427/B.1.429 variant compared to non-variant identification for (A) all samples sequenced in the current study, (B) samples stratified by month of collection, November 2020–January 2021, (C) samples from hospitalized patients and outpatients at a single tertiary care medical center (University of California, San Francisco), and (D) samples with viruses of B.1.427 or B.1.429 lineage. Note that a Ct difference of 1 represents a 2-fold difference in the virus concentration (Drew et al., 2020). The solid horizontal line in the center box denotes the mean value. ∗∗∗∗p < 0.0001; ∗∗∗p < 0.001; ∗∗p < 0.01; p < 0.05; NS, non-significant. Welch's t-test was used to determine significance. See also Table S1.
Figure 4
Figure 4
Increased infectivity of L452R-carrying pseudoviruses (A) Upper panel: ribbon diagram of the SARS-CoV-2 spike RBD in cyan bound to ACE2 receptor in magenta (PDB: 6M0J). The receptor-binding motif of RBD is colored in dark cyan with L452 in solid spheres and F490 and L492 with dotted spheres. Sugars and Zn2+ are shown in gray. The position of N501 in direct contact with the ACE2 receptor is also shown for purposes of comparison. Lower panel: surface representation of the spike RBD showing the hydrophobic patch outlined by L452, F490, and L492. (B) Levels of infection of SARS-CoV-2 spike pseudoviruses carrying D614G alone or D614G with N501Y, L452R, or W152C mutations in 293T cells stably expressing ACE2 and TMPRSS2. 293T cells were seeded in 96-well plates and infected with high (6 ng, left) or low (3 ng, right) concentrations of the indicated pseudoviruses for 48 h. Two biological replicates were assessed in two independent experiments, with 3 technical replicates per experiment. (C) Levels of infection in human lung airway organoids (HAO) stably expressing ACE2. HAO were seeded in 24-well plates and infected with high (4 ng, left) or low (2 ng, right) concentrations of the indicated pseudoviruses for 72 h. Pseudovirus cell entry was measured with a luciferase assay. The error bars represent the SD of 3 technical replicates. Dunn’s multiple comparisons test was used to determine significance. Note that each of the N501Y, L452R, and W152G pseudoviruses also carries D614G. NS, not significant.
Figure 5
Figure 5
B.1.427/B.1.429 variant resistance to antibody neutralization in vitro (A) Antibody neutralization titers from 9 convalescent patients and 12 vaccine recipients against cultured WA1 (control), D614G (control), and B.1.429 viral isolates were assessed using a PRNT assay. Lines connect the individual plasma samples tested pairwise for neutralization (top row). Only a subset of the plasma samples were tested with the WA1 and D614G head-to-head comparisons (top row, right). The dotted lines denote the upper and lower bounds for the PRNT assay (1:100 to 1:3,200). Plasma samples that did not exhibit detectable neutralizing activity at titers above the lower threshold are shown as transparent. Individual PRNT50 measurements are plotted along with error bars denoting the median and SD (bottom row). (B) Antibody neutralization titers from 10 convalescent patients against cultured WA1 (control), D614G (control), and B.1.427 viral isolates were assessed by 50% CPE endpoint dilution. Lines connect the individual plasma samples tested pairwise for neutralization (top row). Individual TCID50 measurements are plotted along with error bars denoting the median and SD (bottom row). A Wilcoxon matched pairs signed-rank test was used to determine significance. NS, not significant; PRNT, plaque-reduction neutralization test; CPE, cytopathic effect; TCID, tissue culture infective dose. See also Figure S3 and Table S3.
Figure S3
Figure S3
Differential neutralization of WA1 and B.1.429 viruses as measured by plaque-reduction neutralization tests, related to Figure 5 Representative 6-well plates arranged in one line showing viral plaques formed after co-culture with plasma samples from a convalescent patient and vaccine recipient. The same negative control well image is shown in line with the respective viral strain for both vaccine and convalescent samples. The plaques from B.1.429 lineage virus are observed to be small and lighter than those from control WA1 virus. The larger plaques for WA1 are likely due to adaptation in Vero E6 cells; these adaptation mutations have been reported not to impact neutralization responses (Klimstra et al., 2020).

Update of

Similar articles

Cited by

References

    1. Avanzato V.A., Matson M.J., Seifert S.N., Pryce R., Williamson B.N., Anzick S.L., Barbian K., Judson S.D., Fischer E.R., Martens C., et al. Case Study: Prolonged Infectious SARS-CoV-2 Shedding from an Asymptomatic Immunocompromised Individual with Cancer. Cell. 2020;183:1901–1912. - PMC - PubMed
    1. Bedford T., Neher R. 2020. A Getting Started Guide to the Genomic Epidemiology of SARS-CoV-2. Nextstrain.org.https://nextstrain.github.io/ncov/
    1. Bedford T., Hodcroft E.B., Neher R.A. 2021. Updated Nextstrain SARS CoV-2 clade naming strategy.http://nextstrain.org/blog/2021-01-06-updated-SARS-CoV-2-clade-naming
    1. Bouckaert R., Vaughan T.G., Barido-Sottani J., Duchêne S., Fourment M., Gavryushkina A., Heled J., Jones G., Kühnert D., De Maio N., et al. BEAST 2.5: An advanced software platform for Bayesian evolutionary analysis. PLoS Comput. Biol. 2019;15:e1006650. - PMC - PubMed
    1. Bushnell B. 2021. BBMap short read aligner, and other bioinformatic tools.https://sourceforge.net/projects/bbmap/

Publication types

MeSH terms