. 2021 May 25;35(8):109164.
doi: 10.1016/j.celrep.2021.109164. Epub 2021 May 6.

Epitope profiling reveals binding signatures of SARS-CoV-2 immune response in natural infection and cross-reactivity with endemic human CoVs

Affiliations

Epitope profiling reveals binding signatures of SARS-CoV-2 immune response in natural infection and cross-reactivity with endemic human CoVs

Caitlin I Stoddard et al. Cell Rep. .

Abstract

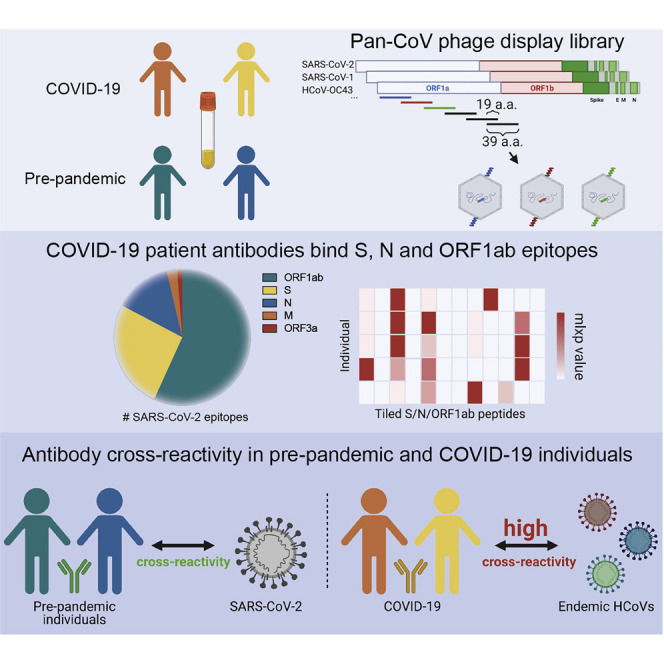
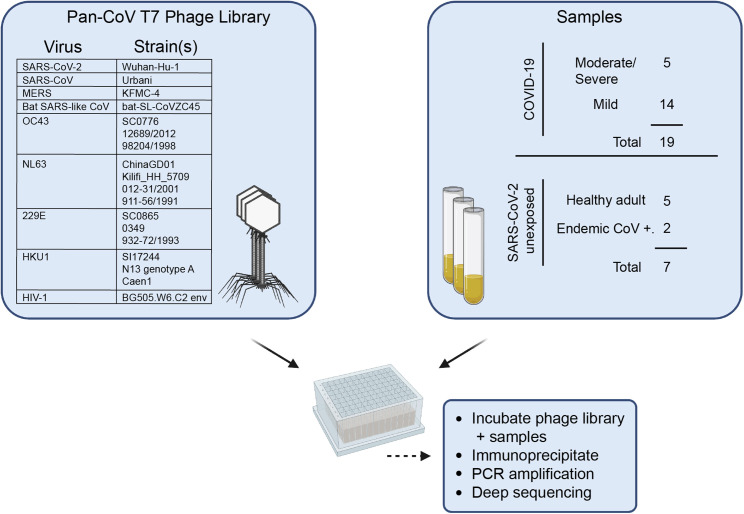
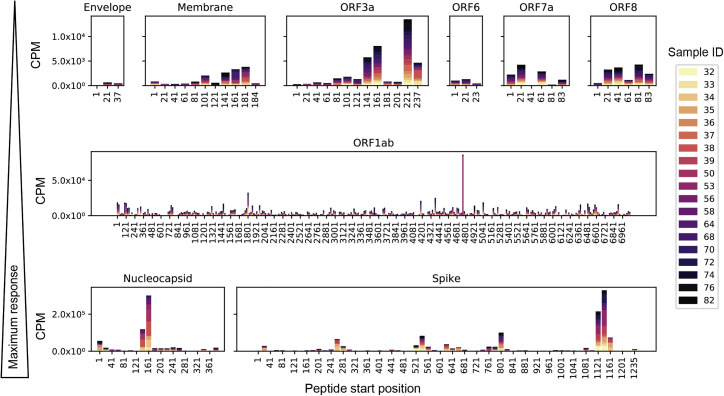
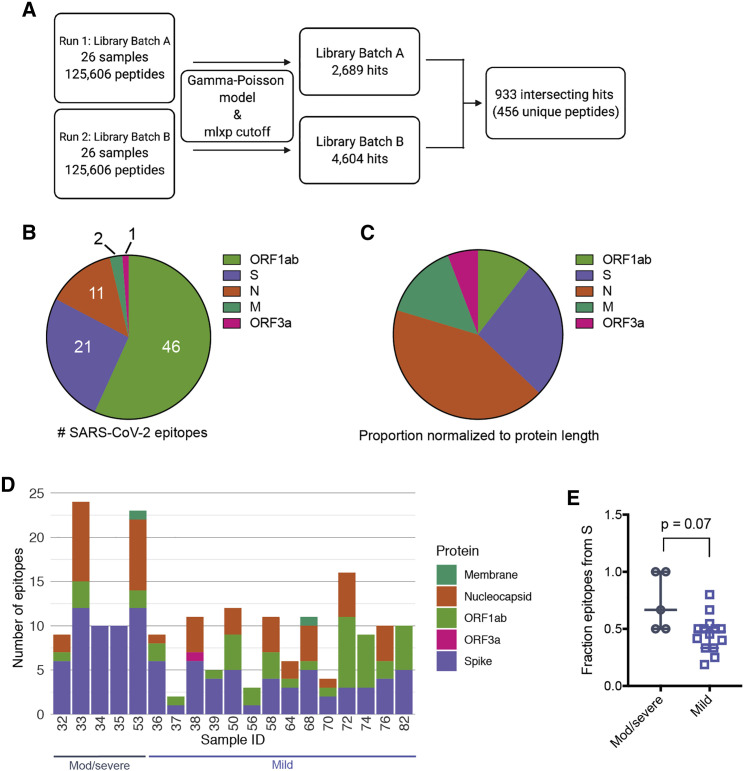
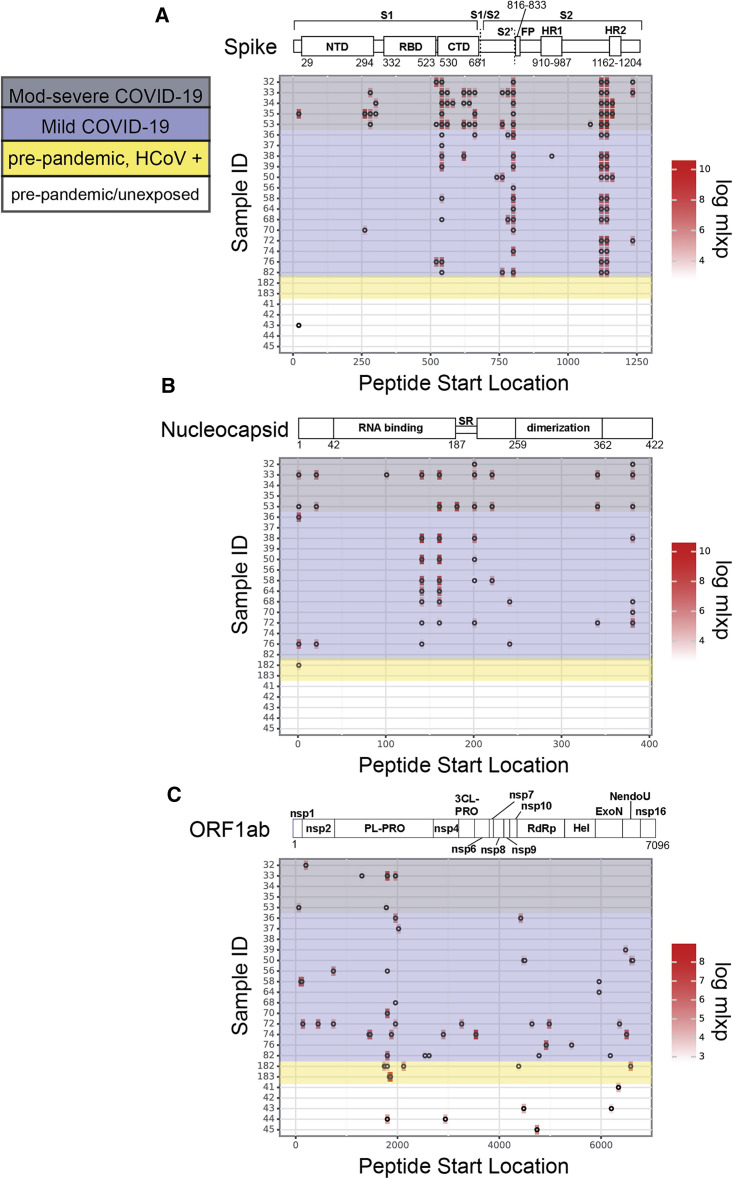
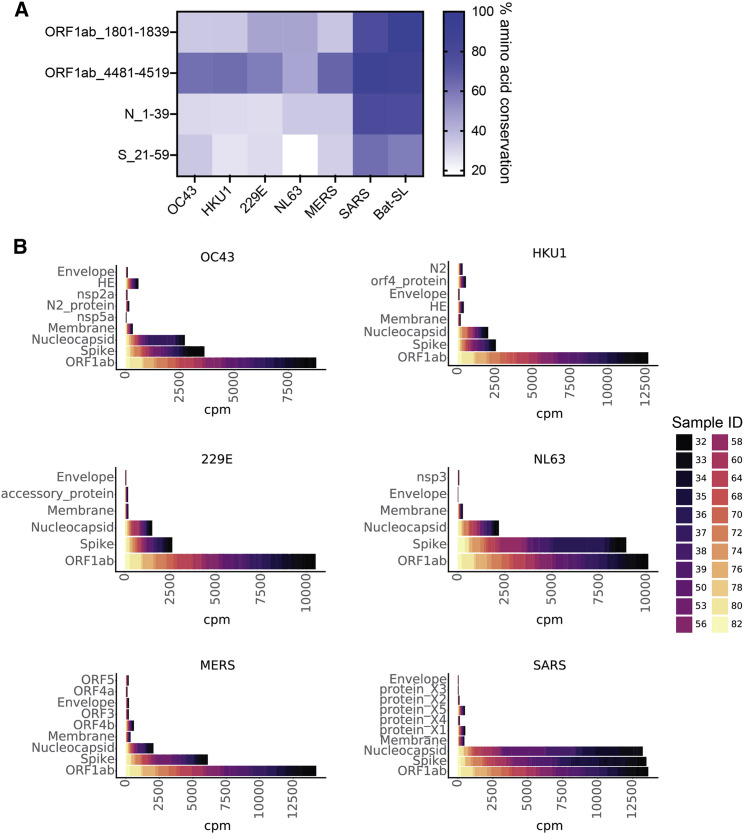
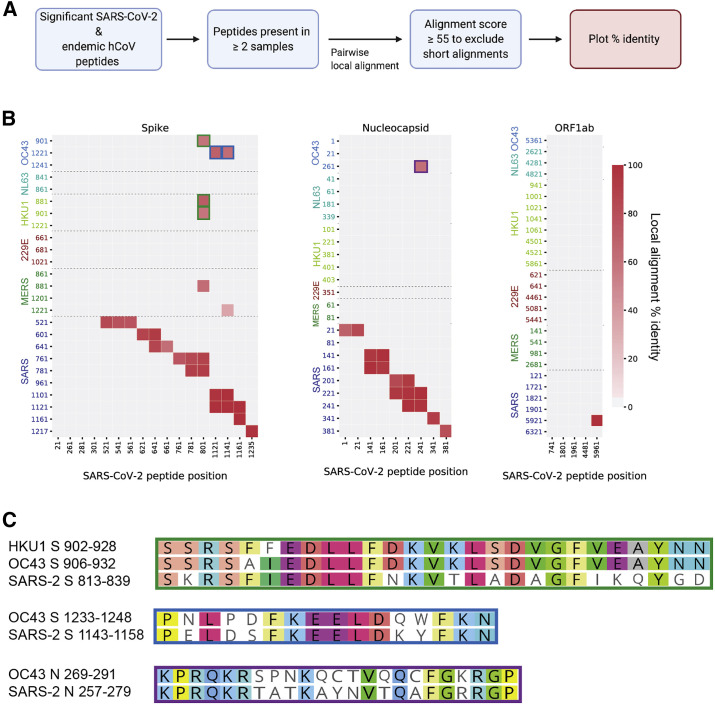
A major goal of current severe acute respiratory syndrome coronavirus 2 (SARS-CoV-2) vaccine efforts is to elicit antibody responses that confer protection. Mapping the epitope targets of the SARS-CoV-2 antibody response is critical for vaccine design, diagnostics, and development of therapeutics. Here, we develop a pan-coronavirus phage display library to map antibody binding sites at high resolution within the complete viral proteomes of all known human-infecting coronaviruses in patients with mild or moderate/severe coronavirus disease 2019 (COVID-19). We find that the majority of immune responses to SARS-CoV-2 are targeted to the spike protein, nucleocapsid, and ORF1ab and include sites of mutation in current variants of concern. Some epitopes are identified in the majority of samples, while others are rare, and we find variation in the number of epitopes targeted between individuals. We find low levels of SARS-CoV-2 cross-reactivity in individuals with no exposure to the virus and significant cross-reactivity with endemic human coronaviruses (CoVs) in convalescent sera from patients with COVID-19.

Keywords: COVID-19; SARS-CoV-2; cross-reactivity; epitopes; phage-display; serology; variants.


Conflict of interest statement

Declaration of interests The authors declare no competing interests.

Figures

None
Graphical abstract
Figure 1
Figure 1
Summary of development of the pan-CoV T7 phage library and sample screening Left panel: virus species and strains that comprise the pan-CoV phage library used in the study are listed. Right panel: summary of samples from COVID-19- or SARS-CoV-2-unexposed patients. The pan-CoV phage library and samples were combined in a plate-based immunoprecipitation assay, and phage DNA was isolated for downstream sequencing and analysis. Additional sample information can be found in Tables 1 and S1.
Figure 2
Figure 2
SARS-CoV-2 peptide enrichment based on raw counts per million (CPM) Individual panels showing enrichment among all COVID-19 patient samples for peptides along the lengths of nine SARS-CoV-2 ORFs. Panel rows are in order of increasing maximum response from top to bottom. Note the scales also increase in each row, indicating higher enrichment of the identified peptides. Bars are segmented by color for each sample included in the analysis, as depicted in the legend.
Figure 3
Figure 3
Results from global fit of all sample-peptide pairs with applied mlxp cutoff (A) Data-processing scheme. Samples were tested with two separate phage libraries (library 1 and library 2; Figure S1). Peptide enrichment was scored using a gamma-Poisson model, and data were curated using a cutoff corresponding to FPR 0.05 (Figure S1). (B) Proportion of SARS-CoV-2 epitopes derived from individual proteins in all patient samples tested. Numbers indicate the total enriched SARS-CoV-2 epitopes from each ORF. (C) Proportions in (B) normalized with respect to polypeptide length. (D) Epitope counts across COVID-19 patient samples for SARS-CoV-2 only. Bars are further sectioned by SARS-CoV-2 ORF, indicated to the right. (E) Fraction of total epitopes arising from the S protein, calculated for moderate/severe and mild samples (number of S epitopes/number of total epitopes). p value was calculated using a two-tailed unpaired Welch’s t test (n = 5, moderate/severe COVID-19, n = 14 mild COVID-19; bars represent median and interquartile range).
Figure 4
Figure 4
SARS-CoV-2 epitope profiles for dominant antigens (A–C) Location of significantly enriched epitopes across the S protein (A), N (B), and ORF1ab (C). Profiles for patients with COVID-19 are highlighted in gray (moderate/severe COVID-19) and purple (mild COVID-19). The remaining profiles are from SARS-CoV-2-unexposed individuals with confirmed endemic HCoV exposure (yellow) or healthy individuals (colorless). Log(mlxp) values are indicated by the red gradient, shown to the right of the maps. Protein domain architecture for each antigen is above the heatmap, with amino acid positions indicated.
Figure 5
Figure 5
SARS-CoV-2 cross-reactivity in two populations, SARS-CoV-2 unexposed and COVID-19 (A) Four SARS-CoV-2 epitopes that were reactive in unexposed/pre-pandemic individuals are shown on the vertical axis. The heatmap displays the percentage of amino acid conservation after local alignment with representative strains of the other circulating CoVs in the pan-CoV phage library. (B) Stacked bar plots showing CPM (cpm) for peptides from each of the viral proteins on the y axis for each of the six non-SARS-CoV-2 HCoVs in the phage library. Colors represent individual samples, as indicated by the legend on the right. Representative endemic HCoV strains used in (A) and (B) are OC43_SC0776, HKU1_Caen1, 229E_SC0865, and NL63_ChinaGD01. Protein names on y axes are identical to GenBank entries for each viral protein (see STAR Methods).
Figure 6
Figure 6
Homology among significant HCoV/SARS-CoV-2 sequence pairs in individuals with COVID-19 (A) Unique peptide hits from all CoVs that were present in two or more COVID-19 patient samples were subjected to Smith-Waterman local alignment. Sequences that were 100% identical between SARS-CoV-2 and the other CoVs were not included in the analysis. (B) Peptide pairs with alignment scores >55 (Figure S5) were plotted to show percent identity. Peptide start positions from SARS-CoV-2 are listed on the x axis, and peptide start positions from the other human-infecting CoVs are listed on the y axis. Green, blue, and purple outlines match with the corresponding peptides pairs shown in (C). (C) Local sequence alignments for the high-scoring peptide pairs in (B).

Similar articles

Cited by

References

    1. Amrun S.N., Lee C.Y.-P., Lee B., Fong S.-W., Young B.E., Chee R.S.-L., Yeo N.K.-W., Torres-Ruesta A., Carissimo G., Poh C.M. Linear B-cell epitopes in the spike and nucleocapsid proteins as markers of SARS-CoV-2 exposure and disease severity. EBioMedicine. 2020;58:102911. - PMC - PubMed
    1. Anders S., Huber W. Differential expression analysis for sequence count data. Genome Biol. 2010;11:R106–R112. - PMC - PubMed
    1. Arvin A.M., Fink K., Schmid M.A., Cathcart A., Spreafico R., Havenar-Daughton C., Lanzavecchia A., Corti D., Virgin H.W. A perspective on potential antibody-dependent enhancement of SARS-CoV-2. Nature. 2020;584:353–363. - PubMed
    1. Atyeo C., Fischinger S., Zohar T., Slein M.D., Burke J., Loos C., McCulloch D.J., Newman K.L., Wolf C., Yu J. Distinct Early Serological Signatures Track with SARS-CoV-2 Survival. Immunity. 2020;53:524–532.e4. - PMC - PubMed
    1. Chan K.H., Cheng V.C.C., Woo P.C.Y., Lau S.K.P., Poon L.L.M., Guan Y., Seto W.H., Yuen K.Y., Peiris J.S.M. Serological responses in patients with severe acute respiratory syndrome coronavirus infection and cross-reactivity with human coronaviruses 229E, OC43, and NL63. Clin. Diagn. Lab. Immunol. 2005;12:1317–1321. - PMC - PubMed

Publication types

MeSH terms