

The relationship between dietary fat intake, impulsive choice, and metabolic health
- PMID: 33991645
- PMCID: PMC8206036
- DOI: 10.1016/j.appet.2021.105292
The relationship between dietary fat intake, impulsive choice, and metabolic health
Abstract
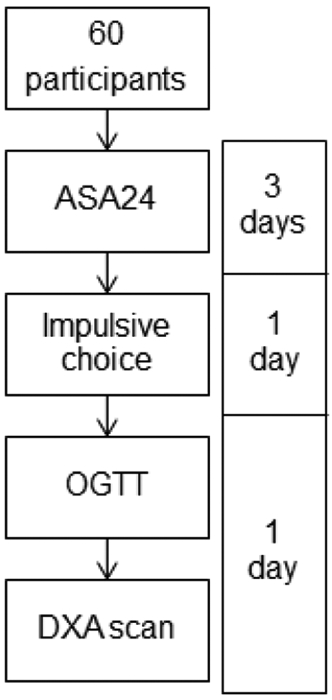
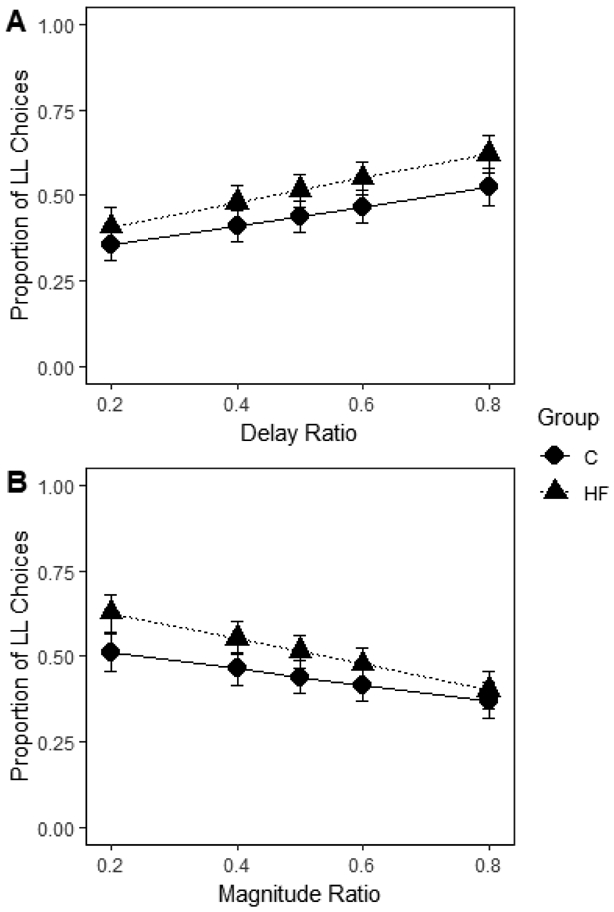
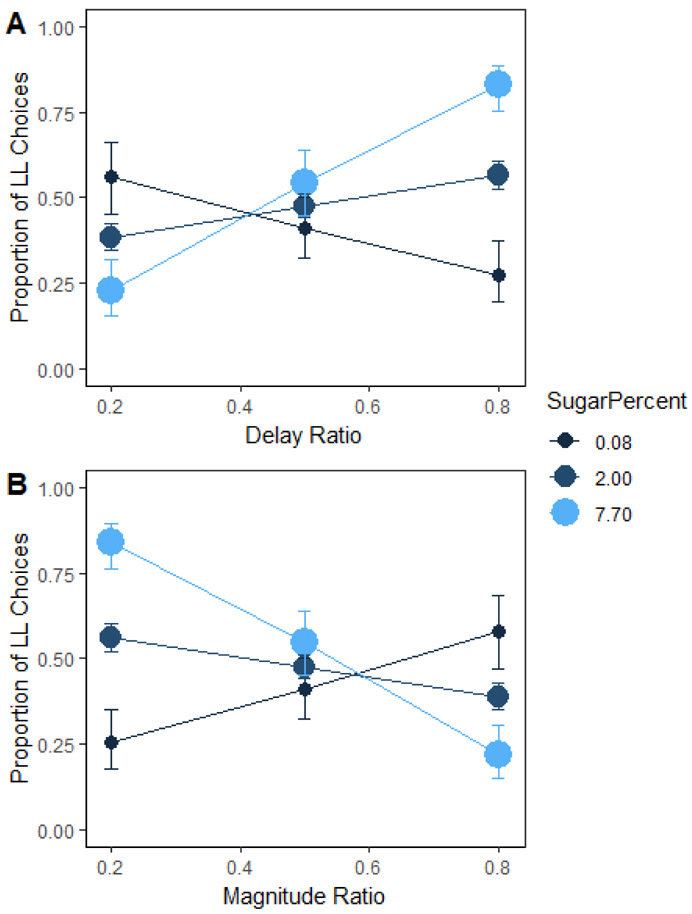
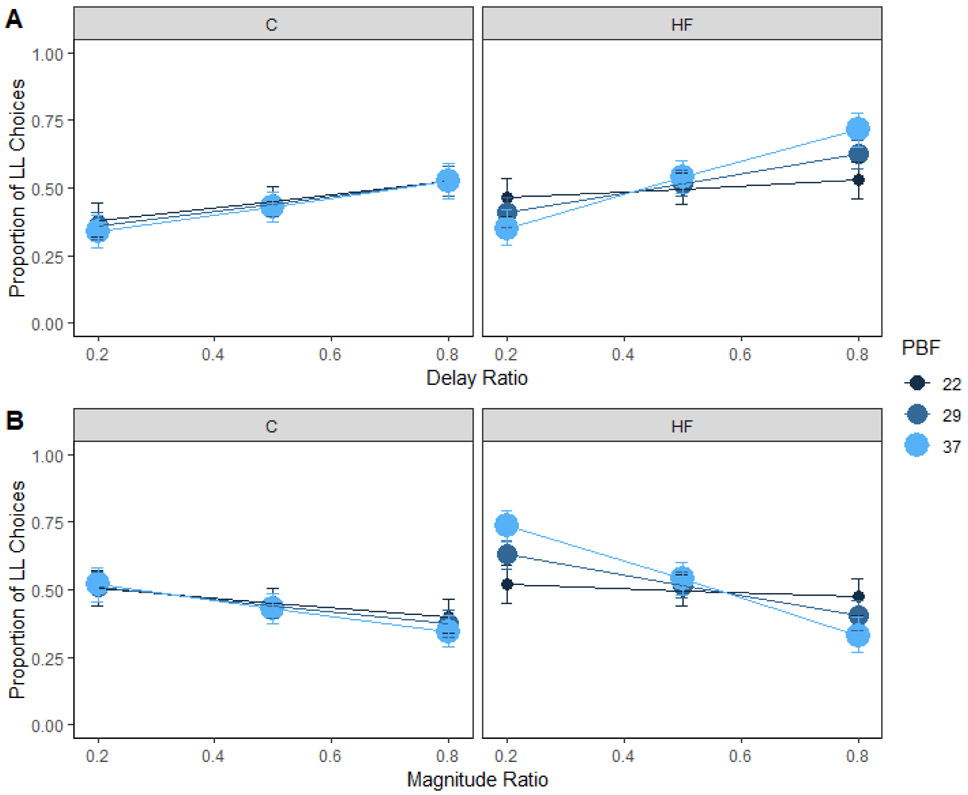
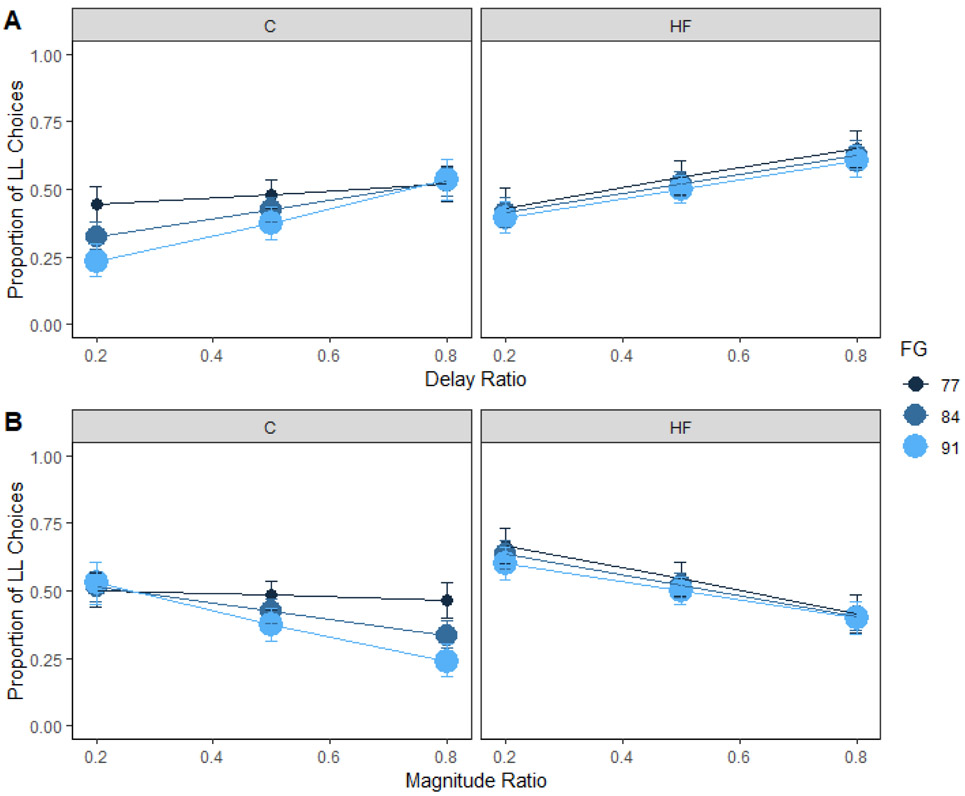
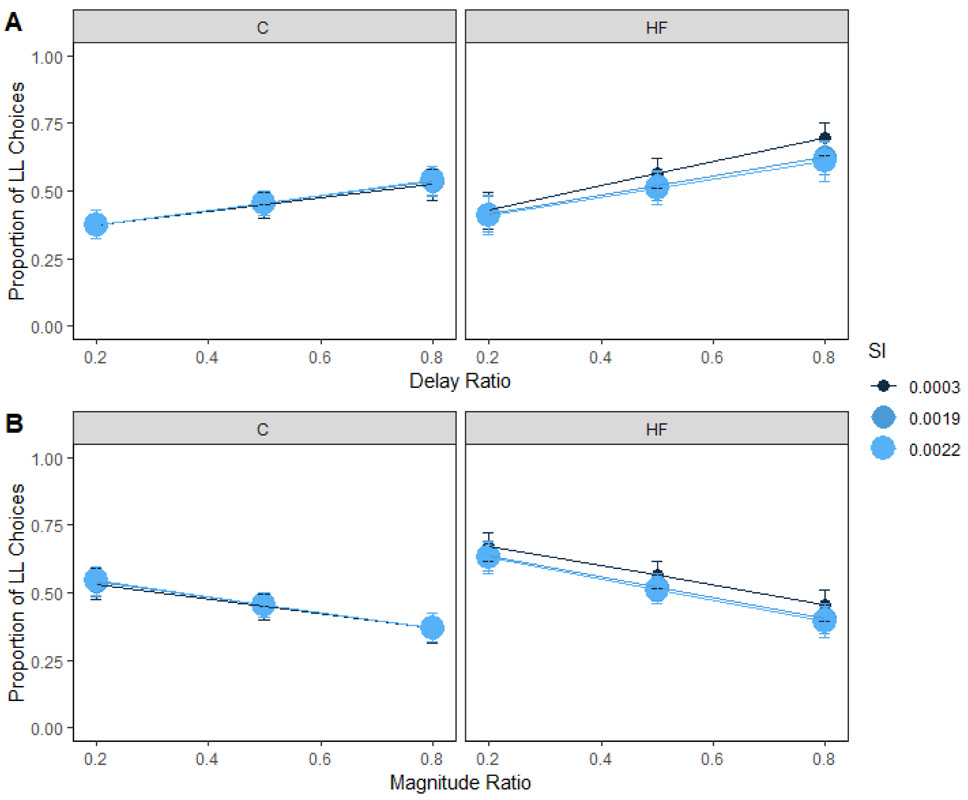
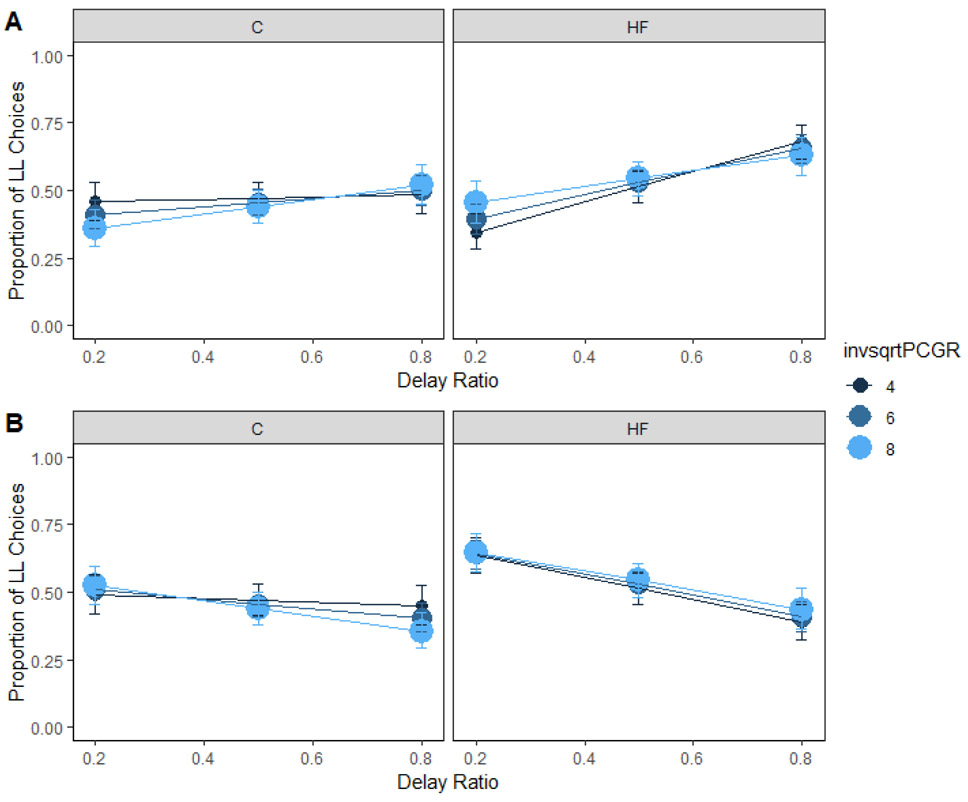
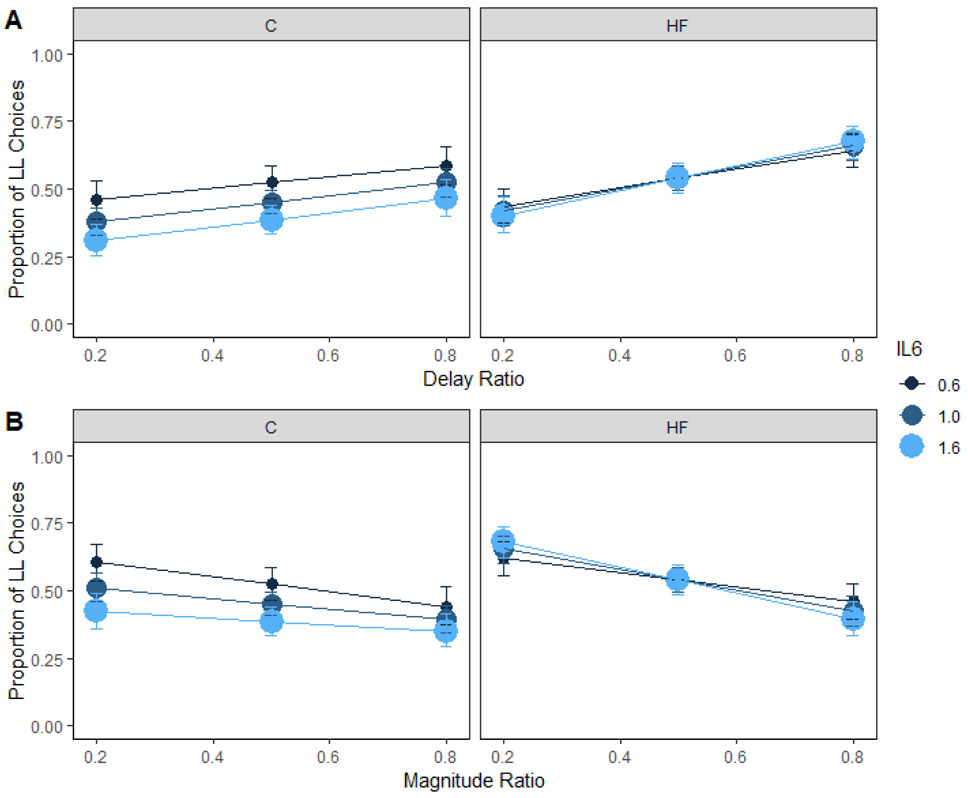
Unhealthful foods are convenient, ubiquitous, and inexpensive. Overconsumption of unhealthful foods can result in disease states such as obesity and Type 2 diabetes. In addition to the physiological consequences of unhealthful foods, research in rats has shown that diets high in processed fat and sugar induce impulsive choice behavior. Research in humans has demonstrated a link between metabolic health and impulsive choice, but most investigations have not included diet. We investigated how dietary fat intake interacts with body fat percentage, fasting glucose, insulin response, and systemic inflammation levels to predict impulsive choices in humans. Participants were split into either Control (<35% calories from fat) or High-Fat (≥40% calories from fat) groups based on self-reported dietary intake, completed an impulsive choice task, and underwent testing to determine their body fat, glucose, insulin response, and inflammation levels. High-fat diets were not predictive of impulsive choices, but added sugar was predictive. Body fat percentage was associated with impulsive choices only in the group who reported consuming high-fat diets. In addition, fasting glucose was associated with impulsive choices in the control group. Therefore, metabolic health and dietary fat intake interacted to predict impulsive choices. These findings indicate that knowledge of dietary patterns coupled with metabolic health markers may help us better understand impulsive choices, thereby improving our ability to target individuals who could benefit from interventions to reduce impulsive choice behavior, with the goal of promoting more self-controlled food choices.
Keywords: Body fat percentage; Diet; Glucose; Impulsive choice; Inflammation; Insulin response.
Copyright © 2021 Elsevier Ltd. All rights reserved.
Conflict of interest statement
Declarations of interest: none
Figures
Similar articles
-
Dietary effects on the determinants of food choice: Impulsive choice, discrimination, incentive motivation, preference, and liking in male rats.Appetite. 2019 May 1;136:160-172. doi: 10.1016/j.appet.2019.01.023. Epub 2019 Feb 2. Appetite. 2019. PMID: 30721744 Free PMC article.
-
Diet-induced impulsivity: Effects of a high-fat and a high-sugar diet on impulsive choice in rats.PLoS One. 2017 Jun 29;12(6):e0180510. doi: 10.1371/journal.pone.0180510. eCollection 2017. PLoS One. 2017. PMID: 28662133 Free PMC article.
-
Dietary fat consumption and health.Nutr Rev. 1998 May;56(5 Pt 2):S3-19; discussion S19-28. doi: 10.1111/j.1753-4887.1998.tb01728.x. Nutr Rev. 1998. PMID: 9624878 Review.
-
Low-Carbohydrate, High-Protein, High-Fat Diets Rich in Livestock, Poultry and Their Products Predict Impending Risk of Type 2 Diabetes in Chinese Individuals that Exceed Their Calculated Caloric Requirement.Nutrients. 2018 Jan 12;10(1):77. doi: 10.3390/nu10010077. Nutrients. 2018. PMID: 29329254 Free PMC article.
-
The Evidence for Saturated Fat and for Sugar Related to Coronary Heart Disease.Prog Cardiovasc Dis. 2016 Mar-Apr;58(5):464-72. doi: 10.1016/j.pcad.2015.11.006. Epub 2015 Nov 14. Prog Cardiovasc Dis. 2016. PMID: 26586275 Free PMC article. Review.
Cited by
-
Nutrition in Skin Picking Disorder and Trichotillomania.Front Psychiatry. 2021 Nov 23;12:761321. doi: 10.3389/fpsyt.2021.761321. eCollection 2021. Front Psychiatry. 2021. PMID: 34887788 Free PMC article.
-
Cortical and Subcortical Brain Volumes Partially Mediate the Association between Dietary Composition and Behavioral Disinhibition: A UK Biobank Study.Nutrients. 2021 Oct 9;13(10):3542. doi: 10.3390/nu13103542. Nutrients. 2021. PMID: 34684543 Free PMC article.
-
Are sick people really more impulsive?: Investigating inflammation-driven impulsivity.Psychoneuroendocrinology. 2022 Jul;141:105763. doi: 10.1016/j.psyneuen.2022.105763. Epub 2022 Apr 9. Psychoneuroendocrinology. 2022. PMID: 35429698 Free PMC article. Review.
-
Association of Impulsivity With Food, Nutrients, and Fitness in a Longitudinal Birth Cohort Study.Int J Neuropsychopharmacol. 2022 Dec 12;25(12):1014-1025. doi: 10.1093/ijnp/pyac052. Int J Neuropsychopharmacol. 2022. PMID: 35977538 Free PMC article.
-
High Endogenously Synthesized N-3 Polyunsaturated Fatty Acids in Fat-1 Mice Attenuate High-Fat Diet-Induced Insulin Resistance by Inhibiting NLRP3 Inflammasome Activation via Akt/GSK-3β/TXNIP Pathway.Molecules. 2022 Sep 27;27(19):6384. doi: 10.3390/molecules27196384. Molecules. 2022. PMID: 36234919 Free PMC article.
References
-
- 2015–2020 Dietary Guidelines for Americans. (2015). U.S. Department of Health and Human Services and U.S. Department of Agriculture, 8th Edition.
-
- Adab P, Pallan M, & Whincup PH (2018). Is BMI the best measure of obesity? BMJ, 360, 1–2. - PubMed
-
- Bates D, Kliegl R, Vasishth S, & Baayen H (2015). Parsimonious mixed models. arXiv preprint arXiv:1506.04967.
Publication types
MeSH terms
Substances
Grants and funding
LinkOut - more resources
Full Text Sources
Other Literature Sources
Medical
