

Myeloid cell-specific Irf5 deficiency stabilizes atherosclerotic plaques in Apoe-/- mice
- PMID: 33991749
- PMCID: PMC8178123
- DOI: 10.1016/j.molmet.2021.101250
Myeloid cell-specific Irf5 deficiency stabilizes atherosclerotic plaques in Apoe-/- mice
Abstract
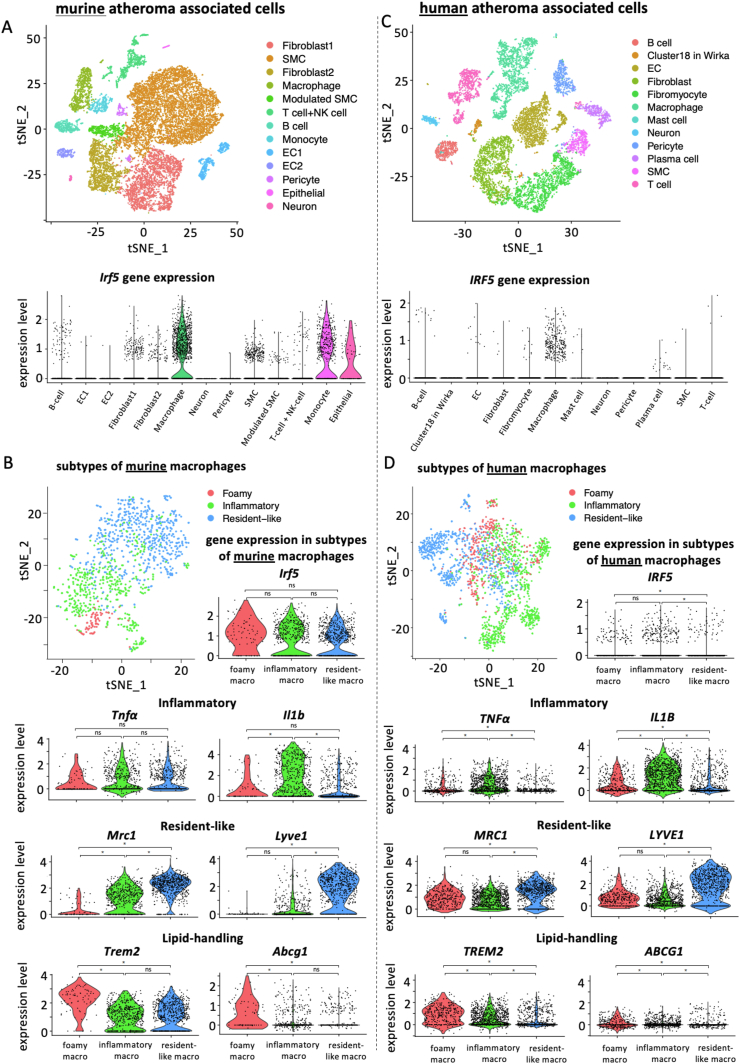
Objective: Interferon regulatory factor (IRF) 5 is a transcription factor known for promoting M1 type macrophage polarization in vitro. Given the central role of inflammatory macrophages in promoting atherosclerotic plaque progression, we hypothesize that myeloid cell-specific deletion of IRF5 is protective against atherosclerosis.
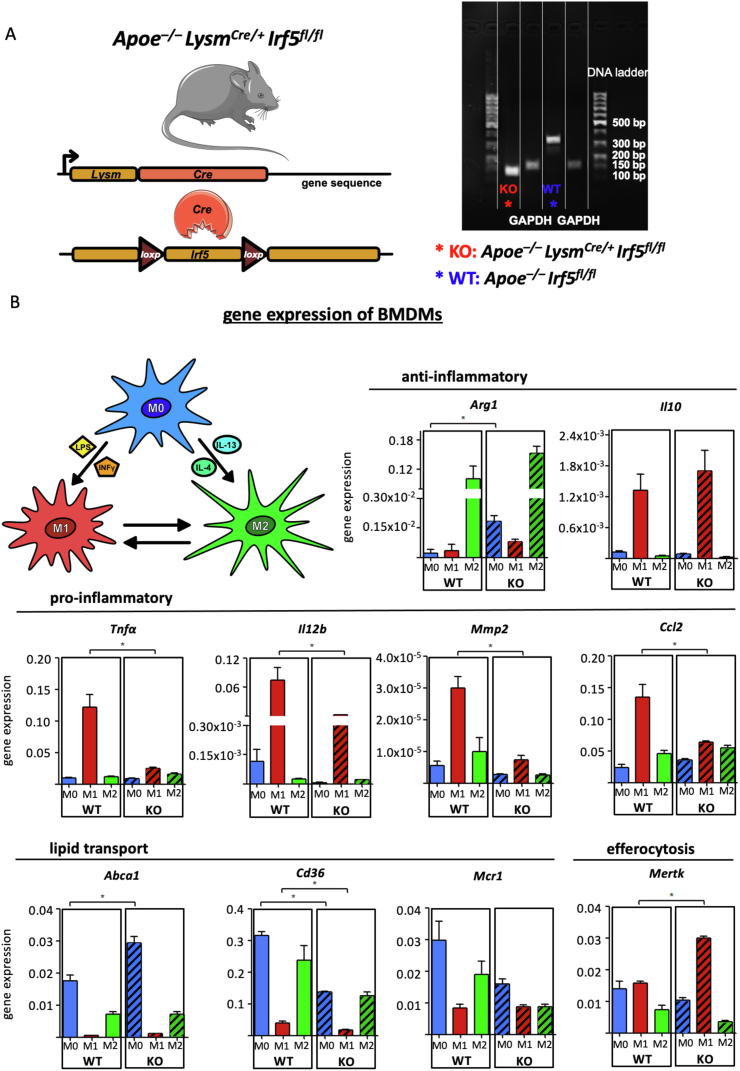
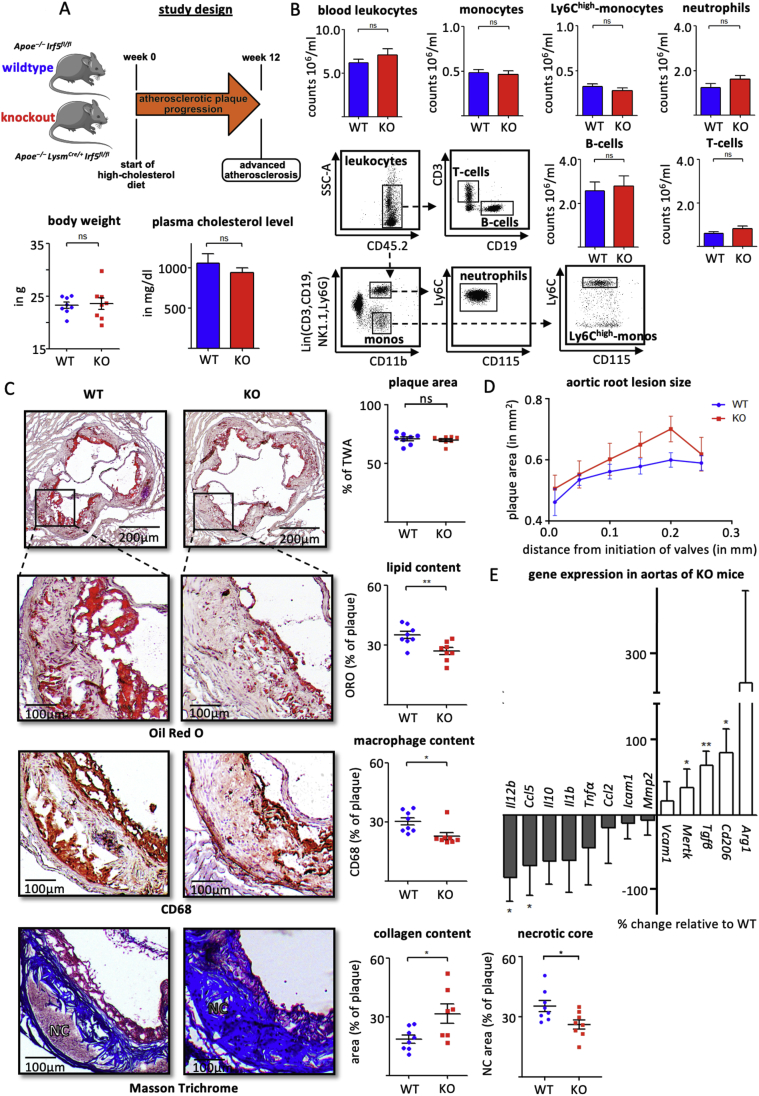
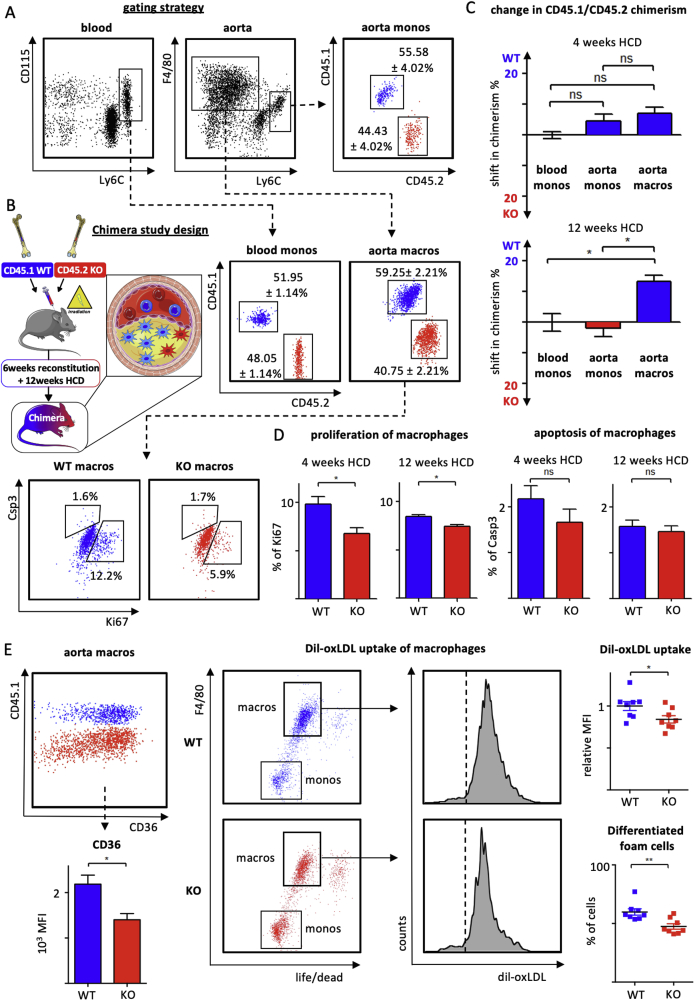
Methods: Female Apoe-/-LysmCre/+Irf5fl/fl and Apoe-/-Irf5fl/fl mice were fed a high-cholesterol diet for three months. Atherosclerotic plaque size and compositions as well as inflammatory gene expression were analyzed. Mechanistically, IRF5-dependent bone marrow-derived macrophage cytokine profiles were tested under M1 and M2 polarizing conditions. Mixed bone marrow chimeras were generated to determine intrinsic IRF5-dependent effects on macrophage accumulation in atherosclerotic plaques.
Results: Myeloid cell-specific Irf5 deficiency blunted LPS/IFNγ-induced inflammatory gene expression in vitro and in the atherosclerotic aorta in vivo. While atherosclerotic lesion size was not reduced in myeloid cell-specific Irf5-deficient Apoe-/- mice, plaque composition was favorably altered, resembling a stable plaque phenotype with reduced macrophage and lipid contents, reduced inflammatory gene expression and increased collagen deposition alongside elevated Mertk and Tgfβ expression. Irf5-deficient macrophages, when directly competing with wild type macrophages in the same mouse, were less prone to accumulate in atherosclerotic lesion, independent of monocyte recruitment. Irf5-deficient monocytes, when exposed to oxidized low density lipoprotein, were less likely to differentiate into macrophage foam cells, and Irf5-deficient macrophages proliferated less in the plaque.
Conclusion: Our study provides genetic evidence that selectively altering macrophage polarization induces a stable plaque phenotype in mice.
Keywords: Anti-inflammation; Aortic macrophages; Atherosclerosis; Interferon regulatory factor 5; Macrophage polarization (M1, M2); Plaque stabilization.
Copyright © 2021 The Authors. Published by Elsevier GmbH.. All rights reserved.
Figures
Similar articles
-
Interferon Regulatory Factor 5 Controls Necrotic Core Formation in Atherosclerotic Lesions by Impairing Efferocytosis.Circulation. 2017 Sep 19;136(12):1140-1154. doi: 10.1161/CIRCULATIONAHA.117.027844. Epub 2017 Jul 11. Circulation. 2017. PMID: 28698173 Free PMC article.
-
Interferon regulatory factor-5-dependent CD11c+ macrophages contribute to the formation of rupture-prone atherosclerotic plaques.Eur Heart J. 2022 May 14;43(19):1864-1877. doi: 10.1093/eurheartj/ehab920. Epub 2022 Feb 9. Eur Heart J. 2022. PMID: 35567557 Free PMC article.
-
CD147 Sparks Atherosclerosis by Driving M1 Phenotype and Impairing Efferocytosis.Circ Res. 2024 Jan 19;134(2):165-185. doi: 10.1161/CIRCRESAHA.123.323223. Epub 2024 Jan 3. Circ Res. 2024. PMID: 38166463
-
Macrophage profiling in atherosclerosis: understanding the unstable plaque.Basic Res Cardiol. 2024 Feb;119(1):35-56. doi: 10.1007/s00395-023-01023-z. Epub 2024 Jan 20. Basic Res Cardiol. 2024. PMID: 38244055 Review.
-
Diverse mechanisms of IRF5 action in inflammatory responses.Int J Biochem Cell Biol. 2018 Jun;99:38-42. doi: 10.1016/j.biocel.2018.03.012. Epub 2018 Mar 22. Int J Biochem Cell Biol. 2018. PMID: 29578052 Review.
Cited by
-
The multiple roles of interferon regulatory factor family in health and disease.Signal Transduct Target Ther. 2024 Oct 9;9(1):282. doi: 10.1038/s41392-024-01980-4. Signal Transduct Target Ther. 2024. PMID: 39384770 Free PMC article. Review.
-
Platelet Bone Morphogenetic Protein-4 Mediates Vascular Inflammation and Neointima Formation after Arterial Injury.Cells. 2021 Aug 8;10(8):2027. doi: 10.3390/cells10082027. Cells. 2021. PMID: 34440796 Free PMC article.
-
Functional diversity of cardiac macrophages in health and disease.Nat Rev Cardiol. 2025 Jun;22(6):431-442. doi: 10.1038/s41569-024-01109-8. Epub 2025 Jan 2. Nat Rev Cardiol. 2025. PMID: 39743564 Review.
-
Therapeutic strategies targeting inflammation and immunity in atherosclerosis: how to proceed?Nat Rev Cardiol. 2022 Aug;19(8):522-542. doi: 10.1038/s41569-021-00668-4. Epub 2022 Jan 31. Nat Rev Cardiol. 2022. PMID: 35102320 Free PMC article. Review.
-
IRF5 suppresses metastasis through the regulation of tumor-derived extracellular vesicles and pre-metastatic niche formation.Sci Rep. 2024 Jul 5;14(1):15557. doi: 10.1038/s41598-024-66168-w. Sci Rep. 2024. PMID: 38969706 Free PMC article.
References
Publication types
MeSH terms
Substances
Grants and funding
LinkOut - more resources
Full Text Sources
Other Literature Sources
Molecular Biology Databases
Miscellaneous
