. 2021 Jul:103:103130.
doi: 10.1016/j.dnarep.2021.103130. Epub 2021 May 9.

Effect of mismatch repair on the mutational footprint of the bacterial SOS mutator activity

Affiliations

Effect of mismatch repair on the mutational footprint of the bacterial SOS mutator activity

Elizabeth B Lewis et al. DNA Repair (Amst). 2021 Jul.

Abstract

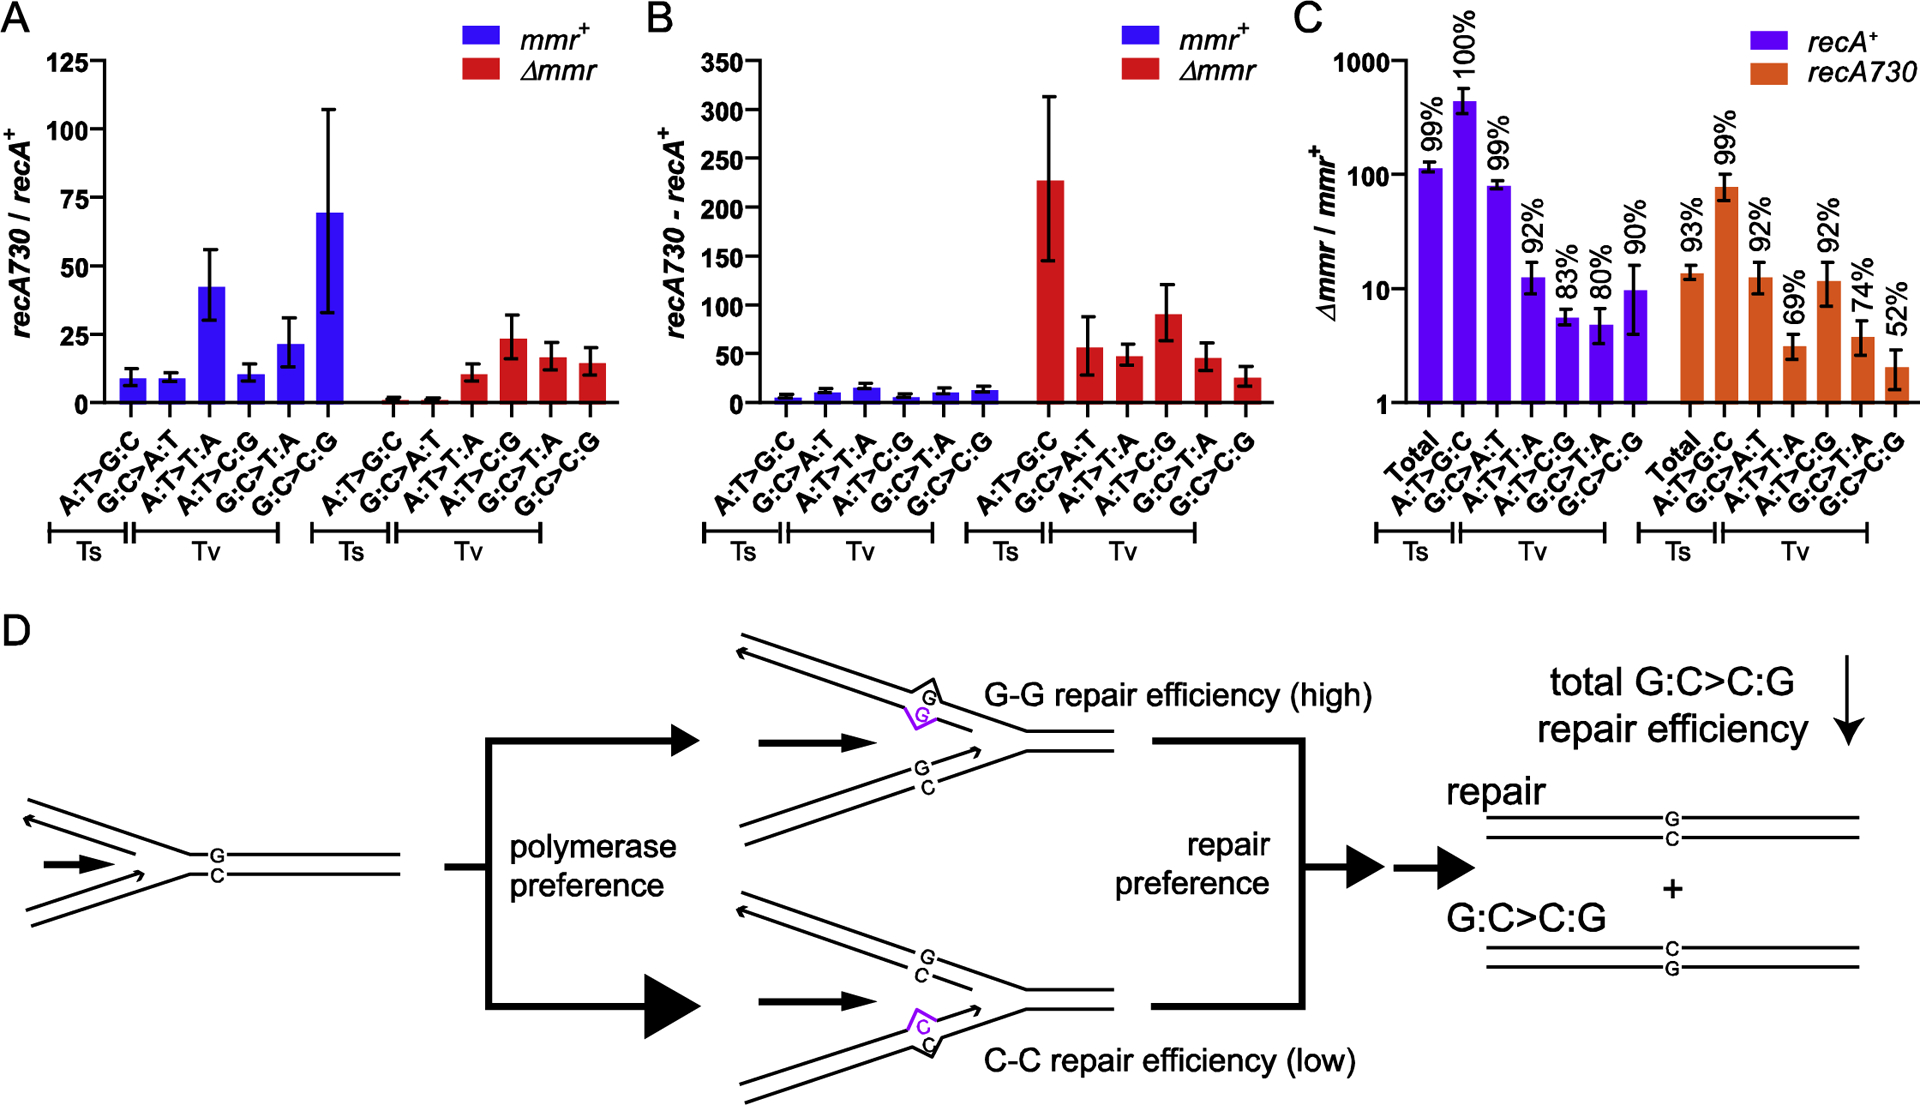
The bacterial SOS response to DNA damage induces an error-prone repair program that is mutagenic. In Escherichia coli, SOS-induced mutations are caused by the translesion synthesis (TLS) activity of two error-prone polymerases (EPPs), Pol IV and Pol V. The mutational footprint of the EPPs is confounded by both DNA damage and repair, as mutations are targeted to DNA lesions via TLS and corrected by the mismatch repair (MMR) system. To remove these factors and assess untargeted EPP mutations genome-wide, we constructed spontaneous SOS mutator strains deficient in MMR, then analyzed their mutational footprints by mutation accumulation and whole genome sequencing. Our analysis reveals new features of untargeted SOS-mutagenesis, showing how MMR alters its spectrum, sequence specificity, and strand-bias. Our data support a model where the EPPs prefer to act on the lagging strand of the replication fork, producing base pair mismatches that are differentially repaired by MMR depending on the type of mismatch.

Keywords: DNA polymerase IV; DNA polymerase V; Error-prone polymerases; Mismatch repair; Mutation accumulation whole genome sequencing; SOS response.


Figures

Fig 1.
Fig 1.. EPP and MMR preferences in SOS mutagenesis.
A. Mismatch formation. Pol IV and Pol V (EPP) prefer to (i) form specific mismatches during base misincorporation or (ii) extend specific terminal mismatches formed by Pol III. B. MMR. (i) The MutHLS complex prefers to initiate the MMR reaction sequence on specific substrates during mismatch recognition and nicking of the unmethylated DNA strand. This is followed by (ii) strand excision by exonuclease (Exo) and (iii) gap filling by the replicative polymerase (Pol III).
Fig 2.
Fig 2.. BPS rate and spectrum of the SOS mutator strains.
A. Strain names, activity profiles, genotypes, and BPS rates with color legend for panels B and C. a Published MA-WGS datasets [16]: WT is the combined result of eight experiments with strains displaying wild-type mutational phenotypes and M is the combined result of ten experiments with MMR deficient strains. Strains constructed for this study have shorthand names for relevant genotypes (R=recA730, M=Δmmr, D=ΔdinB, and U=ΔumuC). Pol IV/V: inactive (−) or active (+); MMR: deficient (−) or proficient (+). BPS rates and errors (BPS/generation/nt × 1010) are the means and 95% confidence limits (95% CL) of replicate lines and are normalized (per nucleotide) by the size of the genome (4,639,675 nt). B. Total BPS rates of strains. The WT and R strains are plotted on both scales for ease of comparison. Data bar fill patterns indicate the proportion of transitions (Ts) (no pattern) and transversions (Tv) (hashes). C. BPS rates by substitution subtype. Inset displays Tv subtypes on different scale for ease of comparison. Colors indicate different strains (see legend in panel A). Plotted data and error bars represent the mean and 95% confidence intervals of the conditional BPS rate (BPS/generations/nt × 1010) of replicate lines.
Fig 3.
Fig 3.. Effect of EPPs and MMR on BPS spectrum.
A. Fold-increase of BPS rate due to SOS mutator activity (recA730 / recA+) in mmr+ (blue) and Δmmr (red) background. B. Absolute BPS rate increase due to SOS mutator activity (recA730 - recA+) in mmr+ (blue) and Δmmr (red) background (BPS/generation/nt × 1010). C. MMR efficiency in recA+ (magenta) and recA730 (orange) background. Plotted values represent the fold effect of MMR (Δmmr / mmr+) and numbers above each bar express MMR efficiency as a percentage, where efficiency = 1- (mmr+ / Δmmr). Error bars represent 95% confidence intervals. Transition (Ts) and transversion (Tv) BPS subtypes are indicated. D. Model for the impact of EPP activity on MMR efficiency. Two different mismatches can lead to the same BPS subtype (G:C>C:G is shown as an example) and mismatches can be repaired with different efficiencies. If a polymerase prefers to form a low MMR efficiency mismatch, then the overall repair efficiency is lowered.
Fig 4.
Fig 4.. Triplet site specificity of the SOS mutator activity.
Plotted data and error bars represent the mean and 95% confidence intervals of the conditional BPS rate (BPS/generations/triplet × 1010) of replicate lines. BPS subtypes are indicated above each plot and grouped by transitions (Ts) and transversions (Tv). Data for the R strain (blue) are plotted above and separately from the RM (red) and RMUD (yellow) strains due to difference in scales. Triplets are written 5’ to 3’ with the target site in the center.
Fig 5.
Fig 5.. Strand-bias of the SOS mutator activity.
A. Replichore schematic. Replication forks proceed away from oriC, down the left (L) and right (R) replichores, then terminate at a series of ter sites (terC) on the opposite side of the chromosome. The top strand of the L replichore is a leading strand template (LDST) and the top strand of the R replichore is a lagging strand template (LGST). B. A:T>C:G strand-bias of the RM strain. The relative positions of A>C (blue) and T>G (red) base substitutions on the chromosome are indicated as vertical lines. C. Strain comparisons of strand-bias. The fraction of BPSs where purine is on the LGST (fLGSTpur) is plotted for each BPS subtype. BPS subtypes are indicated above each plot and grouped by transitions (Ts) and transversions (Tv). The vertical dotted line represents no strand-bias (fLGSTpur = 0.50 for A:T sites, fLGSTpur = 0.48 for G:C sites). Values to the right of the dotted line favor purine on the LGST; values to the left of the dotted line favor purine on the LDST. Grey box widths indicate the effect size of EPP activation (RM vs. M) and are shown only for statistically significant effects. Notations next to black arrows indicate the base substitution preference on the LGST associated with EPP activation. Turquoise box widths indicate the effect size of MMR activity (R vs. RM) and are shown only for statistically significant effects. Error bars represent the 95% CI. Fisher’s exact test was used to compute the two-sided P-value for strain comparisons (ns: P>0.05; *: P<0.05; **: P<0.01; ***: P<0.001). Values for strains with less than 20 BPS events (N<20) were not calculated due to lack of statistical power.

Similar articles

Cited by

References

    1. Friedberg EC, Walker GC, Siede W, DNA repair and mutagenesis, ASM Press, Washington, D.C., 1995.
    1. Tang M, Pham P, Shen X, Taylor JS, O’Donnell M, Woodgate R, Goodman MF, Roles of E. coli DNA polymerases IV and V in lesion-targeted and untargeted SOS mutagenesis, Nature, 404 (2000) 1014–1018. - PubMed
    1. Kobayashi S, Valentine MR, Pham P, O’Donnell M, Goodman MF, Fidelity of Escherichia coli DNA polymerase IV. Preferential generation of small deletion mutations by dNTP-stabilized misalignment, J Biol Chem, 277 (2002) 34198–34207. - PubMed
    1. Maor-Shoshani A, Reuven NB, Tomer G, Livneh Z, Highly mutagenic replication by DNA polymerase V (UmuC) provides a mechanistic basis for SOS untargeted mutagenesis, Proc Natl Acad Sci U S A, 97 (2000) 565–570. - PMC - PubMed
    1. Jarosz DF, Beuning PJ, Cohen SE, Walker GC, Y-family DNA polymerases in Escherichia coli, Trends in microbiology, 15 (2007) 70–77. - PubMed

Publication types

LinkOut - more resources