

Associations between private well water and community water supply arsenic concentrations in the conterminous United States
- PMID: 33991916
- PMCID: PMC8192485
- DOI: 10.1016/j.scitotenv.2021.147555
Associations between private well water and community water supply arsenic concentrations in the conterminous United States
Abstract
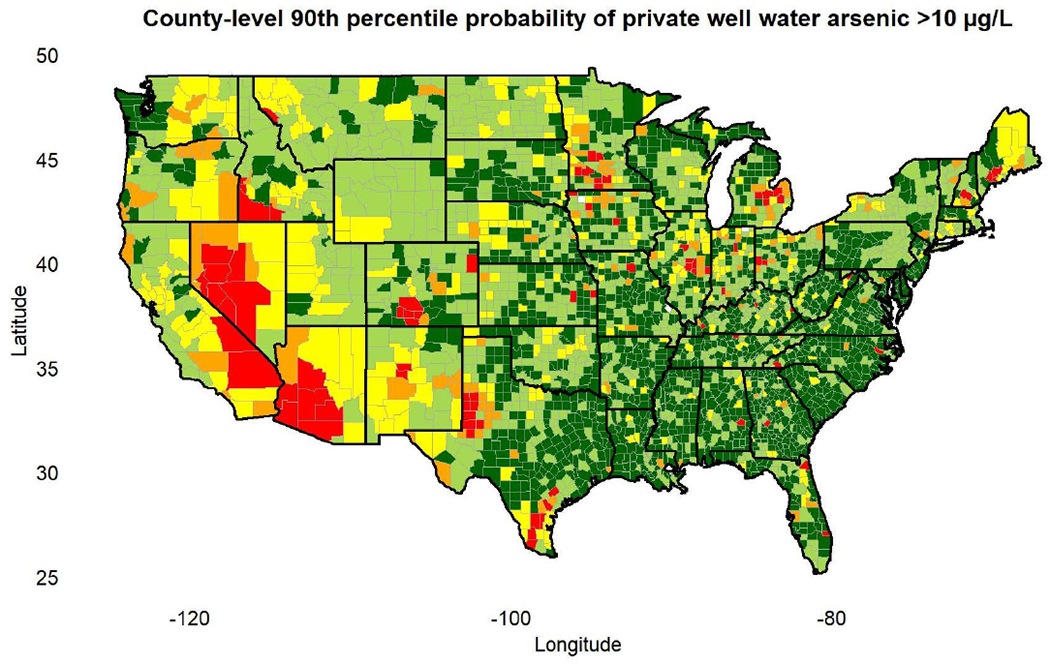
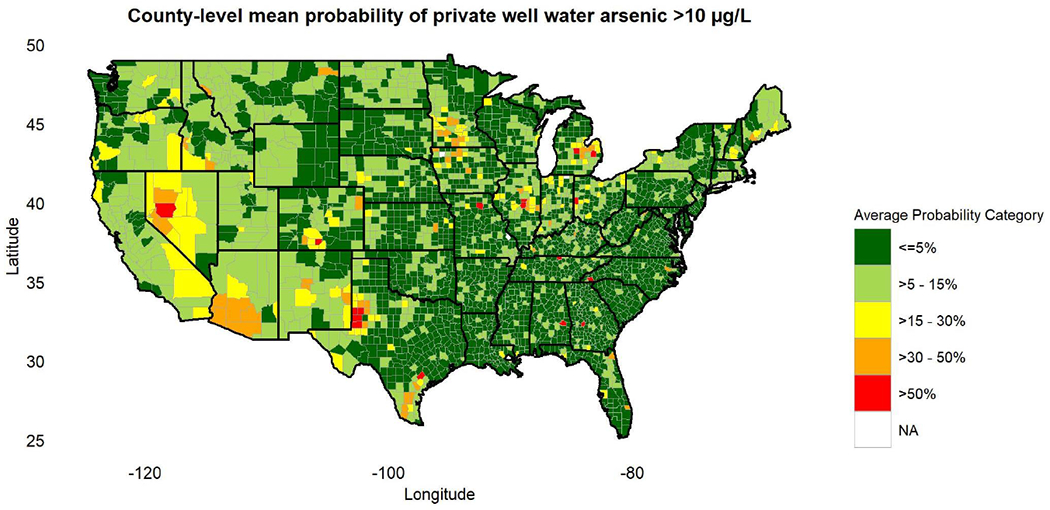
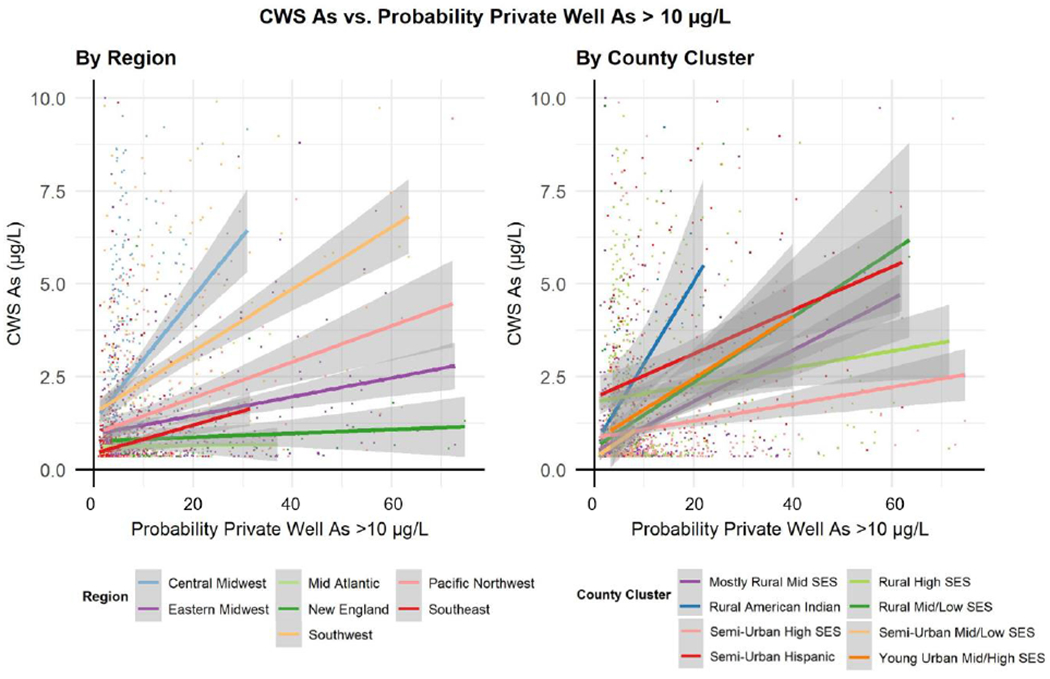
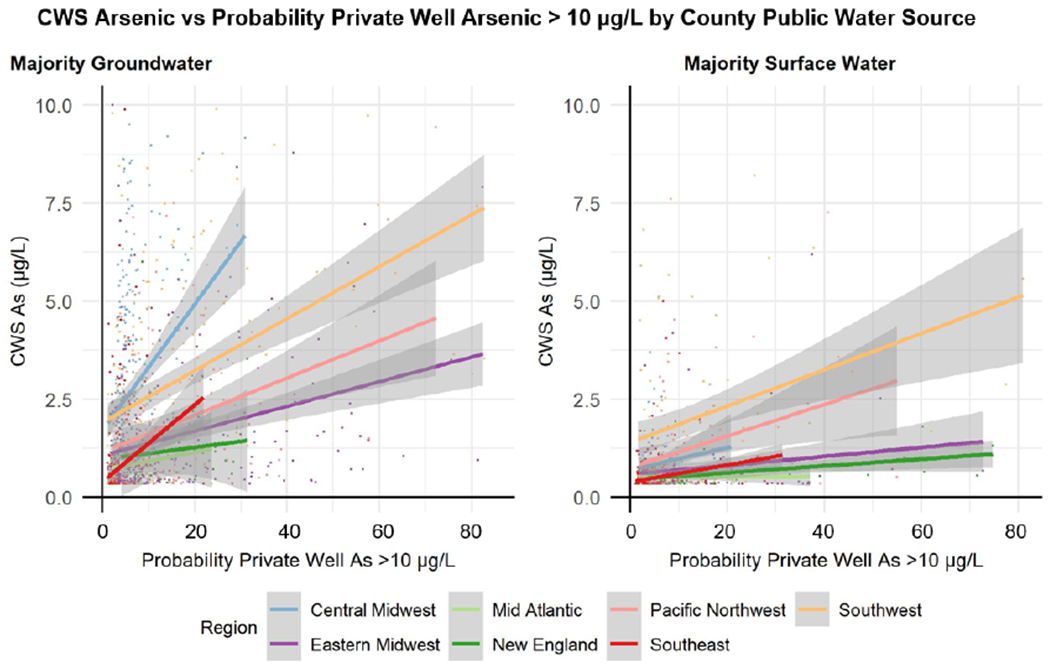
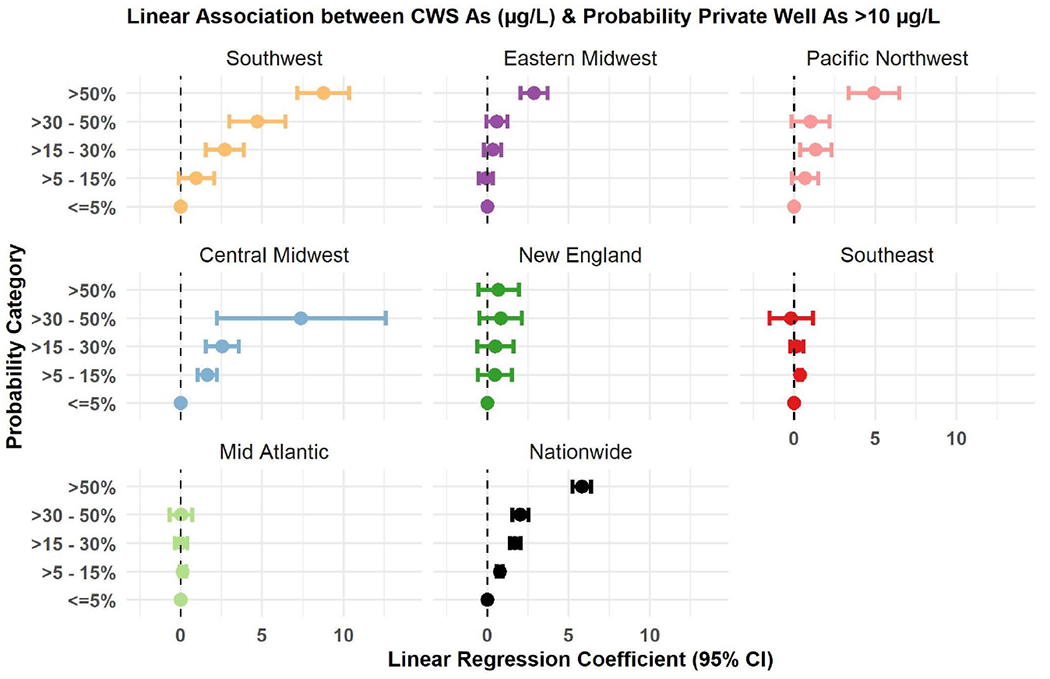
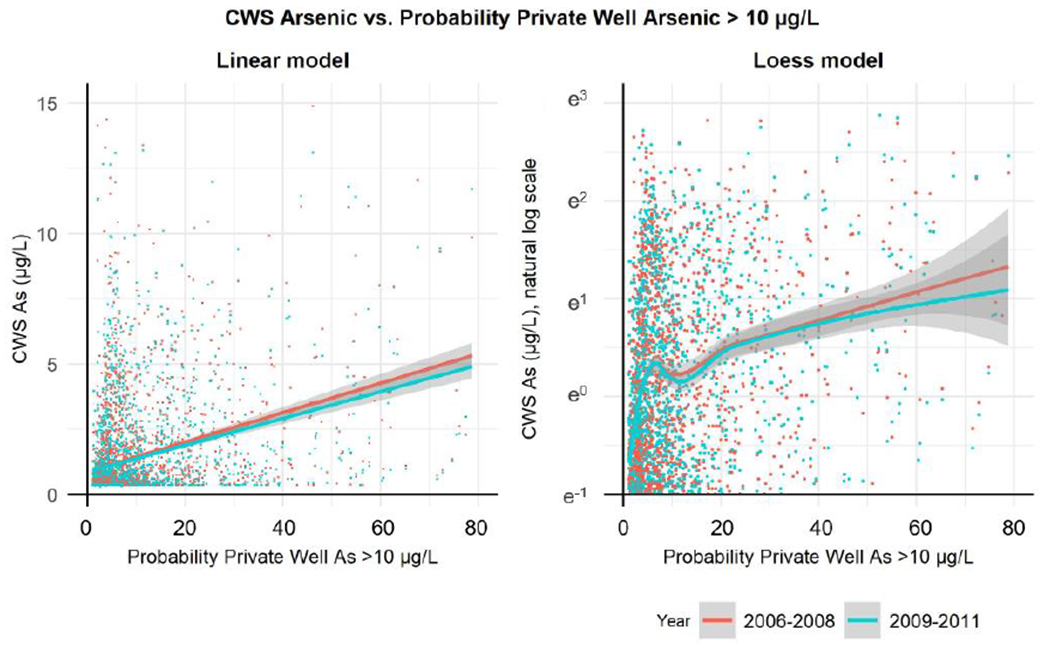
Geogenic arsenic contamination typically occurs in groundwater as opposed to surface water supplies. Groundwater is a major source for many community water systems (CWSs) in the United States (US). Although the US Environmental Protection Agency sets the maximum contaminant level (MCL enforceable since 2006: 10 μg/L) for arsenic in CWSs, private wells are not federally regulated. We evaluated county-level associations between modeled values of the probability of private well arsenic exceeding 10 μg/L and CWS arsenic concentrations for 2231 counties in the conterminous US, using time invariant private well arsenic estimates and CWS arsenic estimates for two time periods. Nationwide, county-level CWS arsenic concentrations increased by 8.4 μg/L per 100% increase in the probability of private well arsenic exceeding 10 μg/L for 2006-2008 (the initial compliance monitoring period after MCL implementation), and by 7.3 μg/L for 2009-2011 (the second monitoring period following MCL implementation) (1.1 μg/L mean decline over time). Regional differences in this temporal decline suggest that interventions to implement the MCL were more pronounced in regions served primarily by groundwater. The strong association between private well and CWS arsenic in Rural, American Indian, and Semi Urban, Hispanic counties suggests that future research and regulatory support are needed to reduce water arsenic exposures in these vulnerable subpopulations. This comparison of arsenic exposure values from major private and public drinking water sources nationwide is critical to future assessments of drinking water arsenic exposure and health outcomes.
Keywords: Arsenic; Drinking water; Environment and Public Health; Water pollution.
Copyright © 2021 Elsevier B.V. All rights reserved.
Conflict of interest statement
Declaration of competing interest The authors declare that they have no known competing financial interests or personal relationships that could have appeared to influence the work reported in this paper.
Figures
Similar articles
-
Inequalities in Public Water Arsenic Concentrations in Counties and Community Water Systems across the United States, 2006-2011.Environ Health Perspect. 2020 Dec;128(12):127001. doi: 10.1289/EHP7313. Epub 2020 Dec 9. Environ Health Perspect. 2020. PMID: 33295795 Free PMC article.
-
Arsenic in private well water and birth outcomes in the United States.Environ Int. 2022 May;163:107176. doi: 10.1016/j.envint.2022.107176. Epub 2022 Mar 26. Environ Int. 2022. PMID: 35349912 Free PMC article.
-
Machine Learning Models of Arsenic in Private Wells Throughout the Conterminous United States As a Tool for Exposure Assessment in Human Health Studies.Environ Sci Technol. 2021 Apr 20;55(8):5012-5023. doi: 10.1021/acs.est.0c05239. Epub 2021 Mar 17. Environ Sci Technol. 2021. PMID: 33729798 Free PMC article.
-
Arsenic in private drinking water wells: an assessment of jurisdictional regulations and guidelines for risk remediation in North America.J Water Health. 2014 Sep;12(3):372-92. doi: 10.2166/wh.2014.054. J Water Health. 2014. PMID: 25252340 Review.
-
Lessons Learned from Arsenic Mitigation among Private Well Households.Curr Environ Health Rep. 2017 Sep;4(3):373-382. doi: 10.1007/s40572-017-0157-9. Curr Environ Health Rep. 2017. PMID: 28741248 Free PMC article. Review.
Cited by
-
Prioritizing water availability study settings to address geogenic contaminants and related societal factors.Environ Monit Assess. 2024 Feb 24;196(3):303. doi: 10.1007/s10661-024-12362-2. Environ Monit Assess. 2024. PMID: 38400911 Free PMC article.
-
Regional and racial/ethnic inequalities in public drinking water fluoride concentrations across the US.J Expo Sci Environ Epidemiol. 2024 Jan;34(1):68-76. doi: 10.1038/s41370-023-00570-w. Epub 2023 Jun 30. J Expo Sci Environ Epidemiol. 2024. PMID: 37391608 Free PMC article.
-
Socioeconomic vulnerability and public water arsenic concentrations across the US.Environ Pollut. 2022 Nov 15;313:120113. doi: 10.1016/j.envpol.2022.120113. Epub 2022 Sep 6. Environ Pollut. 2022. PMID: 36084737 Free PMC article.
-
Contribution of arsenic and uranium in private wells and community water systems to urinary biomarkers in US adults: The Strong Heart Study and the Multi-Ethnic Study of Atherosclerosis.J Expo Sci Environ Epidemiol. 2024 Jan;34(1):77-89. doi: 10.1038/s41370-023-00586-2. Epub 2023 Aug 9. J Expo Sci Environ Epidemiol. 2024. PMID: 37558699 Free PMC article.
-
A Current Review of Water Pollutants in American Continent: Trends and Perspectives in Detection, Health Risks, and Treatment Technologies.Int J Environ Res Public Health. 2023 Mar 3;20(5):4499. doi: 10.3390/ijerph20054499. Int J Environ Res Public Health. 2023. PMID: 36901509 Free PMC article. Review.
References
-
- Ahmad A, Van der Wens P, Baken K, de Waal L, Bhattacharya P, & Stuyfzand P Arsenic reduction to <1 μg/L in Dutch drinking water. Environment International 2020; 134: 105253. - PubMed
-
- Alfredo K, Seidel C, & Roberson JA . Reviewing the occurrence data used in the revised Arsenic Rule. Journal of American Water Works Association 2014; 106: E139–E149. doi:10.5942/jawwa.2014.106.0038. - DOI
-
- Ayotte JD, Belaval M, Olson SA, Burow KR, Flanagan SM, Hinkle SR, & Lindsey BD Factors affecting temporal variability of arsenic in groundwater used for drinking water supply in the United States. Science of the Total Environment 2015; 505: 1370–1379. - PubMed
-
- Becker RA, Wilks AR, & Brownrigg R . mapdata: Extra Map Databases. R package version 2.3.0. 2018, https://CRAN.R-project.org/package=mapdata.
MeSH terms
Substances
Grants and funding
LinkOut - more resources
Full Text Sources
Other Literature Sources
Medical
