. 2021 Aug;1866(8):158965.
doi: 10.1016/j.bbalip.2021.158965. Epub 2021 May 14.

The biosynthesis of phospholipids is linked to the cell cycle in a model eukaryote

Affiliations

The biosynthesis of phospholipids is linked to the cell cycle in a model eukaryote

Milada Vítová et al. Biochim Biophys Acta Mol Cell Biol Lipids. 2021 Aug.

Abstract

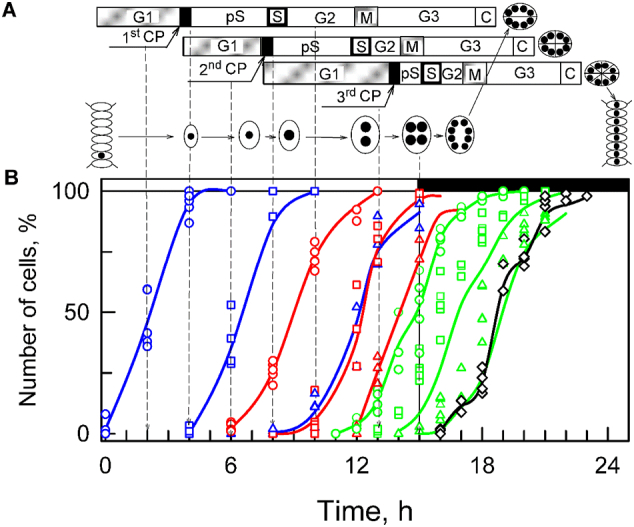
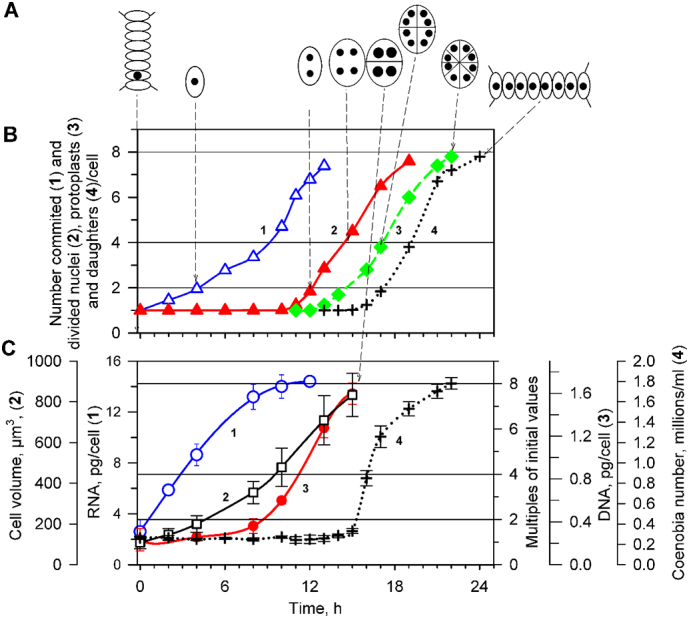
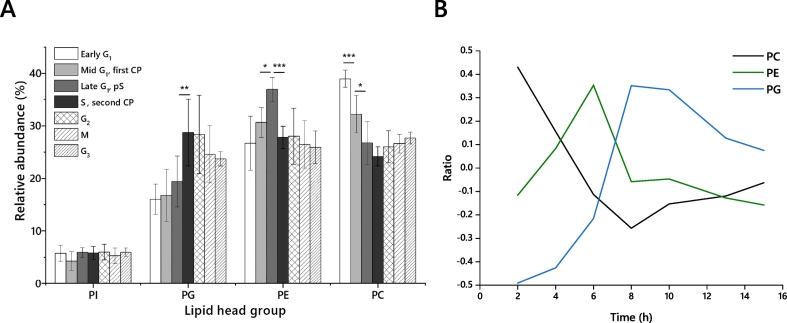
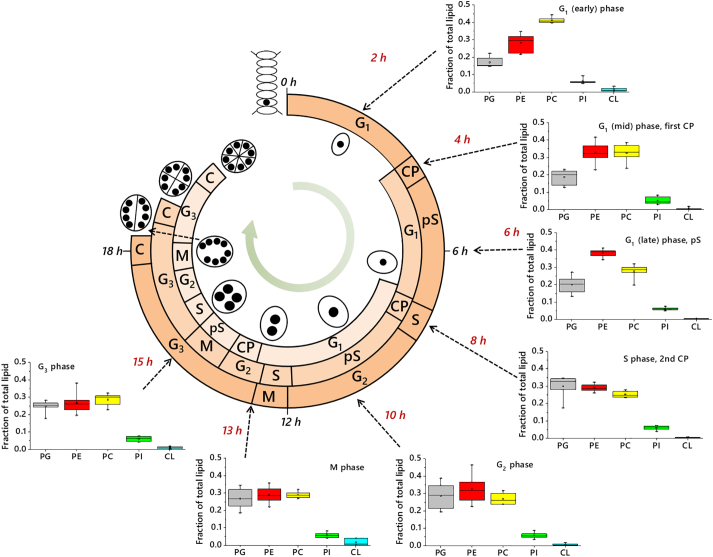
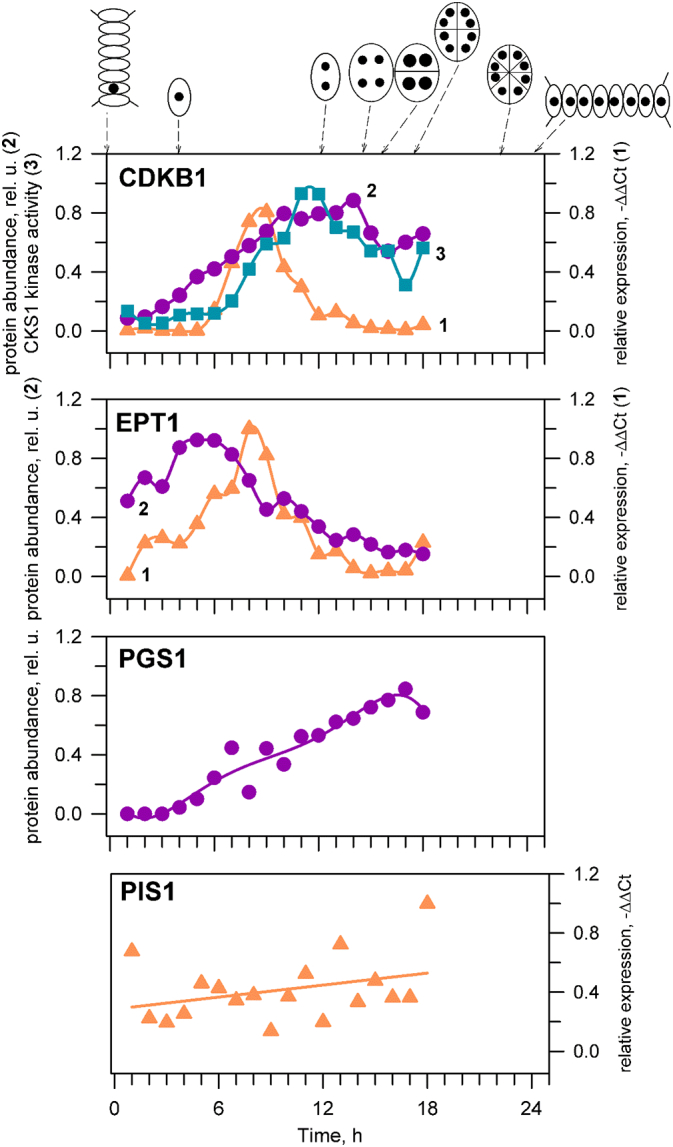
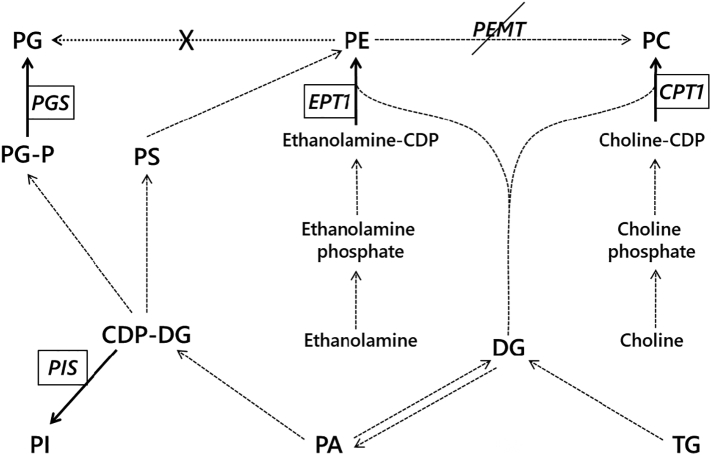
The structural challenges faced by eukaryotic cells through the cell cycle are key for understanding cell viability and proliferation. We tested the hypothesis that the biosynthesis of structural lipids is linked to the cell cycle. If true, this would suggest that the cell's structure is important for progress through and perhaps even control of the cell cycle. Lipidomics (31P NMR and MS), proteomics (Western immunoblotting) and transcriptomics (RT-qPCR) techniques were used to profile the lipid fraction and characterise aspects of its metabolism at seven stages of the cell cycle of the model eukaryote, Desmodesmus quadricauda. We found considerable, transient increases in the abundance of phosphatidylethanolamine during the G1 phase (+35%, ethanolamine phosphate cytidylyltransferase increased 2·5×) and phosphatidylglycerol (+100%, phosphatidylglycerol synthase increased 22×) over the G1/pre-replication phase boundary. The relative abundance of phosphatidylcholine fell by ~35% during the G1. N-Methyl transferases for the conversion of phosphatidylethanolamine into phosphatidylcholine were not found in the de novo transcriptome profile, though a choline phosphate transferase was found, suggesting that the Kennedy pathway is the principal route for the synthesis of PC. The fatty acid profiles of the four most abundant lipids suggested that these lipids were not generally converted between one another. This study shows for the first time that there are considerable changes in the biosynthesis of the three most abundant phospholipid classes in the normal cell cycle of D. quadricauda, by margins large enough to elicit changes to the physical properties of membranes.

Keywords: Cell cycle; Cell division; Cell structure; Desmodesmus quadricauda; Green algae; Lipid composition; Lipid metabolism.


Conflict of interest statement

The authors declare no conflict of interest.

Figures

Fig. 1
Fig. 1
Diagram illustrating cell cycle pattern in synchronised chlorococcal alga Desmodesmus quadricauda grown under present experimental conditions (A). The three horizontal strips illustrate the simultaneous course of different phases from three consecutive sequences of growth and reproductive events. The individual sequences during which growth and reproductive processes lead to duplication of cell structures occur within one cell cycle. The cells divide into eight daughter cells connected in one coenobium. Designation of phases and events: G1, a pre-commitment phase, during which the threshold size of the cell is attained and completed by attainment of the commitment point. CP: commitment point, the stage at which the cell becomes committed to triggering and terminating of the sequence of processes leading to the duplication of reproductive structures (post-commitment period), which consists of: pS: the pre-replication phase between the commitment point and the beginning of DNA replication. The processes required for the initiation of DNA replication are assumed to happen during this phase. This phase is designated as late G1 phase in mammalian cells. S: the phase during which DNA replication takes place. G2: the phase between the termination of DNA replication and the start of mitosis. Processes leading to the initiation of mitosis are assumed to take place during this phase. M: the phase during which nuclear division occurs. G3: the phase between nuclear division and cell division. The processes leading to cellular division are assumed to take place during this phase. C: cytokinesis, the phase during which protoplast fission and forming of daughter cells is performed. Schematic pictures of cells indicate their size changes during the cell cycle and the black spots inside illustrate the size and number of nuclei. The size of the black spots indicates DNA level per nucleus. Time courses of individual commitment points, nuclear division, protoplast fission and daughter cell release (B) in the experimental cultures used in this work (n = 6). Blue lines: cumulative percentage of the cells, which attained the commitment point for the first (circles), second (squares) and third (triangles) reproductive sequences, respectively; red lines: cumulative percentage of the cells, in which the first (circles), second (squares), and third (triangles) nuclear divisions were terminated; green lines: cumulative percentage of cells, in which the first (circles), second (squares) and third (triangles) cell divisions were terminated, respectively; black line, empty diamonds: percentage of the cells that released daughter coenobia. Light (15 h) and dark periods (9 h) are marked by stripes above panels and separated by vertical lines. The lines represent the means of at least six independent experiments. The raw values are plotted as dots and the line connects the mean values of the experiments. All values were calculated per parental cell, even after their division (17:00 to 22:00 h). Vertical dashed lines with arrows indicate time of sampling for lipidomics.
Fig. 2
Fig. 2
Characteristics of cell cycle progression and growth in the cultures used in this study: (A) Schematics of cell in the population at particular time. (B) Time course of cell cycle events: attainment of commitment points (curve 1, blue triangles △), nuclear divisions (curve 2,red triangles ▲) protoplast fissions (curve 3, green diamonds ◆) and daughter coenobia release (curve 4, black crosses +). The values plotted here are a cumulative version of the same data plotted on Fig. 1 to allow direct comparison with growth events. (C) Time course of growth events: RNA (curve 1, blue circles ○), mean cell volume (curve 2, black squares □) DNA replications (curve 3, red circles ●), and changes in cell number (curve 4, black crosses). Horizontal solid lines indicate doublings of initial value, vertical dashed lines with arrows indicate the schematics of a cell at given timepoint. All data of analytical analyses are presented as means ±SD of six experiments. Growth conditions: incident light intensity 750 μmol m−2 s−1, mean light intensity 530 μmol m−2 s−1, continuous illumination, 2% of CO2 in aerating air, temperature 30 °C.
Fig. 3
Fig. 3
The lipid head group profile of the four most abundant lipids in D. quadricauda, determined using 31P NMR. Panel A, the abundance as a percentage of total phospholipid. The integral of resonance(s) assigned to each head group was calculated as a fraction of the total for that spectrum and the mean and standard deviation of all values taken to generate the values used. n = 6 values collected. Panel B, Ratio of lipid abundance, calculated by dividing the value for each lipid class at each collection point by the average throughout the cycle (shown as the log2). Collection points of cell cultures are assigned as: +2 h, early part of G1; +4 h, mid-G1 (first CP); +6 h, end of G1 and pS; +8 h, S and second CP; +10 h, G2; +13 h, M; +15 h, G3. The presence of all lipid species was verified by HRMS/MS. Error bars indicate standard deviation. Asterisks indicate p-values from Student's t-tests that fall below given thresholds; *, p < 0·05; **, p < 0·01; ***, p < 0·001. PC, phosphatidylcholine; PE, phosphatidylethanolamine; PG, phosphatidylglycerol; PI, phosphatidylinositol.
Fig. 4
Fig. 4
The relationship between the multiple fission cell cycle of D. quadricauda and the abundance of its principal structural lipids. Inset box and whisker plots show the distribution of n = 6 values collected from 31P NMR measurements for the five most abundant phospholipids, shown as the fraction of total lipid (relative abundance, e.g. 0·5 = 50%). Ordinate axes show the relative abundance as a fraction of total lipid as 1·0. Abscissa axes show lipid head groups. Dashed arrows indicate sampling times (times shown in red). Schematic representations of the DNA synthesis/nuclei in the cell shown towards the middle. Lipid abbreviations: PC, phosphatidylcholine; PE, phosphatidylethanolamine; PG, phosphatidylglycerol; PI, phosphatidylinositol. Phases of the cell cycle: CP, commitment point; G1, first gap phase; G2, second gap phase; G3, third gap phase; M, Mitosis; pS, pre-synthesis phase.
Fig. 5
Fig. 5
The mRNA expression (RT-qPCR), protein abundance (Immunoblotting) and activity (kinase activity) of a single cell cycle (CDKB) and three lipid metabolism genes during cell cycle. The cell cycle progression is documented by schematics above the panels and by the mRNA abundance (orange triangles), protein abundance (purple circles) and activity (light blue squares) of a cell cycle regulator, CDKB. Abundance of mRNA (orange triangles) and protein abundance (purple circles) of ethanolamine phosphate transferase (EPT1), phosphatidylglycerol synthase (PGS1) and phosphatidylinositol synthase (PIS1). The data from RT-qPCR were normalized against 18S RNA. The data from Immunoblotting were normalized to the signal of RuBISCo in the same samples. All the data were normalized to the maximum value in the dataset to allow for a simple comparison.
Fig. 6
Fig. 6
General phospholipid metabolism in the cytosol and Endoplasmic Reticulum of Chlorella spp. and other microalgae [[80], [81], [82], [83]]. Dashed arrows represent previously reported conversions, enzyme names omitted for clarity. Solid lines represent positive identification of the appropriate enzyme and resulting lipid in the present study. A dotted line with a cross indicates a connection that could not be made in the present study. Phosphatidylethanolamine N-methyltransferase (PEMT) could not be found in this organism. CPT1, choline phosphate transferase; EPT1, Ethanolamine phosphate transferase; PGS, phosphatidylglycerol synthase; PIS, phosphatidylinositol synthase. CDP-DAG, cytidine diphosphate diglyceride; CL, cardiolipin; DG, diglyceride; PA, phosphatidic acid; PC, phosphatidylcholine; PE, phosphatidylethanolamine; PG, phosphatidylglycerol; PI, phosphatidylinositol; PS, phosphatidylserine; TG, triglyceride.

Similar articles

Cited by

References

    1. Hartwell L.H. Nobel lecture: yeast and cancer. Biosci. Rep. 2002;22:373–394. - PubMed
    1. Hunt T. Nobel lecture: protein synthesis, proteolysis, and cell cycle transitions. Biosci. Rep. 2002;22:465–486. - PubMed
    1. Nurse P. Cyclin dependent kinases and cell cycle control (nobel lecture) ChemBioChem. 2002;3:596–603. - PubMed
    1. Mironov V., Veylder L. De, Montagu M. Van, Inzé D. Cyclin-dependent kinases and cell division in plants—the Nexus. Plant Cell. 1999;11:509–521. - PMC - PubMed
    1. Renaudin J.-P., Doonan J.H., Freeman D., Hashimoto J., Hirt H., Inzé D., Jacobs T., Kouchi H., Rouzé P., Sauter M., Savouré A., Sorrell D.A., Sundaresan V., Murray J.A.H. Plant cyclins: a unified nomenclature for plant A-, B- and D-type cyclins based on sequence organization. Plant Mol. Biol. 1996;32:1003–1018. - PubMed

MeSH terms

LinkOut - more resources