. 2021 Aug 1;48(8S):S78-S87.
doi: 10.1097/OLQ.0000000000001471.

Genomic Analysis of the Predominant Strains and Antimicrobial Resistance Determinants Within 1479 Neisseria gonorrhoeae Isolates From the US Gonococcal Isolate Surveillance Project in 2018

Affiliations

Genomic Analysis of the Predominant Strains and Antimicrobial Resistance Determinants Within 1479 Neisseria gonorrhoeae Isolates From the US Gonococcal Isolate Surveillance Project in 2018

Jennifer L Reimche et al. Sex Transm Dis. .

Abstract

Background: The prevalence of Neisseria gonorrhoeae (GC) isolates with elevated minimum inhibitory concentrations to various antibiotics continues to rise in the United States and globally. Genomic analysis provides a powerful tool for surveillance of circulating strains, antimicrobial resistance determinants, and understanding of transmission through a population.

Methods: Neisseria gonorrhoeae isolates collected from the US Gonococcal Isolate Surveillance Project in 2018 (n = 1479) were sequenced and characterized. Whole-genome sequencing was used to identify sequence types, antimicrobial resistance profiles, and phylogenetic relationships across demographic and geographic populations.

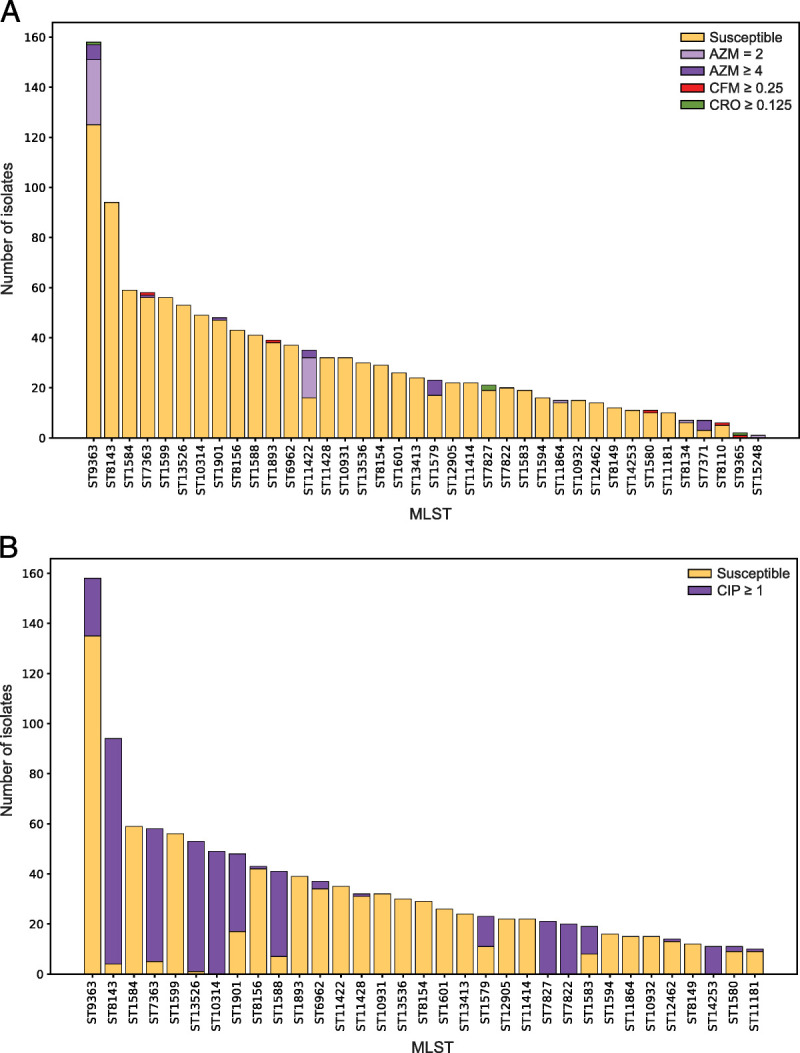
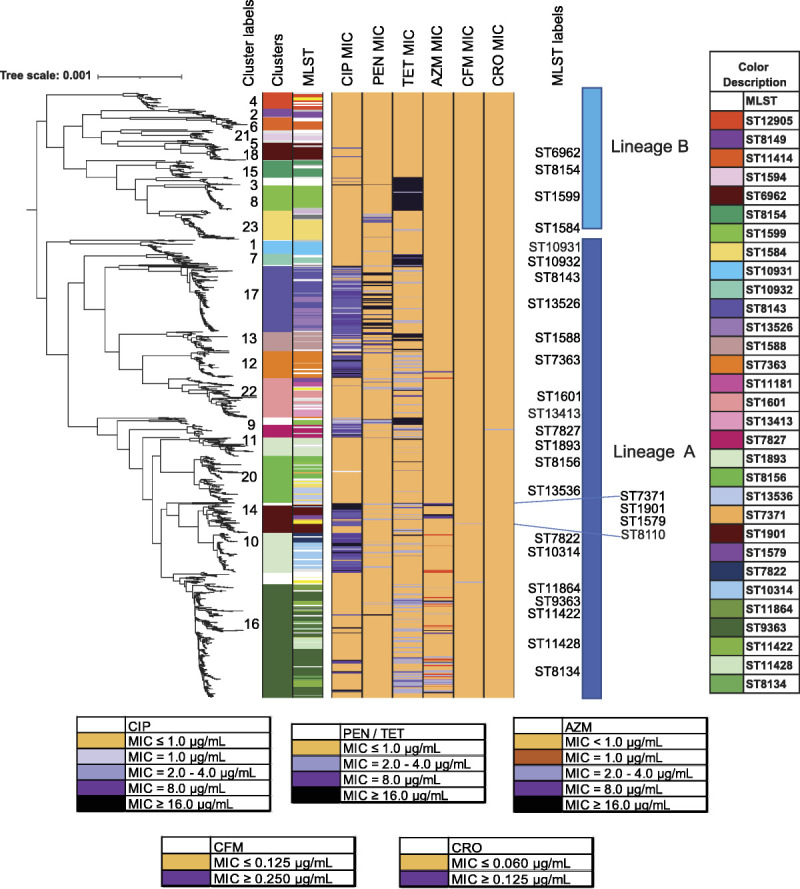
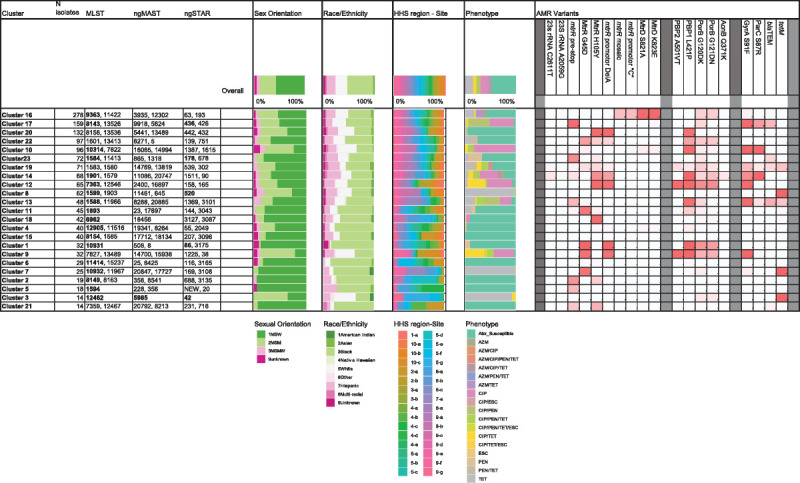
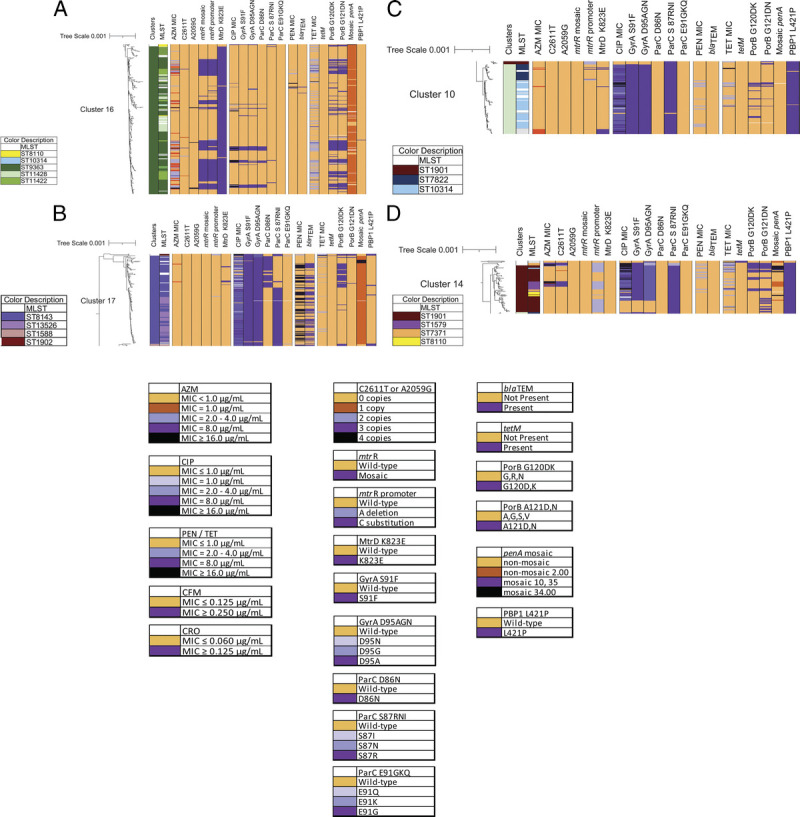
Results: Genetic characterization identified that (1) 80% of the GC isolates were represented in 33 multilocus sequence types, (2) isolates clustered in 23 major phylogenetic clusters with select phenotypic and demographic prevalence, and (3) common antimicrobial resistance determinants associated with low-level or high-level decreased susceptibility or resistance to relevant antibiotics.

Conclusions: Characterization of this 2018 Gonococcal Isolate Surveillance Project genomic data set, which is the largest US whole-genome sequence data set to date, sets the basis for future prospective studies, and establishes a genomic baseline of GC populations for local and national monitoring.


Conflict of interest statement

Conflict of Interest and Sources of Funding: This work was supported by the Centers for Disease Control and Prevention (CDC) and in part made possible through support from CDC's Combating Antibiotic Resistant Bacteria and Advanced Molecular Detection programs. This project was also supported in part by an appointment to the Research Participation Program at the CDC administered by the Oak Ridge Institute for Science and Education through an interagency agreement between the Department of Energy and the CDC (to J.L.R. and V.L.C.). Authors declare no conflict of interest.

Figures

Figure 1
Figure 1
Distribution of multilocus STs for 1479 GISP 1st 5 isolates from the United States in 2018. A, The 33 most numerous STs (that include 10 or more isolates) are shown and colored according to susceptibility to AZM, CFM, and CRO. An additional 5 STs with fewer than 10 isolates which include isolates with decreased susceptibility are also shown on the far right. B, The 33 most numerous STs (that include 10 or more isolates) are shown and colored according to susceptibility or resistance to CIP.
Figure 2
Figure 2
Maximum likelihood core-genome SNP phylogenetic alignment of 1479 GISP first 5 isolates from the United States in 2018. Maximum likelihood core-genome SNP analyses defined the 1479 isolates into 2 lineages, A and B, and into 23 clusters (“Cluster Label” left column) and color-defined in the left-most column. MLST STs are shown (with a color key to the right, listed in order of appearance) and MLST STs (“MLST Label” in center column). MLSTs with low representation are uncolored (white), with the exceptions of MLSTs ST11516, ST12093, ST11423, ST8110, ST1580 which are colored yellow. Isolate susceptibility profiles are shown for CIP, PEN, TET, AZM, CFM, and CRO and colored according to MIC (susceptible (gold), elevated MIC (shades of purple)).
Figure 3
Figure 3
Summary of genotypic, demographic, and phenotypic properties of the phylogenetic clusters defined in 1479 GISP first 5 isolates from the United States in 2018. Fastbaps clusters 1 to 23 were defined within the phylogenetic tree (Fig. 2). Figure shows the number of isolates per cluster and the most common MLST STs, ngMAST STs, and ngSTAR STs per cluster. Numbers are bold if they represent >50%. Distribution of demographic parameters per cluster is shown in the filled histograms (see color keys) for (1) sexual orientation, (2) race/ethnicity, (3) HHS region site, and (4) AMR phenotype. The proportion of isolates per cluster which carry the AMR variants at each loci is highlighted by color gradient (high proportion of variant [>75%, red] [50–75% variant, pink], low proportion of variant [25–50%, light pink], no variant [white]). Gene name and nucleotide variant or protein name and amino acid variant are listed. Descriptions and accession numbers of variants are available in Supplemental Table 3 (http://links.lww.com/OLQ/A682). AMR variants: mtrR promoter identifies adenine nucleotide deletion (Del A); mtrR promoter “C” identifies adenine to cytosine variant (A > C); PBP2 (penA) A501V/T identifies a Val or Thr variant in position 501; PorB G120DK identifies an Asp or Lys variant in position 120; PorB G121DN identifies an Asp or Asn variant in position 121; blaTEM or tetM identify the presence of the plasmid-based gene. Site identifier includes US HHS region (1–10, https://www.hhs.gov/about/agencies/iea/regional-offices/index.html) and site number per region.
Figure 4
Figure 4
Maximum likelihood core-genome SNP phylogenetic alignment close-up of clusters. Antibiotic susceptibility profiles and genetic variant profiles are specified for (A) cluster 16 (278/1479 isolates), (B) cluster 17 (158/1479 isolates), (C) cluster 10 (96/1479 isolates), and (D) cluster 14 (68/1479 isolates). Isolate susceptibility profiles are shown for CIP, PEN, TET, and AZM, and colored according to MIC with gold for susceptible and shades of purple for elevated MIC (AZM) or resistant (CIP, PEN, and TET). The variants are represented as wild-type (light orange) or mutant (light to dark purple).

References

    1. Bowen V Braxon J David D, et al. . 2018Sexually Transmitted Diseases Surveillance. Available at: https://www.cdc.gov/std/stats18/default.htm. Accessed December 11, 2020.
    1. Rowley J Vander Hoorn S Korenromp E, et al. . Chlamydia, gonorrhoea, trichomoniasis and syphilis: Global prevalence and incidence estimates, 2016. Bull World Health Organ 2019; 97:548–562P. - PMC - PubMed
    1. U.S. Centers for Disease Control and Prevention . Antibiotic Resistance Threats in the United States, 2019. Atlanta, GA: U.S. Department of Health and Human Services, CDC, 2019:1–113.
    1. Workowski KA Bolan GA, Centers for Disease Control and Prevention . Sexually transmitted diseases treatment guidelines, 2015. MMWR Recomm Rep 2015; 64(RR-03):1–137. - PMC - PubMed
    1. St Cyr S Barbee L Workowski KA, et al. . Update to CDC's Treatment Guidelines for Gonococcal Infection, 2020. MMWR Morb Mortal Wkly Rep 2020; 69:1911–1916. - PMC - PubMed

Publication types

Substances