

Non-contrast MRI of synovitis in the knee using quantitative DESS
- PMID: 33993332
- PMCID: PMC8591148
- DOI: 10.1007/s00330-021-08025-2
Non-contrast MRI of synovitis in the knee using quantitative DESS
Abstract
Objectives: To determine whether synovitis graded by radiologists using hybrid quantitative double-echo in steady-state (qDESS) images can be utilized as a non-contrast approach to assess synovitis in the knee, compared against the reference standard of contrast-enhanced MRI (CE-MRI).
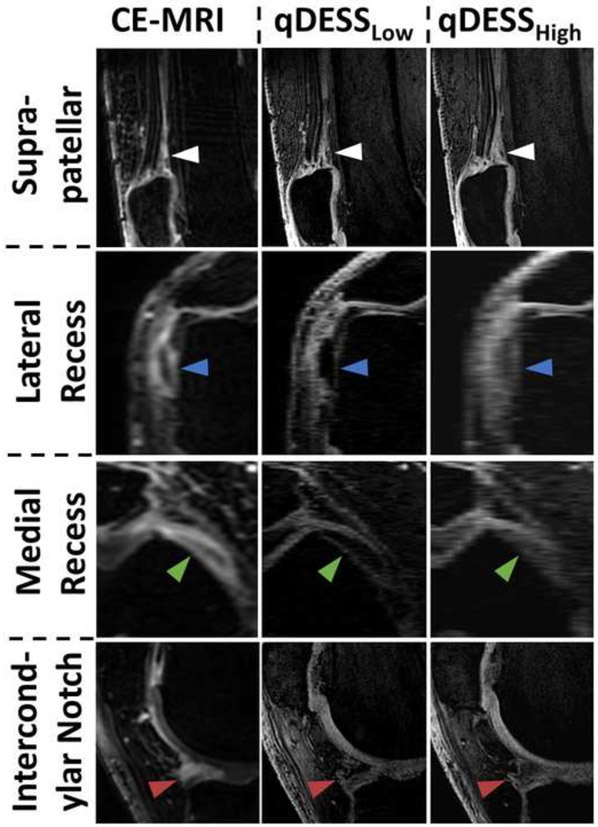
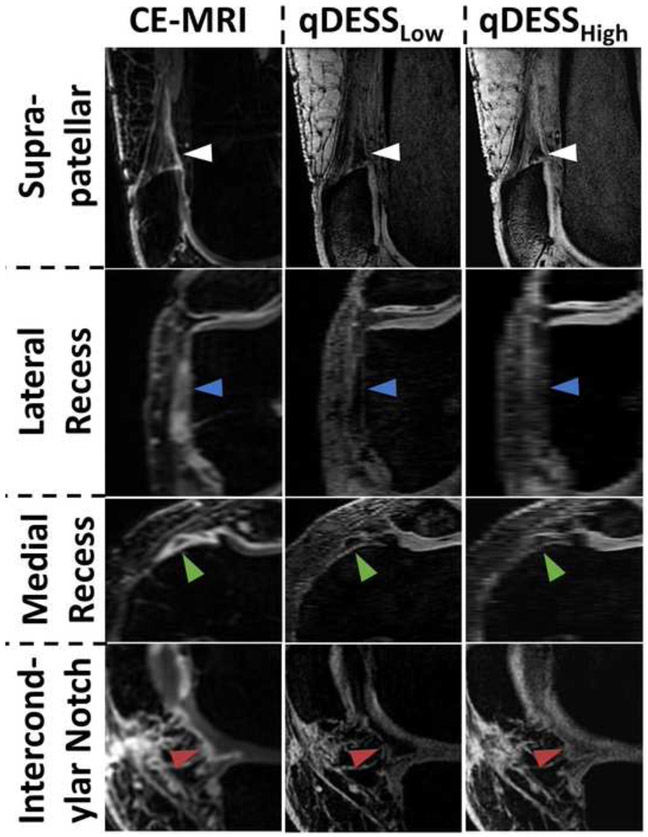
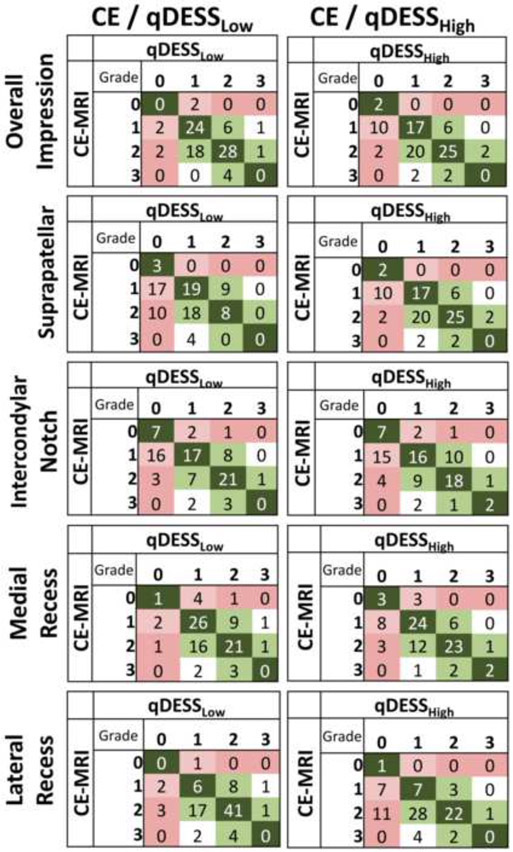
Methods: Twenty-two knees (11 subjects) with moderate to severe osteoarthritis (OA) were scanned using CE-MRI, qDESS with a high diffusion weighting (qDESSHigh), and qDESS with a low diffusion weighting (qDESSLow). Four radiologists graded the overall impression of synovitis, their diagnostic confidence, and regional grading of synovitis severity at four sites (suprapatellar pouch, intercondylar notch, and medial and lateral peripatellar recesses) in the knee using a 4-point scale. Agreement between CE-MRI and qDESS, inter-rater agreement, and intra-rater agreement were assessed using a linearly weighted Gwet's AC2.
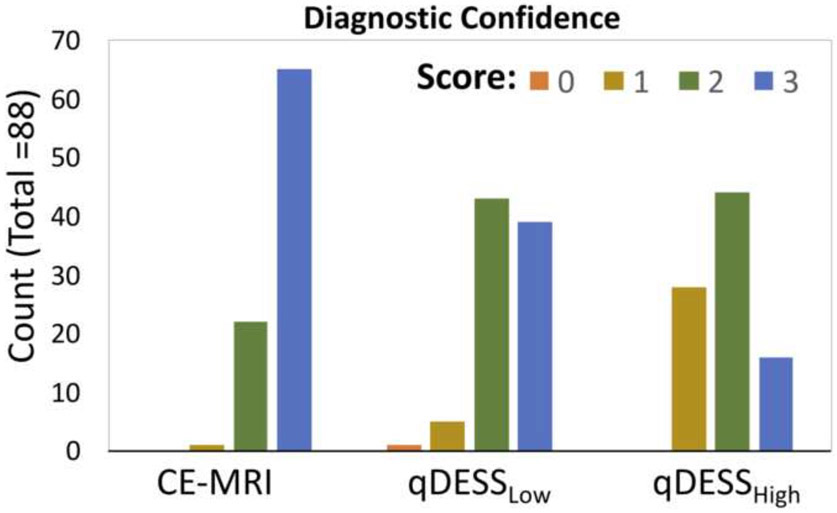
Results: Good agreement was seen between CE-MRI and both qDESSLow (AC2 = 0.74) and qDESSHigh (AC2 = 0.66) for the overall impression of synovitis, but both qDESS sequences tended to underestimate the severity of synovitis compared to CE-MRI. Good inter-rater agreement was seen for both qDESS sequences (AC2 = 0.74 for qDESSLow, AC2 = 0.64 for qDESSHigh), and good intra-rater agreement was seen for both sequences as well (qDESSLow AC2 = 0.78, qDESSHigh AC2 = 0.80). Diagnostic confidence was moderate to high for qDESSLow (mean = 2.36) and slightly less than moderate for qDESSHigh (mean = 1.86), compared to mostly high confidence for CE-MRI (mean = 2.73).
Conclusions: qDESS shows potential as an alternative MRI technique for assessing the severity of synovitis without the use of a gadolinium-based contrast agent.
Key points: The use of the quantitative double-echo in steady-state (qDESS) sequence for synovitis assessment does not require the use of a gadolinium-based contrast agent. Preliminary results found that low diffusion-weighted qDESS (qDESSLow) shows good agreement to contrast-enhanced MRI for characterization of the severity of synovitis, with a relative bias towards underestimation of severity. Preliminary results also found that qDESSLow shows good inter- and intra-rater agreement for the depiction of synovitis, particularly for readers experienced with the sequence.
Keywords: Gadolinium; Knee joint; Magnetic resonance imaging; Osteoarthritis; Synovitis.
© 2021. European Society of Radiology.
Figures
Similar articles
-
Update on recent developments in imaging of inflammation in osteoarthritis: a narrative review.Skeletal Radiol. 2023 Nov;52(11):2057-2067. doi: 10.1007/s00256-022-04267-3. Epub 2022 Dec 21. Skeletal Radiol. 2023. PMID: 36542129 Review.
-
Detection of knee synovitis using non-contrast-enhanced qDESS compared with contrast-enhanced MRI.Arthritis Res Ther. 2021 Feb 13;23(1):55. doi: 10.1186/s13075-021-02436-8. Arthritis Res Ther. 2021. PMID: 33581741 Free PMC article.
-
Double-inversion recovery with synthetic magnetic resonance: a pilot study for assessing synovitis of the knee joint compared to contrast-enhanced magnetic resonance imaging.Eur Radiol. 2019 May;29(5):2573-2580. doi: 10.1007/s00330-018-5800-9. Epub 2018 Nov 28. Eur Radiol. 2019. PMID: 30488107
-
Time-saving opportunities in knee osteoarthritis: T2 mapping and structural imaging of the knee using a single 5-min MRI scan.Eur Radiol. 2020 Apr;30(4):2231-2240. doi: 10.1007/s00330-019-06542-9. Epub 2019 Dec 16. Eur Radiol. 2020. PMID: 31844957 Free PMC article.
-
Are contrast-enhanced and non-contrast MRI findings reflecting synovial inflammation in knee osteoarthritis: a meta-analysis of observational studies.Osteoarthritis Cartilage. 2020 Feb;28(2):126-136. doi: 10.1016/j.joca.2019.10.008. Epub 2019 Oct 31. Osteoarthritis Cartilage. 2020. PMID: 31678664 Review.
Cited by
-
Gadolinium-free assessment of synovitis using diffusion tensor imaging.NMR Biomed. 2022 Jan;35(1):e4614. doi: 10.1002/nbm.4614. Epub 2021 Sep 21. NMR Biomed. 2022. PMID: 34549476 Free PMC article.
-
Update on recent developments in imaging of inflammation in osteoarthritis: a narrative review.Skeletal Radiol. 2023 Nov;52(11):2057-2067. doi: 10.1007/s00256-022-04267-3. Epub 2022 Dec 21. Skeletal Radiol. 2023. PMID: 36542129 Review.
-
Feasibility and clinical usefulness of deep learning-accelerated MRI for acute painful fracture patients wearing a splint: A prospective comparative study.PLoS One. 2023 Jun 28;18(6):e0287903. doi: 10.1371/journal.pone.0287903. eCollection 2023. PLoS One. 2023. PMID: 37379272 Free PMC article.
-
The Inter-Rater and Intra-Rater Reliability of the Actual Aquatic Skills Test (AAST) for Assessing Young Children's Motor Competence in the Water.Int J Environ Res Public Health. 2021 Dec 31;19(1):446. doi: 10.3390/ijerph19010446. Int J Environ Res Public Health. 2021. PMID: 35010700 Free PMC article.
-
Imaging of Synovial Inflammation in Osteoarthritis, From the AJR Special Series on Inflammation.AJR Am J Roentgenol. 2022 Mar;218(3):405-417. doi: 10.2214/AJR.21.26170. Epub 2021 Jul 21. AJR Am J Roentgenol. 2022. PMID: 34286595 Free PMC article. Review.
References
-
- (2019) Osteoarthritis (OA) ∣ Basics ∣ Arthritis ∣ CDC. https://www.cdc.gov/arthritis/basics/osteoarthritis.htm. Accessed 16 Nov 2019
-
- (2015) Local treatment of inflammatory joint diseases: benefits and risks. Springer Berlin Heidelberg, New York, NY
-
- Roemer FW, Kwoh CK, Hannon MJ, et al. (2015) What Comes First? Multitissue Involvement Leading to Radiographic Osteoarthritis: Magnetic Resonance Imaging-Based Trajectory Analysis Over Four Years in the Osteoarthritis Initiative. Arthritis Rheumatol 67:2085–2096. 10.1002/art.39176 - DOI - PMC - PubMed
MeSH terms
Substances
Grants and funding
LinkOut - more resources
Full Text Sources
Other Literature Sources
