. 2021 Aug;156(2):133-146.
doi: 10.1007/s00418-021-01993-y. Epub 2021 May 16.

Selective involution of thymic medulla by cyclosporine A with a decrease of mature thymic epithelia, XCR1+ dendritic cells, and epithelium-free areas containing Foxp3+ thymic regulatory T cells

Affiliations

Selective involution of thymic medulla by cyclosporine A with a decrease of mature thymic epithelia, XCR1+ dendritic cells, and epithelium-free areas containing Foxp3+ thymic regulatory T cells

Yasushi Sawanobori et al. Histochem Cell Biol. 2021 Aug.

Abstract

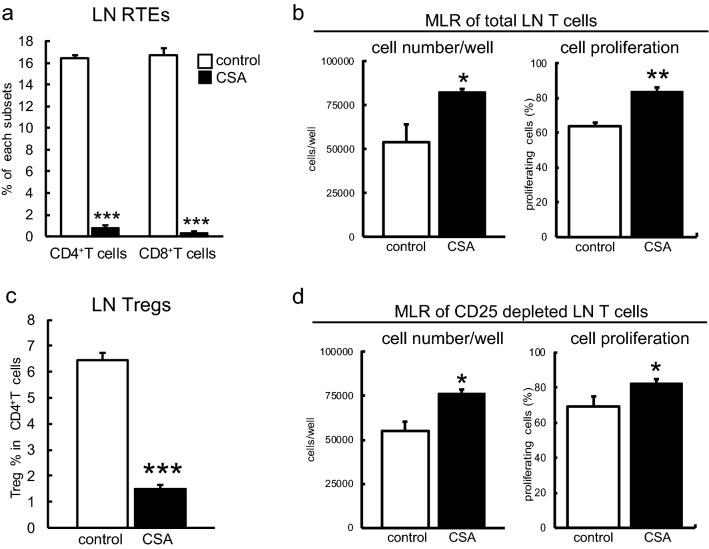
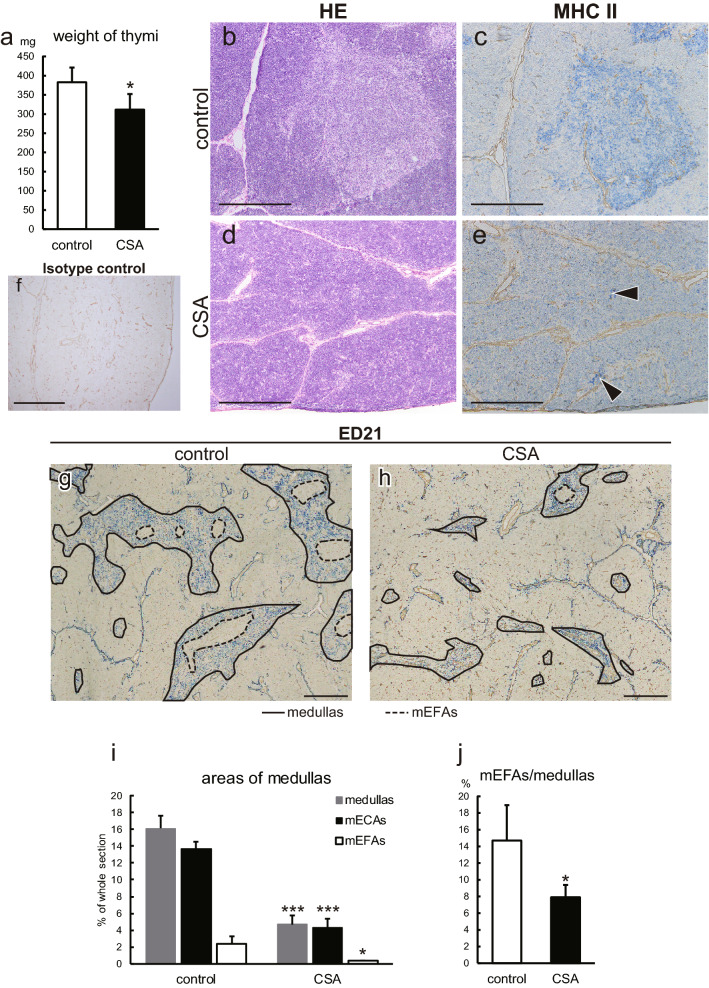
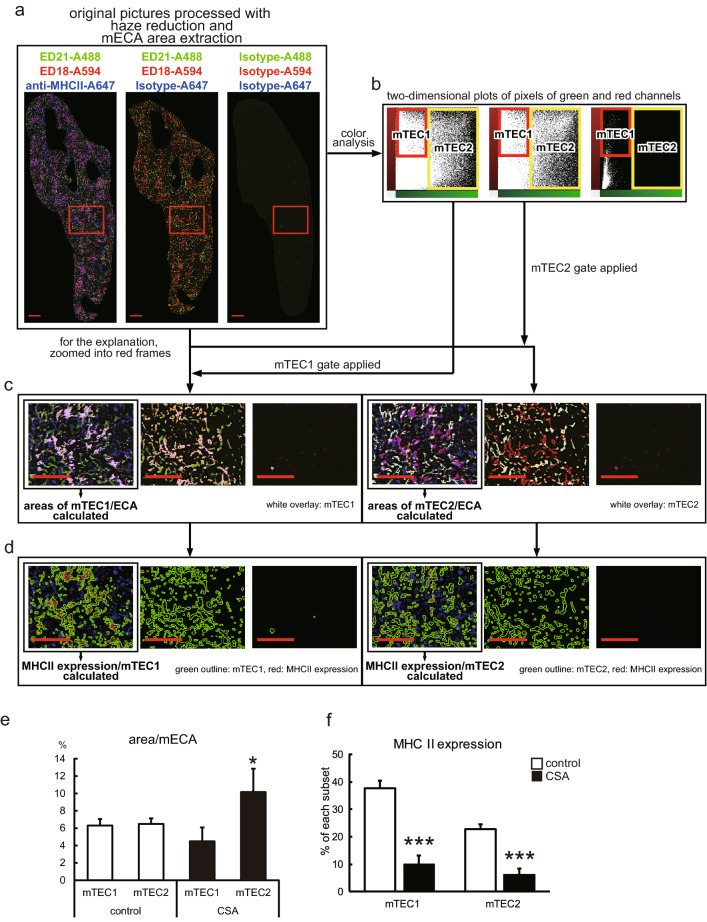
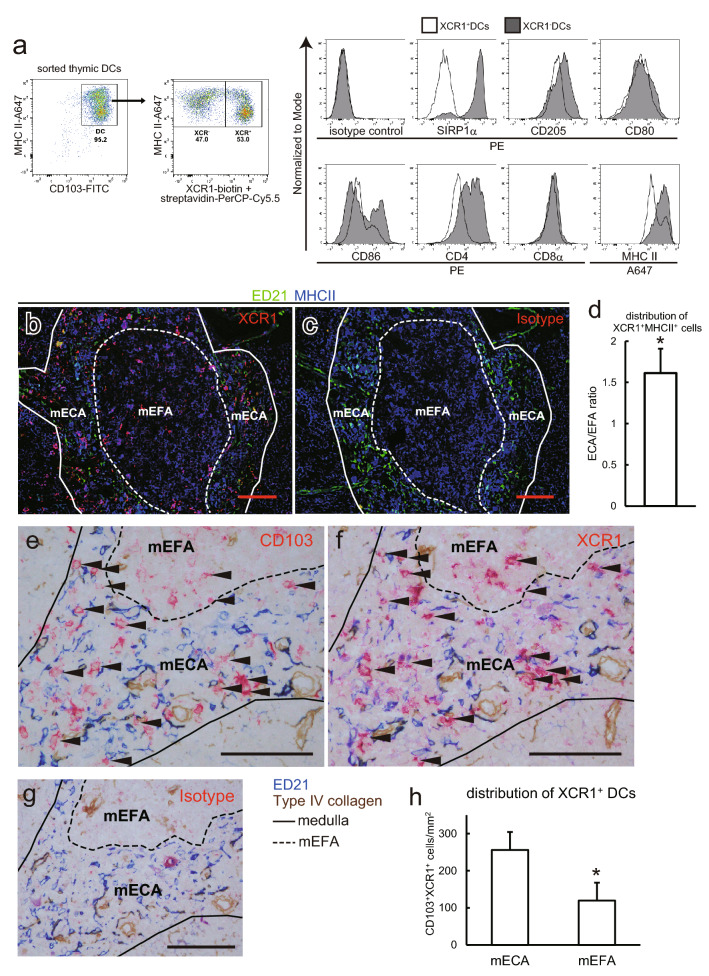
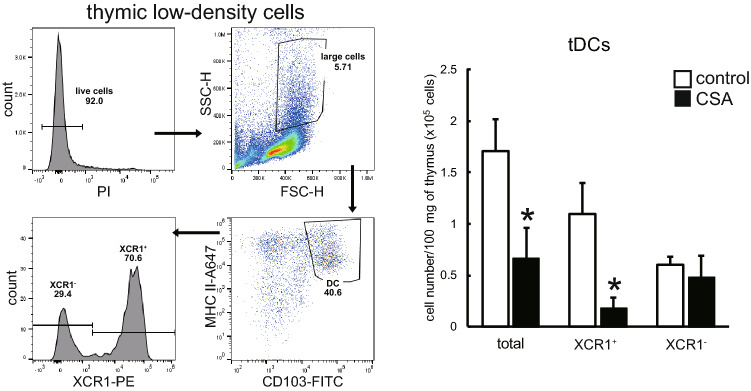
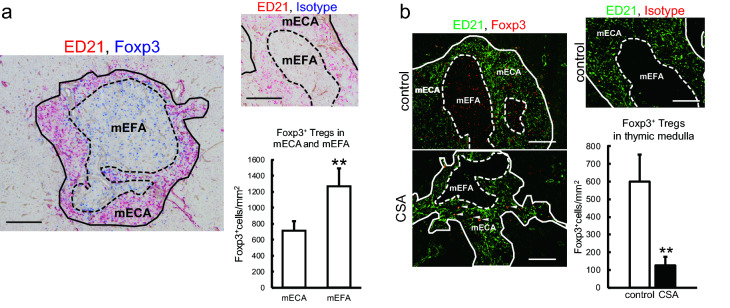
Immunosuppressive drugs such as cyclosporine A (CSA) can disrupt thymic structure and functions, ultimately inducing syngeneic/autologous graft-versus-host disease together with involuted medullas. To elucidate the effects of CSA on the thymus more precisely, we analyzed the effects of CSA on the thymus and T cell system using rats. In addition to confirming the phenomena already reported, we newly found that the proportion of recent thymic emigrants also greatly decreased, suggesting impaired supply. Immunohistologically, the medullary thymic epithelial cells (mTECs) presented with a relative decrease in the subset with a competent phenotype and downregulation of class II major histocompatibility complex molecules. In control rats, thymic dendritic cells (DCs) comprised two subsets, XCR1+SIRP1α-CD4- and XCR1-SIRP1α+CD4+. The former had a tendency to selectively localize in the previously-reported epithelium-containing areas of the rat medullas, and the number was significantly reduced by CSA treatment. The epithelium-free areas, another unique domains in the rat medullas, contained significantly more Foxp3+ thymic Tregs. With CSA treatment, the epithelium-free areas presented strong involution, and the number and distribution of Tregs in the medulla were greatly reduced. These results suggest that CSA inhibits the production of single-positive thymocytes, including Tregs, and disturbs the microenvironment of the thymic medulla, with a decrease of the competent mTECs and disorganization of epithelium-free areas and DC subsets, leading to a generation of autoreactive T cells with selective medullary involution.

Keywords: Dendritic cells; Immunosuppressive drug; Regulatory T cells; Thymic epithelial cells; Thymic structure; Thymus.


Conflict of interest statement

All authors declare that no support, financial or otherwise, has been received from any organization that may have an interest in the submitted work, and there are no other relationships or activities that could appear to have influenced the submitted work.

Figures

Fig. 1
Fig. 1
Effects of CSA on T cell homeostasis and autoreactivity. Thymi and peripheral LNs from control and CSA-administered rats were digested and analyzed by flow cytometry. a, c Ratio of CD90+ RTEs in peripheral LNs (a) and ratio of CD4+CD25+Foxp3+ Tregs in peripheral LNs (c) are displayed. Each group contains three rats in (a) and five rats in (c). b, d MLR assays were performed following the scheme in Fig. S1 to examine the autoreactivity of total peripheral T cells (b) and CD25-depleted T cells (d). Each culture was prepared in triplicate. Representative data from two independent experiments are shown. *p < 0.05, **p < 0.005, ***p < 0.0005
Fig. 2
Fig. 2
Histological overview of CSA-treated thymi. a Weight of thymi. bf Sections of freshly frozen thymi from control (b, c, f) and CSA (d, e) rats were H&E (b, d) and immunohistologically stained with an anti-MHCII (c, e) or polyclonal mouse IgG isotype control (f) antibodies followed by alkaline phosphatase-conjugated anti-mouse IgG antibody. g, h Freshly frozen sections of control (g) and CSA (h) rats were immunostained with biotin-conjugated ED21 antibody followed by alkaline phosphatase-conjugated anti-biotin antibody. Medullary areas and mEFAs are indicated by solid and broken lines, respectively. i, j Ratios of medullary, mECA, and mEFA areas in total thymic cross-sectional areas (i) and ratios of mEFA areas in the medullas (j) were measured and calculated from ED21-stained sections. On immunohistological sections, type IV collagen was also stained. Photomicrographs were taken with a 4x (g, h) or 10x (bf) objective lens. Montage images were synthesized to obtain low-powered images (g, h). Scale bars indicate 500 μm. Data from five rats in each group were statistically analyzed (a, i, j). *p < 0.05, ***p < 0.0005
Fig. 3
Fig. 3
Effects of CSA on the structure and epithelial cells of thymi. ad Scheme of the analysis. a Sections of thymi were stained with Alexa Fluor 488-conjugated ED21, Alexa Fluor 594-conjugated ED18, and Alexa Fluor 647-conjugated anti-MHCII (OX3) antibodies or corresponding isotype control antibodies. Five randomly selected medullary portions in each sample were captured with BZ-9000. A 20 × objective lens was used. Pictures were combined to recreate the whole medulla. Haze was removed, and mECAs were extracted from each combined picture by BZ-X analyzer software. b ED18 single-positive pixels and ED21 single-positive ~ ED18+ED21+ double-positive pixels were gated as mTEC1 and mTEC2 respectively. c The gates were applied to the original pictures. Ratios of the gated mTEC1 or mTEC2 areas against mECA areas were calculated and displayed in (e). d MHCII positivity in the gated mTEC1 or mTEC2 areas were displayed in (f). Each group contains five rats. *p < 0.05, ***p < 0.0005
Fig. 4
Fig. 4
DC subsets in the rat thymus. a Low-density CD103+ cells were isolated from the thymus of a normal rat and analyzed by flow cytometry. Representative data from four independent analyses are shown. bd Thymic sections from control rats were stained with anti-XCR1 (b) or mouse IgG2b isotype control (c) antibodies followed by biotin-conjugated anti-mouse IgG secondary antibody and Alexa Fluor 594-conjugated streptavidin. After blocking with polyclonal mouse IgG, Alexa Fluor 488-conjugated ED21 and Alexa Fluor 647-conjugated anti-MHCII antibody was applied. Five randomly selected medullary portions in each sample were captured with BZ-9000. A 20 × objective lens was used. Distribution of XCR1+MHCII+ pixels was analyzed and calculated (d). Each group contains five rats. One sample t test against value “1” was performed. *p < 0.05. eh Sections of normal rat thymi were stained with anti-CD103 (e), anti-XCR (f), or polyclonal mouse IgG isotype control (g) antibodies followed by biotin-conjugated anti-mouse IgG secondary antibody and alkaline phosphatase-conjugated anti-biotin antibody, and then colored with New Fuchsin. After blocking with polyclonal mouse IgG, the sections were stained with purified ED21 antibody, followed by alkaline phosphatase-conjugated anti-mouse IgM antibody, and then colored with Vector Blue to depict mECAs. Type IV collagen was also stained. e and f were serial sections. Pictures were taken with a 40 × objective lens. Scale bars indicate 100 μm. Arrowheads indicate CD103+XCR1+ cells (XCR1+ tDCs). The distribution of XCR1+ DCs was calculated and displayed (h). Three randomly selected medullas from each rat were analyzed. Three rats were included in this analysis. *p < 0.05. Scale bars in this figure indicate 100 μm. Medullas and mEFAs are indicated by solid and broken lines, respectively
Fig. 5
Fig. 5
Effects of CSA on thymic dendritic cell (tDC) subsets. Thymic low-density cells from control and CSA-administered rats were subjected to the flow cytometric analysis. The number of tDCs was calculated as [the number of obtained low-density cells × ratio of PI-negative live cells × ratio of large cells on a FSC-SSC plot × ratio of CD103+MHCII+ cells]. The numbers of XCR1+ and XCR1 subsets were calculated within tDCs. Each group contains three rats. *p < 0.05
Fig. 6
Fig. 6
Thymic tTreg localization. a Thymic sections from five control rats were stained with biotin-conjugated anti-Foxp3 or biotin-conjugated rat IgG2a isotype control antibodies, followed by alkaline phosphatase-conjugated anti-biotin antibody, and then colored with Vector Blue. Next, the sections were stained with purified ED21 antibody, followed by alkaline phosphatase-conjugated anti-mouse IgM antibody, and then colored with New Fuchsin. Type IV collagen was also stained. Photomicrographs of medullas were taken with a 10 × objective lens. Five medullary portions were randomly selected from each section and the numbers of Foxp3+ cells in mECAs and mEFAs (if present) were counted. Scale bars indicate 200 μm. b Thymic sections from control and CSA-administered rats were stained with Alexa Fluor 488-conjugated ED21 antibody and biotin-conjugated anti-Foxp3 or rat IgG2a isotype control antibody, followed by Alexa Fluor 594-streptavidin. Photomicrographs of medullas were taken with a 10 × objective lens. Five medullas were randomly selected from each section and the numbers of Foxp3+ cells in the medullary areas counted. Nonspecific staining is marked on the image by an arrowhead. Scale bars indicate 100 μm. In this figure, medullas and mEFAs are indicated by solid and broken lines, respectively. Each group contains five rats. **p < 0.005

Similar articles

Cited by

References

    1. Alexandropoulos K, Danzl NM. Thymic epithelial cells: antigen presenting cells that regulate T cell repertoire and tolerance development. Immunol Res. 2012;54(1–3):177–190. doi: 10.1007/s12026-012-8301-y. - DOI - PubMed
    1. Anderson G, Anderson KL, Conroy LA, Hallam TJ, Moore NC, Owen JJT, Jenkinson EJ. Intracellular signaling events during positive and negative selection of CD4+CD8+ thymocytes in vitro. J Immunol. 1995;154(8):3636–3643. - PubMed
    1. Barbarino JM, Staatz CE, Venkataramanan R, Klein TE, Altman RB. PharmGKB summary: cyclosporine and tacrolimus pathways. Pharmacogenet Genomics. 2013;23(10):563–585. doi: 10.1097/FPC.0b013e328364db84. - DOI - PMC - PubMed
    1. Chen WR, Thoburn C, Hess AD. Characterization of the pathogenic autoreactive T cells in cyclosporine-induced syngeneic graft-versus-host disease. J Immunol. 1998;161(12):7040–7046. - PubMed
    1. Cheney RT, Sprent J. Capacity of cyclosporine to induce auto-graft-versus-host disease and impair intrathymic T cell differentiation. Transplant Proc. 1985;17(1):528–530.

MeSH terms

LinkOut - more resources