

The Evolution of Severe Acute Respiratory Syndrome Coronavirus-2 during Pandemic and Adaptation to the Host
- PMID: 33993372
- PMCID: PMC8123100
- DOI: 10.1007/s00239-021-10008-2
The Evolution of Severe Acute Respiratory Syndrome Coronavirus-2 during Pandemic and Adaptation to the Host
Abstract
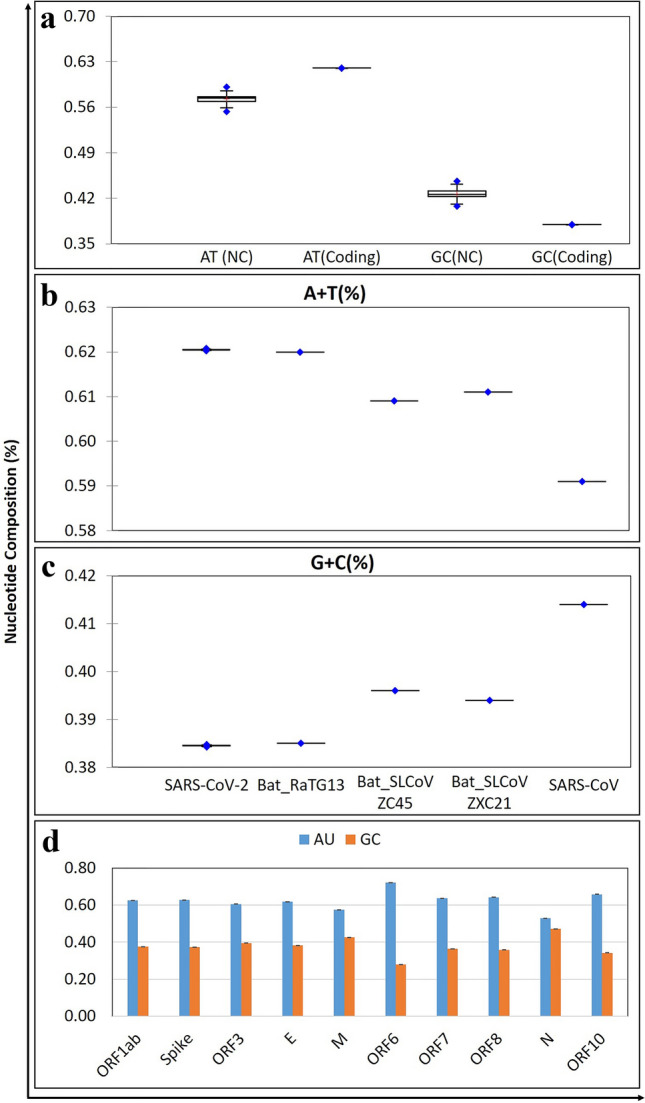
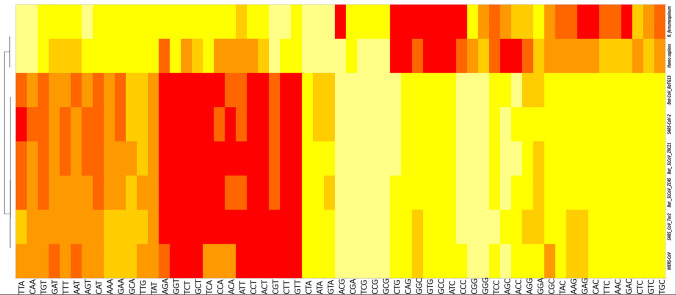
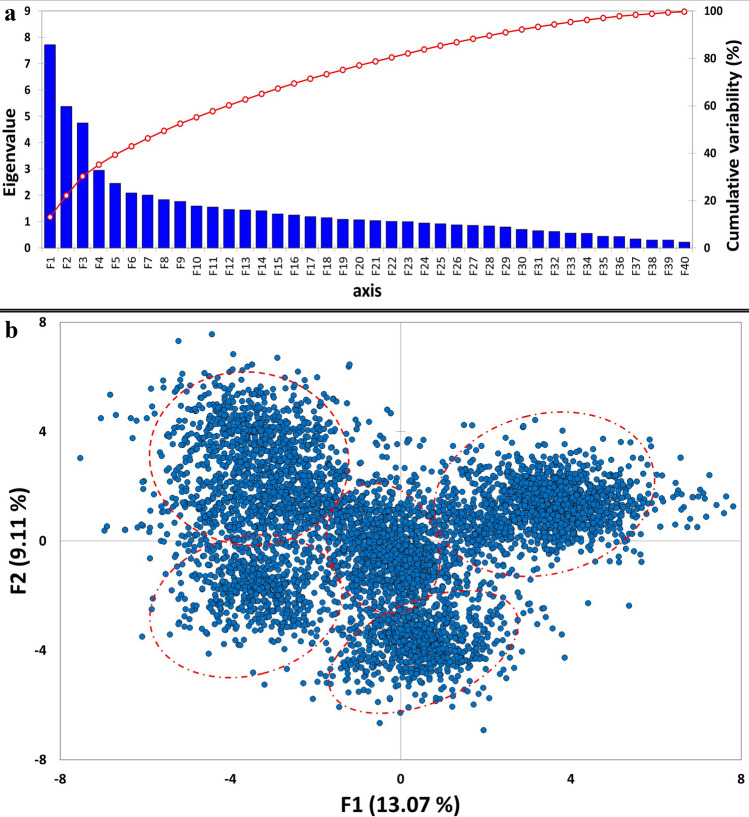
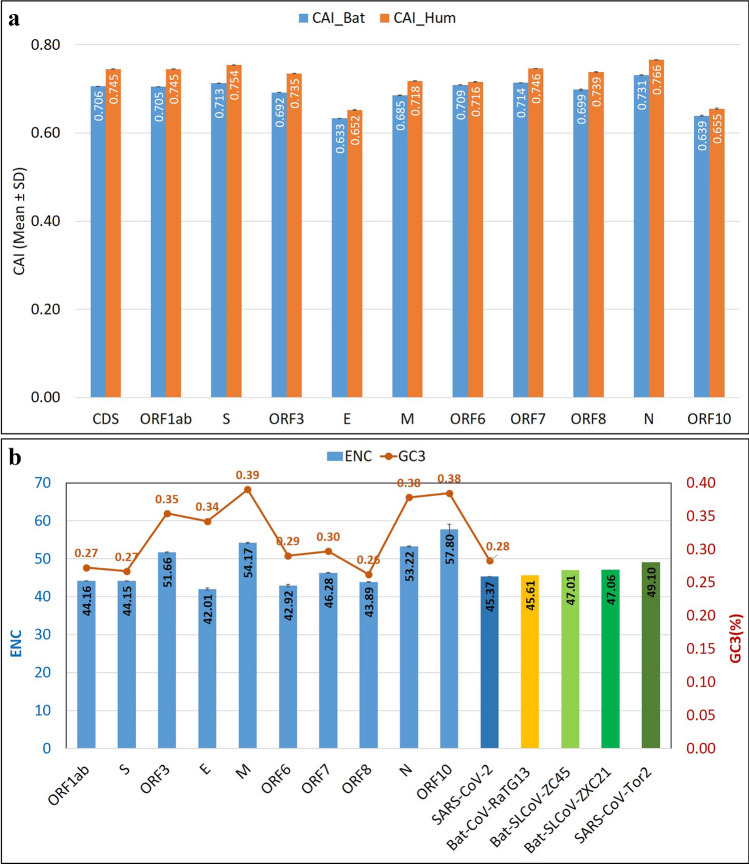
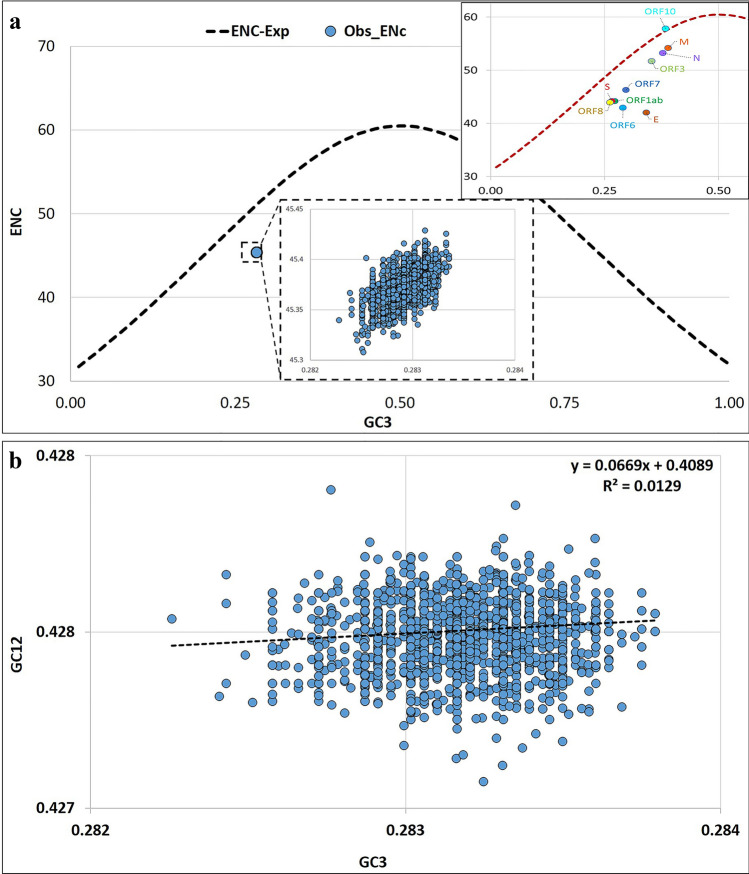
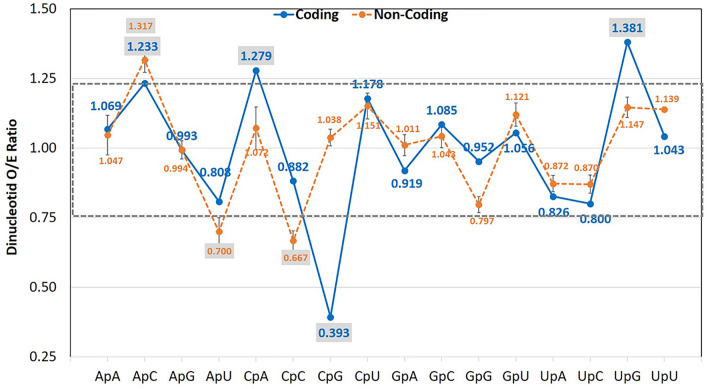
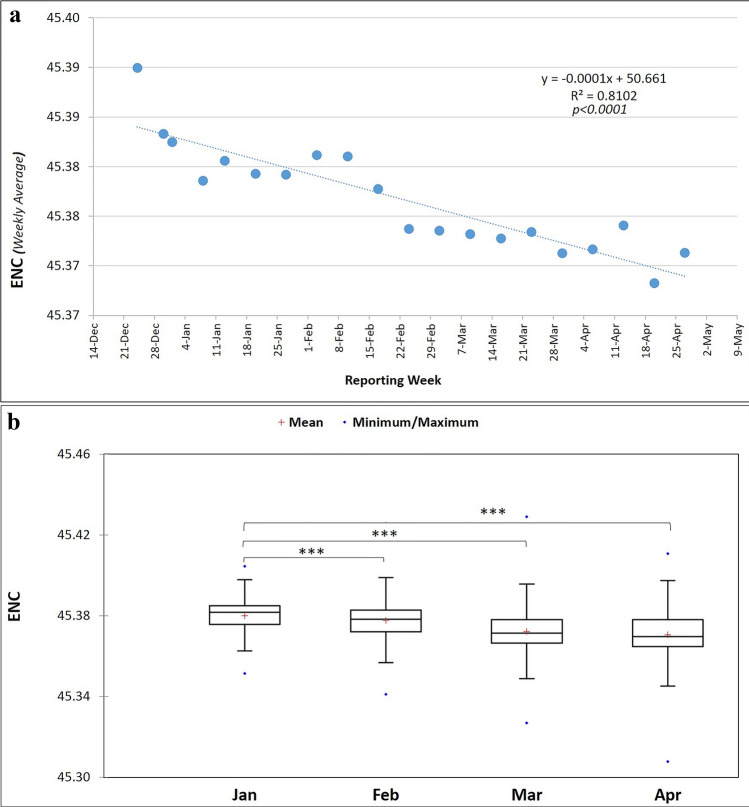
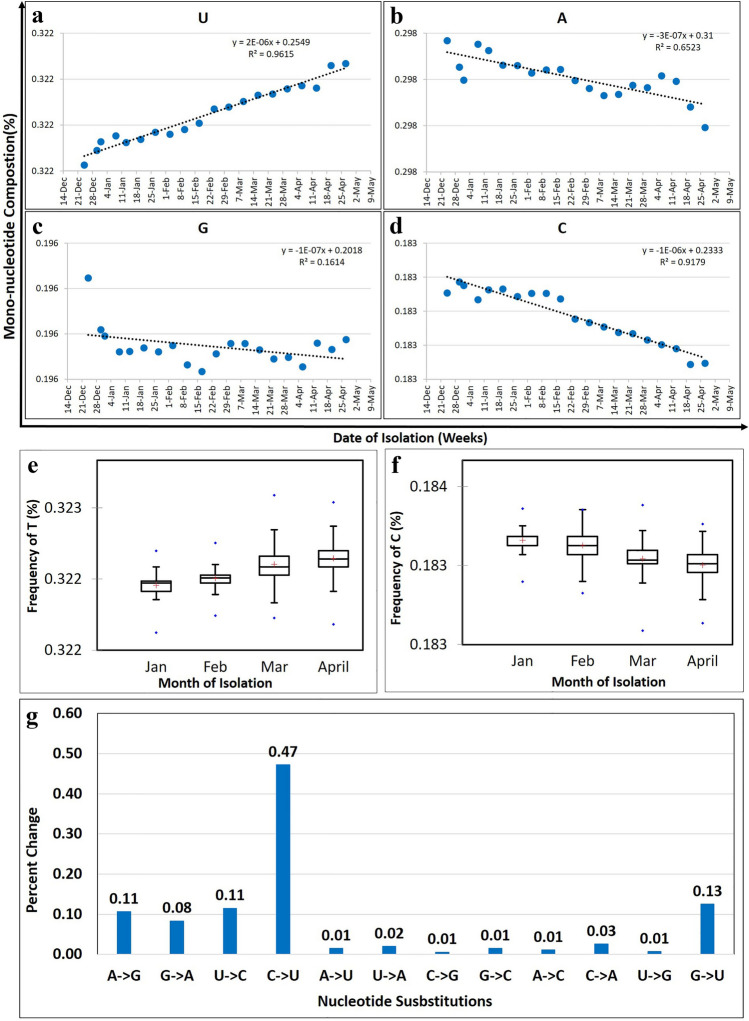
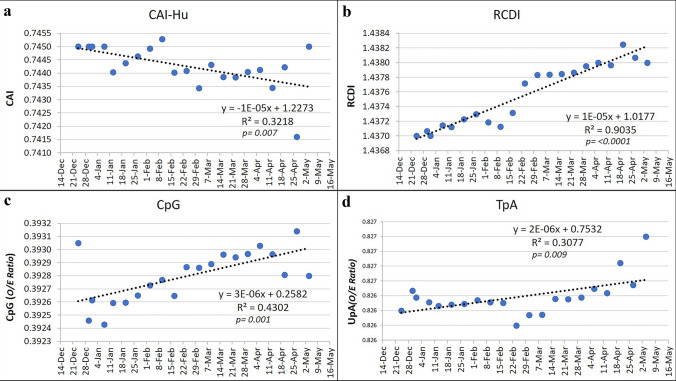
Severe Acute Respiratory Syndrome Coronavirus-2 is a zoonotic virus with a possible origin in bats and potential transmission to humans through an intermediate host. When zoonotic viruses jump to a new host, they undergo both mutational and natural selective pressures that result in non-synonymous and synonymous adaptive changes, necessary for efficient replication and rapid spread of diseases in new host species. The nucleotide composition and codon usage pattern of SARS-CoV-2 indicate the presence of a highly conserved, gene-specific codon usage bias. The codon usage pattern of SARS-CoV-2 is mostly antagonistic to human and bat codon usage. SARS-CoV-2 codon usage bias is mainly shaped by the natural selection, while mutational pressure plays a minor role. The time-series analysis of SARS-CoV-2 genome indicates that the virus is slowly evolving. Virus isolates from later stages of the outbreak have more biased codon usage and nucleotide composition than virus isolates from early stages of the outbreak.
Keywords: COVID-19; Codon usage bias; Natural selection; Sever Acute Respiratory Syndrome Coronavirus-2; Virus evolution.
Conflict of interest statement
The author(s) declared no potential conflicts of interest with respect to the research, authorship, and/or publication of this article.
Figures
Similar articles
-
Analysis of SARS-CoV-2 synonymous codon usage evolution throughout the COVID-19 pandemic.Virology. 2022 Mar;568:56-71. doi: 10.1016/j.virol.2022.01.011. Epub 2022 Feb 2. Virology. 2022. PMID: 35134624 Free PMC article.
-
Variability in Codon Usage in Coronaviruses Is Mainly Driven by Mutational Bias and Selective Constraints on CpG Dinucleotide.Viruses. 2021 Sep 10;13(9):1800. doi: 10.3390/v13091800. Viruses. 2021. PMID: 34578381 Free PMC article.
-
Analysis of codon usage of severe acute respiratory syndrome corona virus 2 (SARS-CoV-2) and its adaptability in dog.Virus Res. 2020 Oct 15;288:198113. doi: 10.1016/j.virusres.2020.198113. Epub 2020 Aug 7. Virus Res. 2020. PMID: 32771430 Free PMC article.
-
SARS-CoV-2, the pandemic coronavirus: Molecular and structural insights.J Basic Microbiol. 2021 Mar;61(3):180-202. doi: 10.1002/jobm.202000537. Epub 2021 Jan 18. J Basic Microbiol. 2021. PMID: 33460172 Free PMC article. Review.
-
Zoonotic and Reverse Zoonotic Transmissibility of SARS-CoV-2.Virus Res. 2021 Sep;302:198473. doi: 10.1016/j.virusres.2021.198473. Epub 2021 Jun 9. Virus Res. 2021. PMID: 34118360 Free PMC article. Review.
Cited by
-
Progress Report: Antimicrobial Drug Discovery in the Resistance Era.Pharmaceuticals (Basel). 2022 Mar 28;15(4):413. doi: 10.3390/ph15040413. Pharmaceuticals (Basel). 2022. PMID: 35455410 Free PMC article. Review.
-
The RdRp genotyping of SARS-CoV-2 isolated from patients with different clinical spectrum of COVID-19.BMC Infect Dis. 2024 Mar 4;24(1):281. doi: 10.1186/s12879-024-09146-x. BMC Infect Dis. 2024. PMID: 38439047 Free PMC article.
-
Analysis of 3.5 million SARS-CoV-2 sequences reveals unique mutational trends with consistent nucleotide and codon frequencies.Virol J. 2023 Feb 17;20(1):31. doi: 10.1186/s12985-023-01982-8. Virol J. 2023. PMID: 36812119 Free PMC article.
-
Analysis of SARS-CoV-2 synonymous codon usage evolution throughout the COVID-19 pandemic.Virology. 2022 Mar;568:56-71. doi: 10.1016/j.virol.2022.01.011. Epub 2022 Feb 2. Virology. 2022. PMID: 35134624 Free PMC article.
-
Construction and evaluation of a self-replicative RNA vaccine against SARS-CoV-2 using yellow fever virus replicon.PLoS One. 2022 Oct 20;17(10):e0274829. doi: 10.1371/journal.pone.0274829. eCollection 2022. PLoS One. 2022. PMID: 36264936 Free PMC article.
References
Publication types
MeSH terms
Grants and funding
LinkOut - more resources
Full Text Sources
Other Literature Sources
Medical
Miscellaneous
